
By InvestMacro | COT | Data Tables | COT Leaders | Downloads | COT Newsletter
Here are the latest charts and statistics for the Commitment of Traders (COT) data published by the Commodities Futures Trading Commission (CFTC). The latest release was delayed by the CFTC due to the New Year’s holiday.
The latest COT data is updated through Tuesday December 28th 2021 and shows a quick view of how large traders (for-profit speculators and commercial entities) were positioned in the futures markets.
Highlighting the COT bonds data is the jump in bets for the 10-Year Bond. Speculators sharply boosted their 10-Year bets by the largest one-week amount (+125,989) of the past fifteen weeks on December 28th. This rebound strongly trimmed the overall bearish level after it had hit a 97-week bearish high on December 21st at -339,299 contracts. The 10-Year speculator standing has been in bearish territory now for eleven consecutive weeks, dating back to October 19th.
Joining the 10-Year (125,989 contracts) with gains on the week were the 2-Year Bond (8,471 contracts), Ultra 10-Year (2,904 contracts), Long US Bond (16,129 contracts) and the 5-Year (47,689 contracts) while decreasing bets for the week were seen in the Eurodollar (-13,028 contracts), FedFunds (-3,900 contracts) and the Ultra US Bond (-3,156 contracts).
| Dec-28-2021 | OI | OI-Index | Spec-Net | Spec-Index | Com-Net | COM-Index | Smalls-Net | Smalls-Index |
|---|---|---|---|---|---|---|---|---|
| Eurodollar | 11,150,593 | 48 | -1,827,848 | 0 | 2,203,302 | 100 | -375,454 | 31 |
| FedFunds | 1,366,900 | 28 | -93,329 | 28 | 107,478 | 73 | -14,149 | 27 |
| 2-Year | 1,966,290 | 7 | 87,804 | 100 | -25,765 | 14 | -62,039 | 5 |
| Long T-Bond | 1,208,000 | 50 | -19,955 | 86 | -10,654 | 17 | 30,609 | 77 |
| 10-Year | 3,846,382 | 54 | -213,310 | 39 | 458,479 | 79 | -245,169 | 22 |
| 5-Year | 3,741,327 | 34 | -298,687 | 28 | 543,542 | 87 | -244,855 | 14 |
Free Reports:
 Download Our Metatrader 4 Indicators – Put Our Free MetaTrader 4 Custom Indicators on your charts when you join our Weekly Newsletter
 Get our Weekly Commitment of Traders Reports - See where the biggest traders (Hedge Funds and Commercial Hedgers) are positioned in the futures markets on a weekly basis.
3-Month Eurodollars Futures:
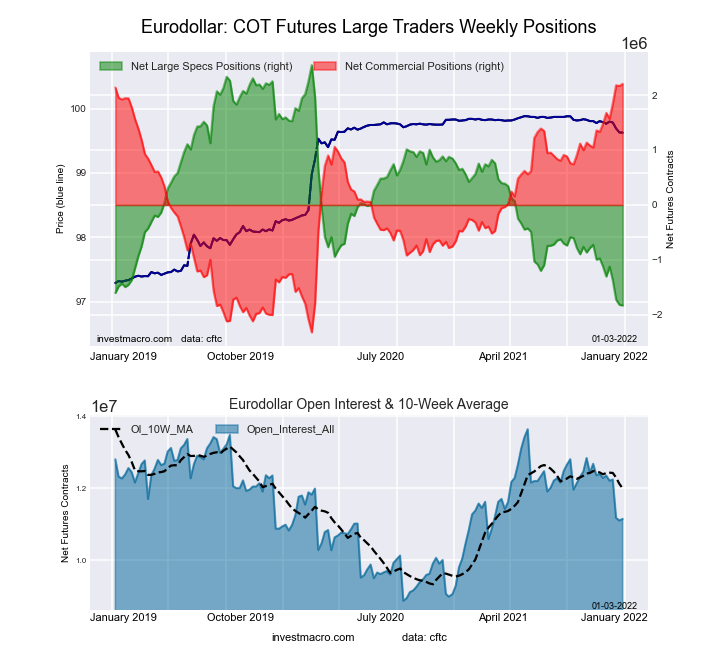 The 3-Month Eurodollars large speculator standing this week recorded a net position of -1,827,848 contracts in the data reported through Tuesday. This was a weekly lowering of -13,028 contracts from the previous week which had a total of -1,814,820 net contracts.
This week’s current strength score (the trader positioning range over the past three years, measured from 0 to 100) shows the speculators are currently Bearish-Extreme with a score of 0.0 percent. The commercials are Bullish-Extreme with a score of 100.0 percent and the small traders (not shown in chart) are Bearish with a score of 31.1 percent.
| 3-Month Eurodollars Statistics | SPECULATORS | COMMERCIALS | SMALL TRADERS |
| – Percent of Open Interest Longs: | 7.7 | 71.9 | 3.9 |
| – Percent of Open Interest Shorts: | 24.1 | 52.1 | 7.3 |
| – Net Position: | -1,827,848 | 2,203,302 | -375,454 |
| – Gross Longs: | 854,963 | 8,015,395 | 436,619 |
| – Gross Shorts: | 2,682,811 | 5,812,093 | 812,073 |
| – Long to Short Ratio: | 0.3 to 1 | 1.4 to 1 | 0.5 to 1 |
| NET POSITION TREND: | |||
| – Strength Index Score (3 Year Range Pct): | 0.0 | 100.0 | 31.1 |
| – Strength Index Reading (3 Year Range): | Bearish-Extreme | Bullish-Extreme | Bearish |
| NET POSITION MOVEMENT INDEX: | |||
| – 6-Week Change in Strength Index: | -16.2 | 16.1 | -3.4 |
30-Day Federal Funds Futures:
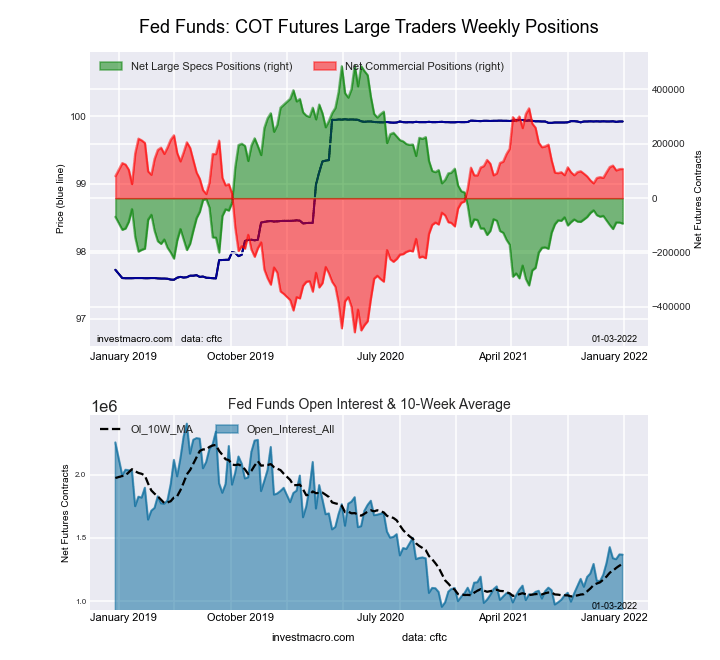 The 30-Day Federal Funds large speculator standing this week recorded a net position of -93,329 contracts in the data reported through Tuesday. This was a weekly decline of -3,900 contracts from the previous week which had a total of -89,429 net contracts.
This week’s current strength score (the trader positioning range over the past three years, measured from 0 to 100) shows the speculators are currently Bearish with a score of 28.1 percent. The commercials are Bullish with a score of 72.9 percent and the small traders (not shown in chart) are Bearish with a score of 26.6 percent.
| 30-Day Federal Funds Statistics | SPECULATORS | COMMERCIALS | SMALL TRADERS |
| – Percent of Open Interest Longs: | 3.0 | 83.0 | 1.7 |
| – Percent of Open Interest Shorts: | 9.8 | 75.2 | 2.8 |
| – Net Position: | -93,329 | 107,478 | -14,149 |
| – Gross Longs: | 41,057 | 1,135,007 | 23,529 |
| – Gross Shorts: | 134,386 | 1,027,529 | 37,678 |
| – Long to Short Ratio: | 0.3 to 1 | 1.1 to 1 | 0.6 to 1 |
| NET POSITION TREND: | |||
| – Strength Index Score (3 Year Range Pct): | 28.1 | 72.9 | 26.6 |
| – Strength Index Reading (3 Year Range): | Bearish | Bullish | Bearish |
| NET POSITION MOVEMENT INDEX: | |||
| – 6-Week Change in Strength Index: | -3.5 | 4.0 | -11.1 |
2-Year Treasury Note Futures:
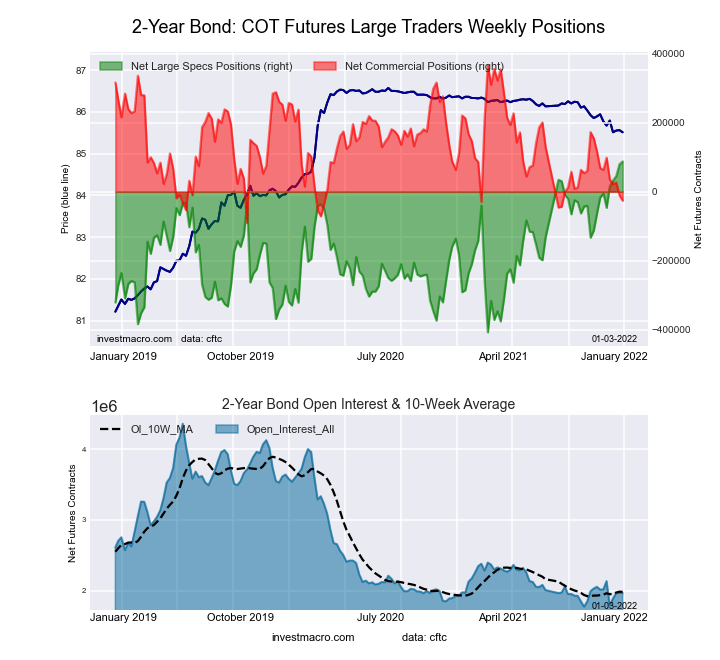 The 2-Year Treasury Note large speculator standing this week recorded a net position of 87,804 contracts in the data reported through Tuesday. This was a weekly rise of 8,471 contracts from the previous week which had a total of 79,333 net contracts.
This week’s current strength score (the trader positioning range over the past three years, measured from 0 to 100) shows the speculators are currently Bullish-Extreme with a score of 100.0 percent. The commercials are Bearish-Extreme with a score of 14.2 percent and the small traders (not shown in chart) are Bearish-Extreme with a score of 5.0 percent.
| 2-Year Treasury Note Statistics | SPECULATORS | COMMERCIALS | SMALL TRADERS |
| – Percent of Open Interest Longs: | 21.5 | 67.0 | 6.3 |
| – Percent of Open Interest Shorts: | 17.1 | 68.3 | 9.4 |
| – Net Position: | 87,804 | -25,765 | -62,039 |
| – Gross Longs: | 423,530 | 1,316,762 | 122,956 |
| – Gross Shorts: | 335,726 | 1,342,527 | 184,995 |
| – Long to Short Ratio: | 1.3 to 1 | 1.0 to 1 | 0.7 to 1 |
| NET POSITION TREND: | |||
| – Strength Index Score (3 Year Range Pct): | 100.0 | 14.2 | 5.0 |
| – Strength Index Reading (3 Year Range): | Bullish-Extreme | Bearish-Extreme | Bearish-Extreme |
| NET POSITION MOVEMENT INDEX: | |||
| – 6-Week Change in Strength Index: | 18.8 | -19.5 | -2.0 |
5-Year Treasury Note Futures:
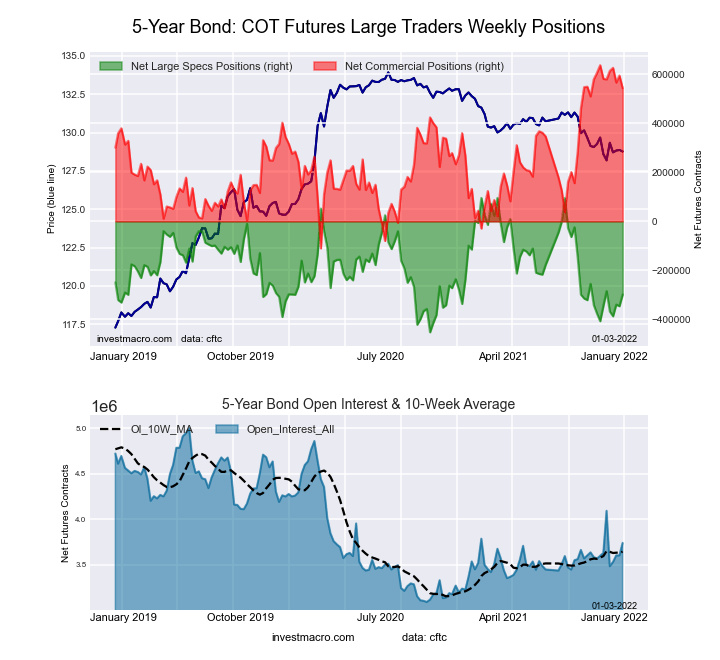 The 5-Year Treasury Note large speculator standing this week recorded a net position of -298,687 contracts in the data reported through Tuesday. This was a weekly boost of 47,689 contracts from the previous week which had a total of -346,376 net contracts.
This week’s current strength score (the trader positioning range over the past three years, measured from 0 to 100) shows the speculators are currently Bearish with a score of 28.1 percent. The commercials are Bullish-Extreme with a score of 87.4 percent and the small traders (not shown in chart) are Bearish-Extreme with a score of 13.8 percent.
| 5-Year Treasury Note Statistics | SPECULATORS | COMMERCIALS | SMALL TRADERS |
| – Percent of Open Interest Longs: | 9.6 | 80.3 | 6.9 |
| – Percent of Open Interest Shorts: | 17.6 | 65.8 | 13.5 |
| – Net Position: | -298,687 | 543,542 | -244,855 |
| – Gross Longs: | 358,105 | 3,006,091 | 259,112 |
| – Gross Shorts: | 656,792 | 2,462,549 | 503,967 |
| – Long to Short Ratio: | 0.5 to 1 | 1.2 to 1 | 0.5 to 1 |
| NET POSITION TREND: | |||
| – Strength Index Score (3 Year Range Pct): | 28.1 | 87.4 | 13.8 |
| – Strength Index Reading (3 Year Range): | Bearish | Bullish-Extreme | Bearish-Extreme |
| NET POSITION MOVEMENT INDEX: | |||
| – 6-Week Change in Strength Index: | 8.4 | -5.1 | -2.0 |
10-Year Treasury Note Futures:
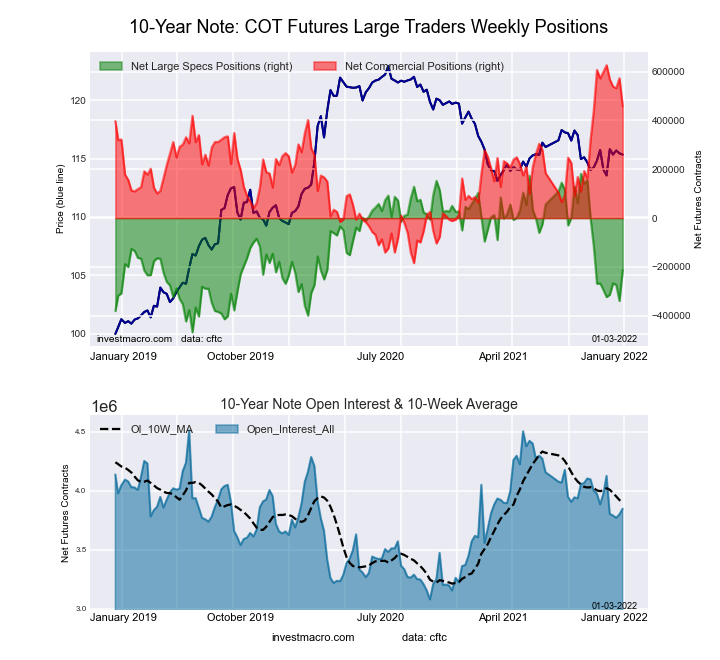 The 10-Year Treasury Note large speculator standing this week recorded a net position of -213,310 contracts in the data reported through Tuesday. This was a weekly boost of 125,989 contracts from the previous week which had a total of -339,299 net contracts.
This week’s current strength score (the trader positioning range over the past three years, measured from 0 to 100) shows the speculators are currently Bearish with a score of 39.2 percent. The commercials are Bullish with a score of 79.3 percent and the small traders (not shown in chart) are Bearish with a score of 21.6 percent.
| 10-Year Treasury Note Statistics | SPECULATORS | COMMERCIALS | SMALL TRADERS |
| – Percent of Open Interest Longs: | 14.2 | 75.8 | 7.6 |
| – Percent of Open Interest Shorts: | 19.7 | 63.8 | 14.0 |
| – Net Position: | -213,310 | 458,479 | -245,169 |
| – Gross Longs: | 545,337 | 2,913,736 | 291,916 |
| – Gross Shorts: | 758,647 | 2,455,257 | 537,085 |
| – Long to Short Ratio: | 0.7 to 1 | 1.2 to 1 | 0.5 to 1 |
| NET POSITION TREND: | |||
| – Strength Index Score (3 Year Range Pct): | 39.2 | 79.3 | 21.6 |
| – Strength Index Reading (3 Year Range): | Bearish | Bullish | Bearish |
| NET POSITION MOVEMENT INDEX: | |||
| – 6-Week Change in Strength Index: | 12.5 | -17.3 | 13.8 |
Ultra 10-Year Notes Futures:
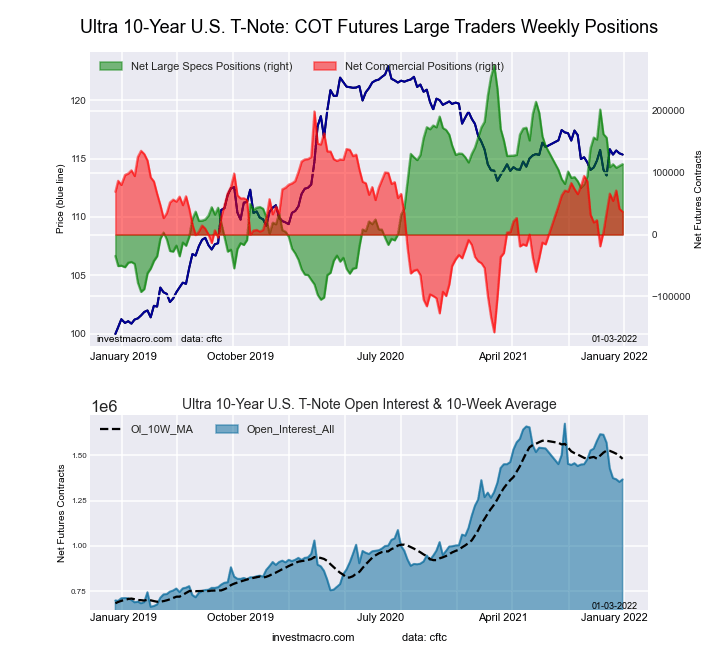 The Ultra 10-Year Notes large speculator standing this week recorded a net position of 113,816 contracts in the data reported through Tuesday. This was a weekly lift of 2,904 contracts from the previous week which had a total of 110,912 net contracts.
This week’s current strength score (the trader positioning range over the past three years, measured from 0 to 100) shows the speculators are currently Bullish with a score of 57.8 percent. The commercials are Bullish with a score of 54.6 percent and the small traders (not shown in chart) are Bearish with a score of 24.8 percent.
| Ultra 10-Year Notes Statistics | SPECULATORS | COMMERCIALS | SMALL TRADERS |
| – Percent of Open Interest Longs: | 20.1 | 70.2 | 8.7 |
| – Percent of Open Interest Shorts: | 11.7 | 67.5 | 19.7 |
| – Net Position: | 113,816 | 36,873 | -150,689 |
| – Gross Longs: | 274,231 | 959,273 | 119,235 |
| – Gross Shorts: | 160,415 | 922,400 | 269,924 |
| – Long to Short Ratio: | 1.7 to 1 | 1.0 to 1 | 0.4 to 1 |
| NET POSITION TREND: | |||
| – Strength Index Score (3 Year Range Pct): | 57.8 | 54.6 | 24.8 |
| – Strength Index Reading (3 Year Range): | Bullish | Bullish | Bearish |
| NET POSITION MOVEMENT INDEX: | |||
| – 6-Week Change in Strength Index: | -12.8 | 9.4 | 9.1 |
US Treasury Bonds Futures:
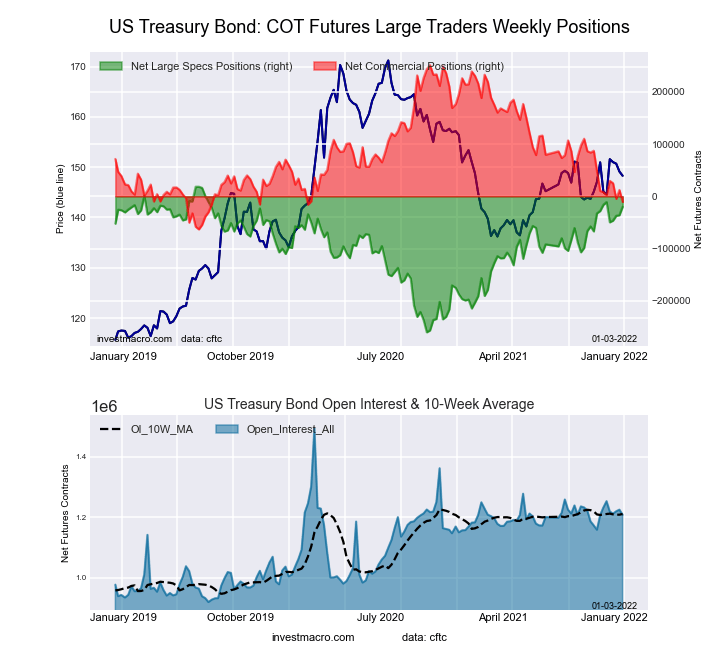 The US Treasury Bonds large speculator standing this week recorded a net position of -19,955 contracts in the data reported through Tuesday. This was a weekly gain of 16,129 contracts from the previous week which had a total of -36,084 net contracts.
This week’s current strength score (the trader positioning range over the past three years, measured from 0 to 100) shows the speculators are currently Bullish-Extreme with a score of 86.3 percent. The commercials are Bearish-Extreme with a score of 16.7 percent and the small traders (not shown in chart) are Bullish with a score of 76.9 percent.
| US Treasury Bonds Statistics | SPECULATORS | COMMERCIALS | SMALL TRADERS |
| – Percent of Open Interest Longs: | 12.9 | 70.4 | 15.3 |
| – Percent of Open Interest Shorts: | 14.5 | 71.3 | 12.8 |
| – Net Position: | -19,955 | -10,654 | 30,609 |
| – Gross Longs: | 155,753 | 850,571 | 185,407 |
| – Gross Shorts: | 175,708 | 861,225 | 154,798 |
| – Long to Short Ratio: | 0.9 to 1 | 1.0 to 1 | 1.2 to 1 |
| NET POSITION TREND: | |||
| – Strength Index Score (3 Year Range Pct): | 86.3 | 16.7 | 76.9 |
| – Strength Index Reading (3 Year Range): | Bullish-Extreme | Bearish-Extreme | Bullish |
| NET POSITION MOVEMENT INDEX: | |||
| – 6-Week Change in Strength Index: | -1.3 | -6.0 | 17.9 |
Ultra US Treasury Bonds Futures:
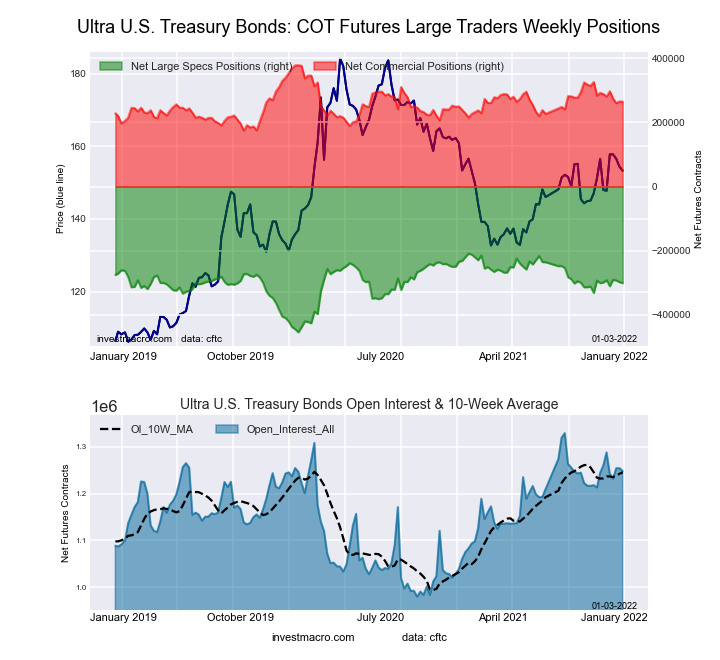 The Ultra US Treasury Bonds large speculator standing this week recorded a net position of -300,717 contracts in the data reported through Tuesday. This was a weekly decrease of -3,156 contracts from the previous week which had a total of -297,561 net contracts.
This week’s current strength score (the trader positioning range over the past three years, measured from 0 to 100) shows the speculators are currently Bullish with a score of 62.5 percent. The commercials are Bearish with a score of 44.3 percent and the small traders (not shown in chart) are Bullish with a score of 54.3 percent.
| Ultra US Treasury Bonds Statistics | SPECULATORS | COMMERCIALS | SMALL TRADERS |
| – Percent of Open Interest Longs: | 6.6 | 80.1 | 12.8 |
| – Percent of Open Interest Shorts: | 30.7 | 58.9 | 9.9 |
| – Net Position: | -300,717 | 264,412 | 36,305 |
| – Gross Longs: | 82,877 | 999,528 | 159,612 |
| – Gross Shorts: | 383,594 | 735,116 | 123,307 |
| – Long to Short Ratio: | 0.2 to 1 | 1.4 to 1 | 1.3 to 1 |
| NET POSITION TREND: | |||
| – Strength Index Score (3 Year Range Pct): | 62.5 | 44.3 | 54.3 |
| – Strength Index Reading (3 Year Range): | Bullish | Bearish | Bullish |
| NET POSITION MOVEMENT INDEX: | |||
| – 6-Week Change in Strength Index: | -0.8 | -11.6 | 18.3 |
Article By InvestMacro – Receive our weekly COT Reports by Email
*COT Report: The COT data, released weekly to the public each Friday, is updated through the most recent Tuesday (data is 3 days old) and shows a quick view of how large speculators or non-commercials (for-profit traders) were positioned in the futures markets.
The CFTC categorizes trader positions according to commercial hedgers (traders who use futures contracts for hedging as part of the business), non-commercials (large traders who speculate to realize trading profits) and nonreportable traders (usually small traders/speculators) as well as their open interest (contracts open in the market at time of reporting).See CFTC criteria here.

- The US introduces new import tariffs for 60 countries. Brent crude surpasses $100 per barrel Jul 24, 2026
- USD/JPY Breaks Records: Nothing Slows the Yen’s Decline Jul 24, 2026
- Oil prices reached a 6‑week high. The AUD strengthened on the back of a strong labor‑market report Jul 23, 2026
- EUR/USD Recovers as Dollar Weakens Jul 23, 2026
- Bitcoin rose to $66,000. The New Zealand dollar continues to strengthen Jul 22, 2026
- Inflationary pressure is easing in Canada. In New Zealand, on the contrary, inflation is rising Jul 21, 2026
- GBP/USD Falls After Cabinet Changes Jul 21, 2026
- Geopolitical and macroeconomic conditions continue to pressure market sentiment Jul 20, 2026
- USD/JPY Poised to Continue Gains as Expensive Oil and Lack of Support Weigh on Yen Jul 20, 2026
- COT Metals Charts: Weekly Speculator Bets led by Copper & Steel Jul 18, 2026