
By InvestMacro | COT | Data Tables | COT Leaders | Downloads | COT Newsletter
Here are the latest charts and statistics for the Commitment of Traders (COT) data published by the Commodities Futures Trading Commission (CFTC). The latest release was delayed by the CFTC due to the Christmas holiday.
The latest COT data is updated through Tuesday December 21st 2021 and shows a quick view of how large traders (for-profit speculators and commercial entities) were positioned in the futures markets.
Highlighting the COT metals data is the continued decline in the Copper futures bets. The speculative net position in the Copper futures has now decreased for nine consecutive weeks and by a total of -36,147 contracts over that time-frame. This weakness has brought the current standing for Copper net positions to the least bullish level since June 2nd of 2020, a span of eighty-one weeks. Speculators had been raising their positions for Copper starting in June 2020 with positioning reaching a multi-year high of +80,039 contracts on December 8th of 2020. The overall position has remained in bullish territory throughout 2021 but has dropped to an overall level of just +4,437 contracts last week.
Joining Copper (-2,260 contracts) in declining on the week were Silver (-1,058 contracts), Platinum (-2,463 contracts) while Gold (3,410 contracts) and Palladium (135 contracts) had higher weekly speculative positions.
| Dec-21-2021 | OI | OI-Index | Spec-Net | Spec-Index | Com-Net | COM-Index | Smalls-Net | Smalls-Index |
|---|---|---|---|---|---|---|---|---|
| WTI Crude | 1,892,701 | 0 | 340,255 | 20 | -375,816 | 70 | 35,561 | 65 |
| Gold | 500,846 | 19 | 205,811 | 53 | -236,029 | 46 | 30,218 | 50 |
| Silver | 141,119 | 8 | 20,926 | 43 | -36,399 | 63 | 15,473 | 30 |
| Copper | 170,353 | 5 | 4,437 | 46 | -9,777 | 53 | 5,340 | 56 |
| Palladium | 9,518 | 14 | -3,639 | 1 | 3,985 | 99 | -346 | 24 |
| Platinum | 64,732 | 30 | 1,268 | 4 | -7,717 | 98 | 6,449 | 52 |
| Natural Gas | 1,142,729 | 4 | -141,212 | 36 | 109,551 | 65 | 31,661 | 59 |
| Brent | 224,110 | 58 | -25,001 | 76 | 22,225 | 26 | 2,776 | 47 |
| Heating Oil | 302,721 | 3 | 4,897 | 50 | -21,060 | 49 | 16,163 | 54 |
| Soybeans | 654,460 | 11 | 102,877 | 56 | -72,352 | 49 | -30,525 | 21 |
| Corn | 1,485,412 | 19 | 445,320 | 87 | -401,280 | 15 | -44,040 | 18 |
| Coffee | 258,871 | 28 | 56,134 | 89 | -57,984 | 14 | 1,850 | 1 |
| Sugar | 864,082 | 9 | 189,198 | 75 | -210,783 | 28 | 21,585 | 35 |
| Wheat | 357,381 | 11 | 9,132 | 55 | -1,601 | 39 | -7,531 | 66 |
Free Reports:
 Get our Weekly Commitment of Traders Reports - See where the biggest traders (Hedge Funds and Commercial Hedgers) are positioned in the futures markets on a weekly basis.
 Sign Up for Our Stock Market Newsletter – Get updated on News, Charts & Rankings of Public Companies when you join our Stocks Newsletter
Gold Comex Futures:
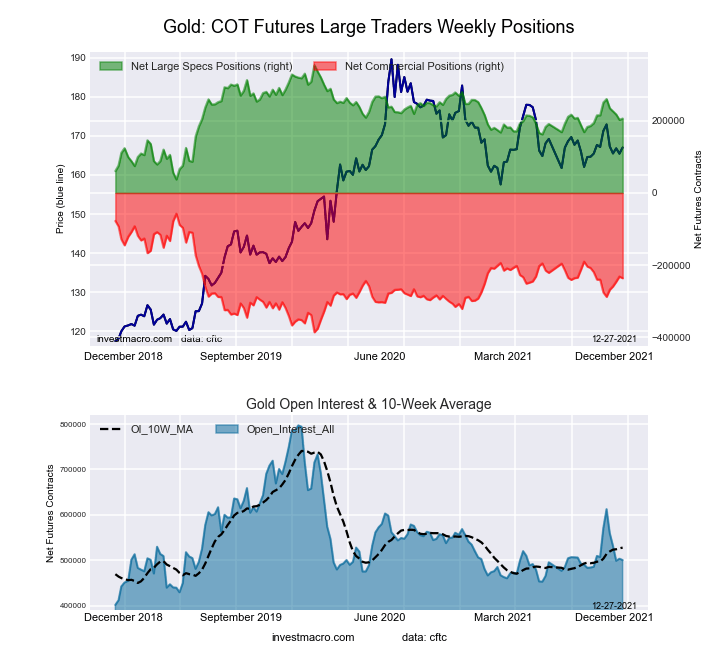 The Gold Comex Futures large speculator standing this week equaled a net position of 205,811 contracts in the data reported through Tuesday. This was a weekly boost of 3,410 contracts from the previous week which had a total of 202,401 net contracts.
This week’s current strength score (the trader positioning range over the past three years, measured from 0 to 100) shows the speculators are currently Bullish with a score of 53.3 percent. The commercials are Bearish with a score of 45.6 percent and the small traders (not shown in chart) are Bearish with a score of 49.9 percent.
| Gold Futures Statistics | SPECULATORS | COMMERCIALS | SMALL TRADERS |
| – Percent of Open Interest Longs: | 59.2 | 21.0 | 9.8 |
| – Percent of Open Interest Shorts: | 18.1 | 68.1 | 3.8 |
| – Net Position: | 205,811 | -236,029 | 30,218 |
| – Gross Longs: | 296,628 | 104,997 | 49,251 |
| – Gross Shorts: | 90,817 | 341,026 | 19,033 |
| – Long to Short Ratio: | 3.3 to 1 | 0.3 to 1 | 2.6 to 1 |
| NET POSITION TREND: | |||
| – Strength Index Score (3 Year Range Pct): | 53.3 | 45.6 | 49.9 |
| – Strength Index Reading (3 Year Range): | Bullish | Bearish | Bearish |
| NET POSITION MOVEMENT INDEX: | |||
| – 6-Week Change in Strength Index: | -14.0 | 12.0 | 14.0 |
Silver Comex Futures:
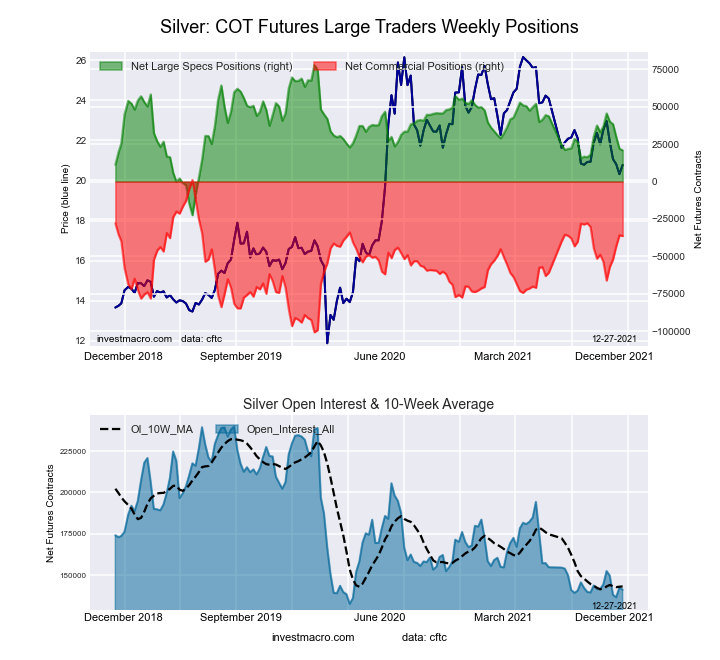 The Silver Comex Futures large speculator standing this week equaled a net position of 20,926 contracts in the data reported through Tuesday. This was a weekly fall of -1,058 contracts from the previous week which had a total of 21,984 net contracts.
This week’s current strength score (the trader positioning range over the past three years, measured from 0 to 100) shows the speculators are currently Bearish with a score of 43.2 percent. The commercials are Bullish with a score of 63.2 percent and the small traders (not shown in chart) are Bearish with a score of 30.5 percent.
| Silver Futures Statistics | SPECULATORS | COMMERCIALS | SMALL TRADERS |
| – Percent of Open Interest Longs: | 44.0 | 30.3 | 19.3 |
| – Percent of Open Interest Shorts: | 29.2 | 56.1 | 8.3 |
| – Net Position: | 20,926 | -36,399 | 15,473 |
| – Gross Longs: | 62,070 | 42,742 | 27,251 |
| – Gross Shorts: | 41,144 | 79,141 | 11,778 |
| – Long to Short Ratio: | 1.5 to 1 | 0.5 to 1 | 2.3 to 1 |
| NET POSITION TREND: | |||
| – Strength Index Score (3 Year Range Pct): | 43.2 | 63.2 | 30.5 |
| – Strength Index Reading (3 Year Range): | Bearish | Bullish | Bearish |
| NET POSITION MOVEMENT INDEX: | |||
| – 6-Week Change in Strength Index: | -15.9 | 16.9 | -7.7 |
Copper Grade #1 Futures:
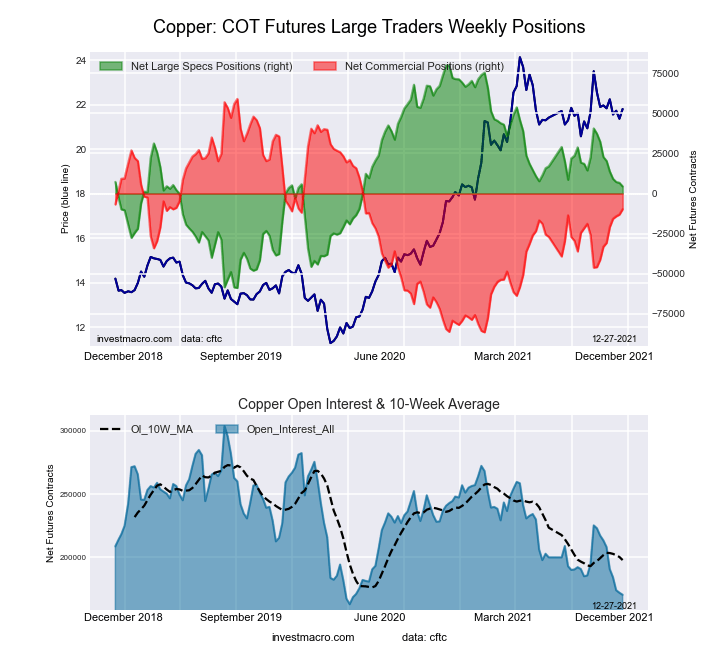 The Copper Grade #1 Futures large speculator standing this week equaled a net position of 4,437 contracts in the data reported through Tuesday. This was a weekly lowering of -2,260 contracts from the previous week which had a total of 6,697 net contracts.
This week’s current strength score (the trader positioning range over the past three years, measured from 0 to 100) shows the speculators are currently Bearish with a score of 45.6 percent. The commercials are Bullish with a score of 52.7 percent and the small traders (not shown in chart) are Bullish with a score of 56.2 percent.
| Copper Futures Statistics | SPECULATORS | COMMERCIALS | SMALL TRADERS |
| – Percent of Open Interest Longs: | 35.8 | 45.7 | 9.7 |
| – Percent of Open Interest Shorts: | 33.2 | 51.4 | 6.5 |
| – Net Position: | 4,437 | -9,777 | 5,340 |
| – Gross Longs: | 60,983 | 77,851 | 16,453 |
| – Gross Shorts: | 56,546 | 87,628 | 11,113 |
| – Long to Short Ratio: | 1.1 to 1 | 0.9 to 1 | 1.5 to 1 |
| NET POSITION TREND: | |||
| – Strength Index Score (3 Year Range Pct): | 45.6 | 52.7 | 56.2 |
| – Strength Index Reading (3 Year Range): | Bearish | Bullish | Bullish |
| NET POSITION MOVEMENT INDEX: | |||
| – 6-Week Change in Strength Index: | -13.2 | 16.1 | -29.3 |
Platinum Futures:
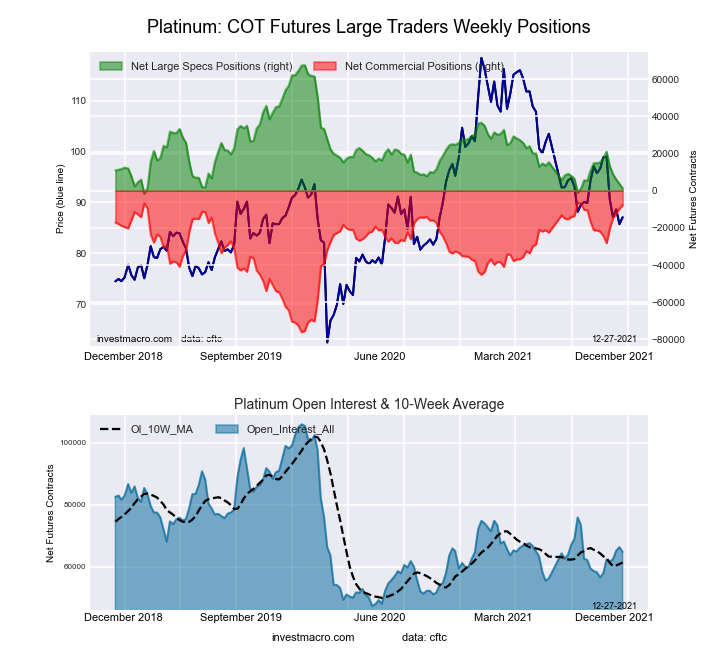 The Platinum Futures large speculator standing this week equaled a net position of 1,268 contracts in the data reported through Tuesday. This was a weekly reduction of -2,463 contracts from the previous week which had a total of 3,731 net contracts.
This week’s current strength score (the trader positioning range over the past three years, measured from 0 to 100) shows the speculators are currently Bearish-Extreme with a score of 4.2 percent. The commercials are Bullish-Extreme with a score of 98.0 percent and the small traders (not shown in chart) are Bullish with a score of 52.0 percent.
| Platinum Futures Statistics | SPECULATORS | COMMERCIALS | SMALL TRADERS |
| – Percent of Open Interest Longs: | 43.7 | 37.7 | 15.3 |
| – Percent of Open Interest Shorts: | 41.8 | 49.6 | 5.3 |
| – Net Position: | 1,268 | -7,717 | 6,449 |
| – Gross Longs: | 28,302 | 24,417 | 9,899 |
| – Gross Shorts: | 27,034 | 32,134 | 3,450 |
| – Long to Short Ratio: | 1.0 to 1 | 0.8 to 1 | 2.9 to 1 |
| NET POSITION TREND: | |||
| – Strength Index Score (3 Year Range Pct): | 4.2 | 98.0 | 52.0 |
| – Strength Index Reading (3 Year Range): | Bearish-Extreme | Bullish-Extreme | Bullish |
| NET POSITION MOVEMENT INDEX: | |||
| – 6-Week Change in Strength Index: | -23.6 | 23.7 | -2.6 |
Palladium Futures:
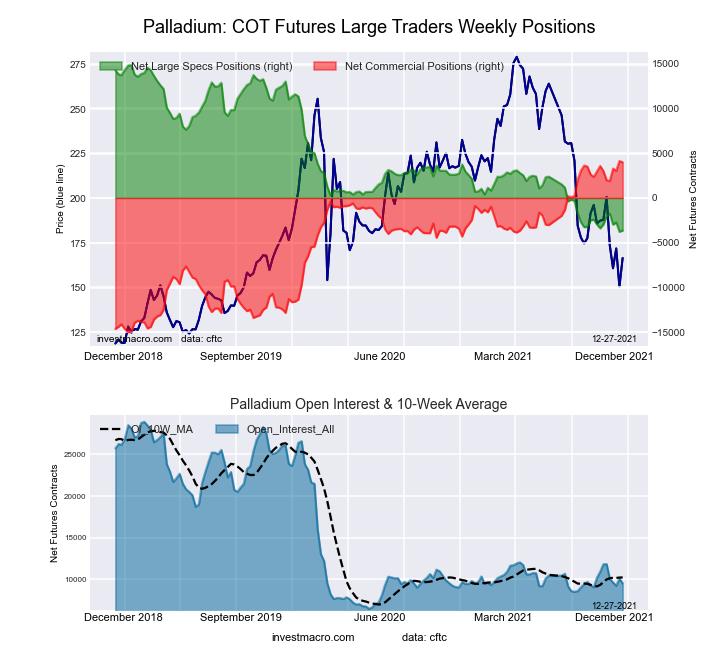 The Palladium Futures large speculator standing this week equaled a net position of -3,639 contracts in the data reported through Tuesday. This was a weekly boost of 135 contracts from the previous week which had a total of -3,774 net contracts.
This week’s current strength score (the trader positioning range over the past three years, measured from 0 to 100) shows the speculators are currently Bearish-Extreme with a score of 0.7 percent. The commercials are Bullish-Extreme with a score of 99.3 percent and the small traders (not shown in chart) are Bearish with a score of 24.3 percent.
| Palladium Futures Statistics | SPECULATORS | COMMERCIALS | SMALL TRADERS |
| – Percent of Open Interest Longs: | 26.0 | 60.3 | 12.3 |
| – Percent of Open Interest Shorts: | 64.2 | 18.5 | 16.0 |
| – Net Position: | -3,639 | 3,985 | -346 |
| – Gross Longs: | 2,475 | 5,743 | 1,174 |
| – Gross Shorts: | 6,114 | 1,758 | 1,520 |
| – Long to Short Ratio: | 0.4 to 1 | 3.3 to 1 | 0.8 to 1 |
| NET POSITION TREND: | |||
| – Strength Index Score (3 Year Range Pct): | 0.7 | 99.3 | 24.3 |
| – Strength Index Reading (3 Year Range): | Bearish-Extreme | Bullish-Extreme | Bearish |
| NET POSITION MOVEMENT INDEX: | |||
| – 6-Week Change in Strength Index: | -3.7 | 5.1 | -17.5 |
Article By InvestMacro – Receive our weekly COT Reports by Email
*COT Report: The COT data, released weekly to the public each Friday, is updated through the most recent Tuesday (data is 3 days old) and shows a quick view of how large speculators or non-commercials (for-profit traders) were positioned in the futures markets.
The CFTC categorizes trader positions according to commercial hedgers (traders who use futures contracts for hedging as part of the business), non-commercials (large traders who speculate to realize trading profits) and nonreportable traders (usually small traders/speculators) as well as their open interest (contracts open in the market at time of reporting).See CFTC criteria here.

- The US introduces new import tariffs for 60 countries. Brent crude surpasses $100 per barrel Jul 24, 2026
- USD/JPY Breaks Records: Nothing Slows the Yen’s Decline Jul 24, 2026
- Oil prices reached a 6‑week high. The AUD strengthened on the back of a strong labor‑market report Jul 23, 2026
- EUR/USD Recovers as Dollar Weakens Jul 23, 2026
- Bitcoin rose to $66,000. The New Zealand dollar continues to strengthen Jul 22, 2026
- Inflationary pressure is easing in Canada. In New Zealand, on the contrary, inflation is rising Jul 21, 2026
- GBP/USD Falls After Cabinet Changes Jul 21, 2026
- Geopolitical and macroeconomic conditions continue to pressure market sentiment Jul 20, 2026
- USD/JPY Poised to Continue Gains as Expensive Oil and Lack of Support Weigh on Yen Jul 20, 2026
- COT Metals Charts: Weekly Speculator Bets led by Copper & Steel Jul 18, 2026