By JustMarkets
The US stock indices plunged to multi‑week lows. By the end of the day, the Dow Jones (US30) fell by 1.87%, the S&P 500 (US500) declined 1.62%, and the tech‑heavy Nasdaq (US100) closed 1.98% lower. The main trigger for the panic sell‑off was a sharp escalation in geopolitical tensions around Iran after President Donald Trump threatened Tehran with a harsh military response for dragging out negotiations. This instantly brought fears of prolonged escalation back to the markets and sparked another jump in oil prices.
The technology sector took an additional hit as investors aggressively locked in profits in semiconductor and AI‑giant stocks amid concerns of overheated valuations. Sentiment was further pressured by growing caution ahead of the historic SpaceX IPO scheduled for this Friday (June 12), with funds actively freeing up liquidity for the mega‑listing valued at $1.77 trillion. As a result, sector leaders closed deep in the red: Broadcom plunged 5.1%, AMD 4.9%, Micron Technology 4.7%, and market favorite Nvidia lost 3.7%. Tesla shares dropped 3.8%, and the wave of selling spread into the heavy industrial sector as well.
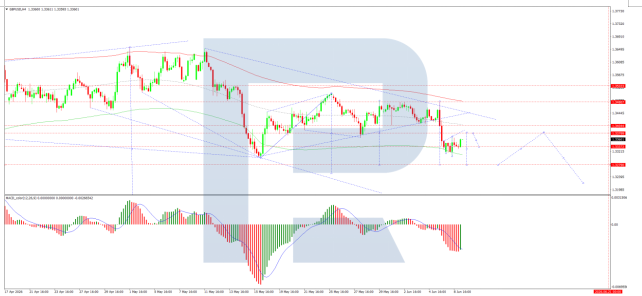
On Wednesday, the Canadian dollar (CAD) posted a moderate gain against its US counterpart, stabilizing near 1.39 per USD. The symbolic strengthening of the loonie was driven by the Bank of Canada (BoC), which, as expected, kept its key interest rate unchanged at 2.25% for the fifth consecutive meeting. Governor Tiff Macklem noted that economic uncertainty remains extremely high due to the ongoing Middle East conflict and the threat of new US tariffs as part of the CUSMA review. Despite the BoC’s hawkish tone and rising market bets on a potential 25‑bp rate hike in December, the Canadian dollar still failed to meaningfully distance itself from its six‑month lows.
European indices mostly declined yesterday. By the close, Germany’s DAX (DE40) fell by 0.97%, France’s CAC 40 (FR40) ended 0.51% lower, Spain’s IBEX 35 (ES35) slipped 0.18%, while the UK’s FTSE 100 (UK100) finished the session 0.27% higher. The main drag was the renewed wave of geopolitical tension in the Middle East following US military strikes on targets in Iran. In addition, market participants adopted a wait‑and‑see stance ahead of Thursday’s key ECB meeting, where the regulator is expected to raise rates by 25 basis points.
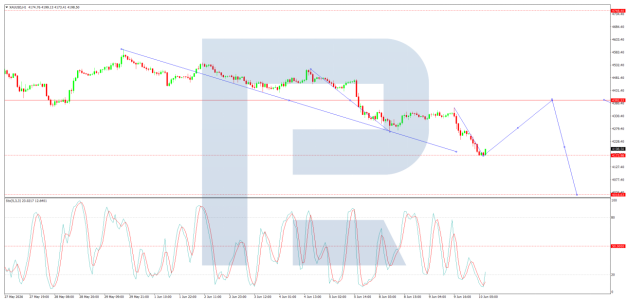
Global crude oil prices resumed strong growth, adding more than 2%. Brent prices surged toward $92 per barrel, while US WTI rose to $88-89. President Donald Trump issued a harsh warning to Tehran on social media, stating that Iran had delayed peace talks for too long and would now “have to pay for it.” The statement followed attacks by pro‑Iranian forces on infrastructure in Bahrain, Jordan, and Kuwait – retaliation for recent US “self‑defense strikes” after the destruction of an American helicopter. Additional support for oil came from fresh EIA data showing US commercial crude inventories plunged by 7.228 million barrels last week – the seventh consecutive weekly decline and nearly double analysts’ expectations.
The US natural gas prices (Henry Hub) posted moderate gains, stabilizing around $3.19-3.20 per MMBtu. Futures were supported by updated weather expectations predicting a return of abnormally hot temperatures above seasonal norms in the second half of June, which will inevitably boost electricity demand and strain cooling systems. However, prices still remain well below the local highs reached earlier this month.
On Friday, Japan’s Nikkei 225 (JP225) fell by 1.89%, China’s FTSE China A50 closed 0.61% lower, Hong Kong’s Hang Seng (HK50) declined 0.64%, while Australia’s ASX 200 (AU200) rose 0.57%.
In Australia, consumer inflation expectations calculated by the Melbourne Institute held at 5.6%, unchanged from the previous month and remaining near three‑year highs. The current stabilization comes against the backdrop of the Reserve Bank of Australia’s (RBA) tight monetary stance: three rate hikes since the start of the year have pushed borrowing costs to 4.35%, gradually cooling domestic demand and preventing secondary effects from energy‑market shocks.
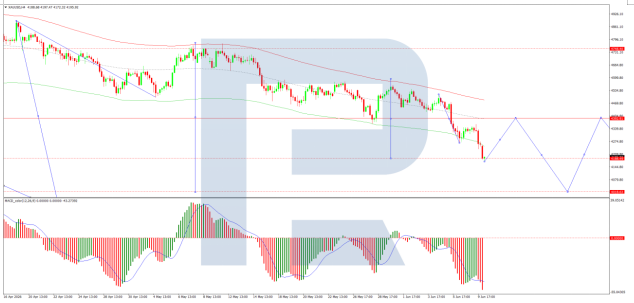
S&P 500 (US500) 7,266.99 -119.66 (-1.62%)
Dow Jones (US30) 49,918.78 -953.33 (-1.87%)
DAX (DE40) 24,195.31 -237.75 (-0.97%)
FTSE 100 (UK100) 10,254.81 +27.48 (+0.27%)
USD Index 100.02 +0.11 (+0.11%)
News feed for: 2026.06.11
- Sweden Inflation Rate (m/m) at 09:00 (GMT+3) – SEK (MED)
- Eurozone ECB Interest Rate Decision at 15:15 (GMT+3) – EUR (HIGH)
- US Initial Jobless Claims (w/w) at 15:30 (GMT+3) – USD (MED)
- US Producer Price Index (m/m) at 15:30 (GMT+3) – USD (MED)
- Eurozone ECB Press Conference at 15:45 (GMT+3) – EUR (HIGH)
- US Natural Gas Storage (w/w) at 17:30 (GMT+3) – XNG (HIGH)
By JustMarkets
This article reflects a personal opinion and should not be interpreted as an investment advice, and/or offer, and/or a persistent request for carrying out financial transactions, and/or a guarantee, and/or a forecast of future events.