By InvestMacro
Here are the latest charts and statistics for the Commitment of Traders (COT) reports data published by the Commodities Futures Trading Commission (CFTC).
The latest COT data is updated through Tuesday May 26th and shows a quick view of how large traders (for-profit speculators and commercial hedgers) were positioned in the futures markets.
Weekly Speculator Changes led by 2-Year & 10-Year Bonds
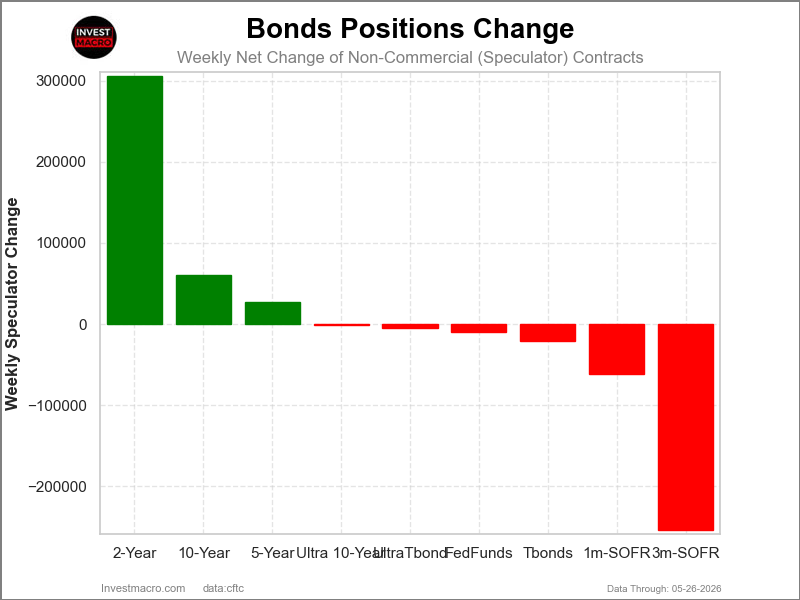
The COT bond market speculator bets were overall lower this week as three out of the nine bond markets we cover had higher positioning while the other six markets had lower speculator contracts.
Leading the gains for the bond markets was the 2-Year Bonds (305,591 contracts) with the 10-Year Bonds (60,098 contracts) and the 5-Year Bonds (27,389 contracts) also showing positive weeks.
The bond markets with declines in speculator bets for the week were the SOFR 3-Months (-253,525 contracts), the SOFR 1-Month (-60,859 contracts), the US Treasury Bonds (-20,577 contracts), the Fed Funds (-9,975 contracts), the Ultra Treasury Bonds (-5,378 contracts) and the Ultra 10-Year Bonds (-576 contracts) also registering lower bets on the week.
The 5-Year Bond leads the US Bond market price performances.
In the major US Bond markets price changes this week, the 5-Year Bond was the highest gainer with a modest 0.32% increase. The 10-Year Note follows that up with a 0.17% increase over the past five days, while the Fed Funds was up by a minuscule 0.01%, just like the 2-Year Bond, which was higher by 0.01% as well.
The Long US Treasury Bond was virtually unchanged on the week, while the 3-Month SOFR edged lower by -0.01%. And to close it out, the 1-Month SOFR dipped by -0.02%.
Bonds Data:
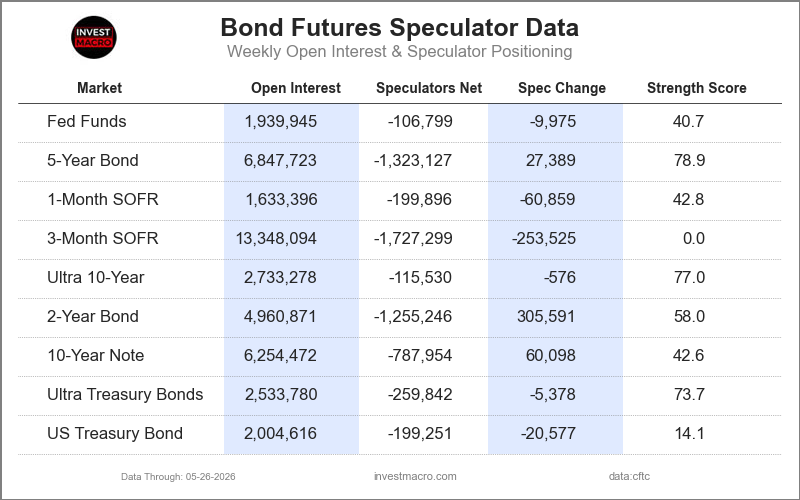
Legend: Open Interest | Speculators Current Net Position | Weekly Specs Change | Specs Strength Score compared to last 3-Years (0-100 range)
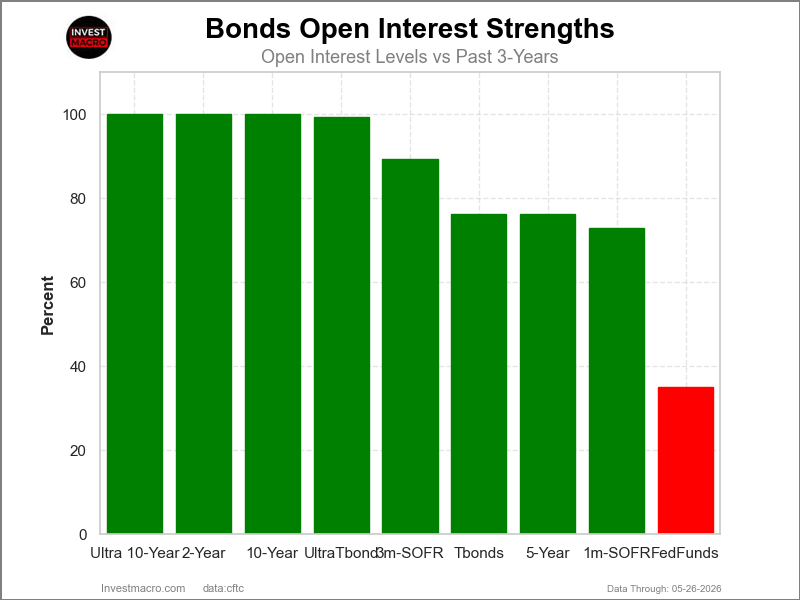
Strength Scores led by 5-Year Bonds & Ultra 10-Year Bonds
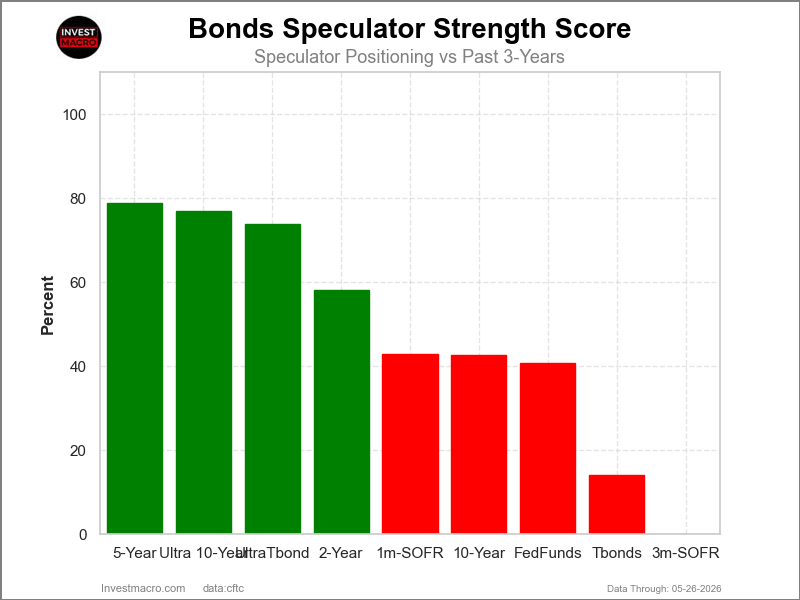
COT Strength Scores (a normalized measure of Speculator positions over a 3-Year range, from 0 to 100 where above 80 is Extreme-Bullish and below 20 is Extreme-Bearish) showed that the 5-Year Bonds (79 percent) and the Ultra 10-Year Bonds (77 percent) lead the bond markets this week. The Ultra Treasury Bonds (74 percent) comes in as the next highest in the weekly strength scores.
On the downside, the US Treasury Bonds (14 percent) and the SOFR 3-Months (0 percent) come in at the lowest strength level currently and are in Extreme-Bearish territory (below 20 percent).
Strength Statistics:
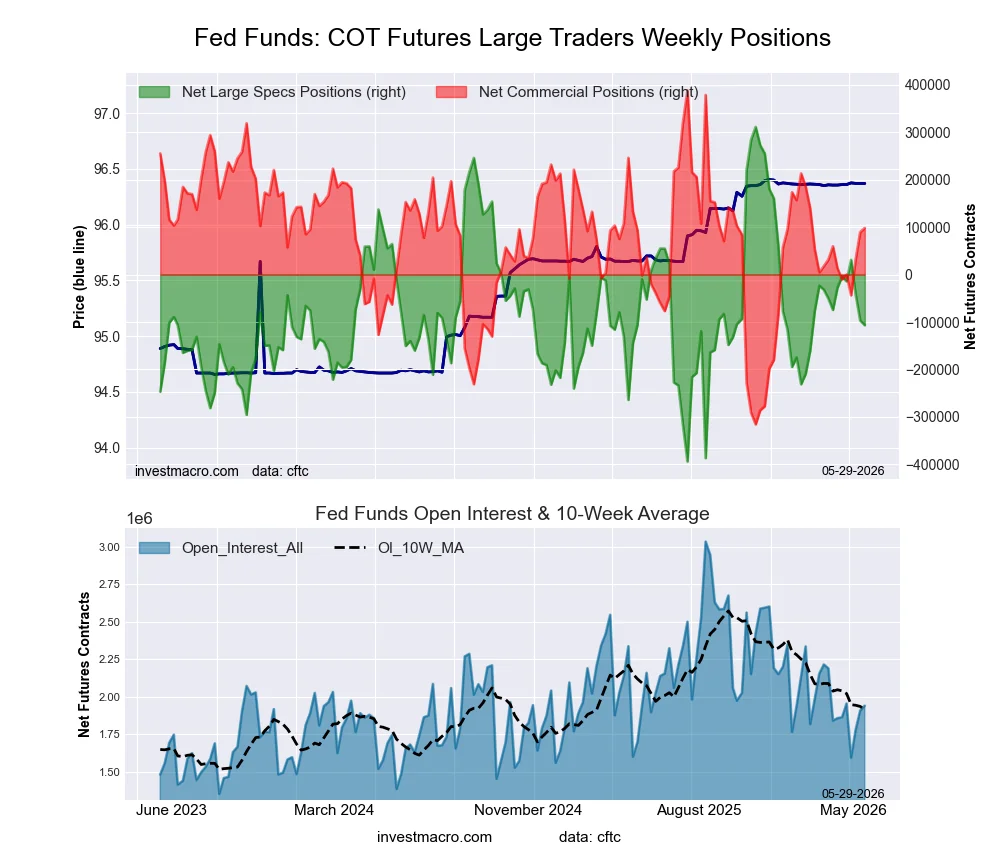
Fed Funds (40.7 percent) vs Fed Funds previous week (42.1 percent)
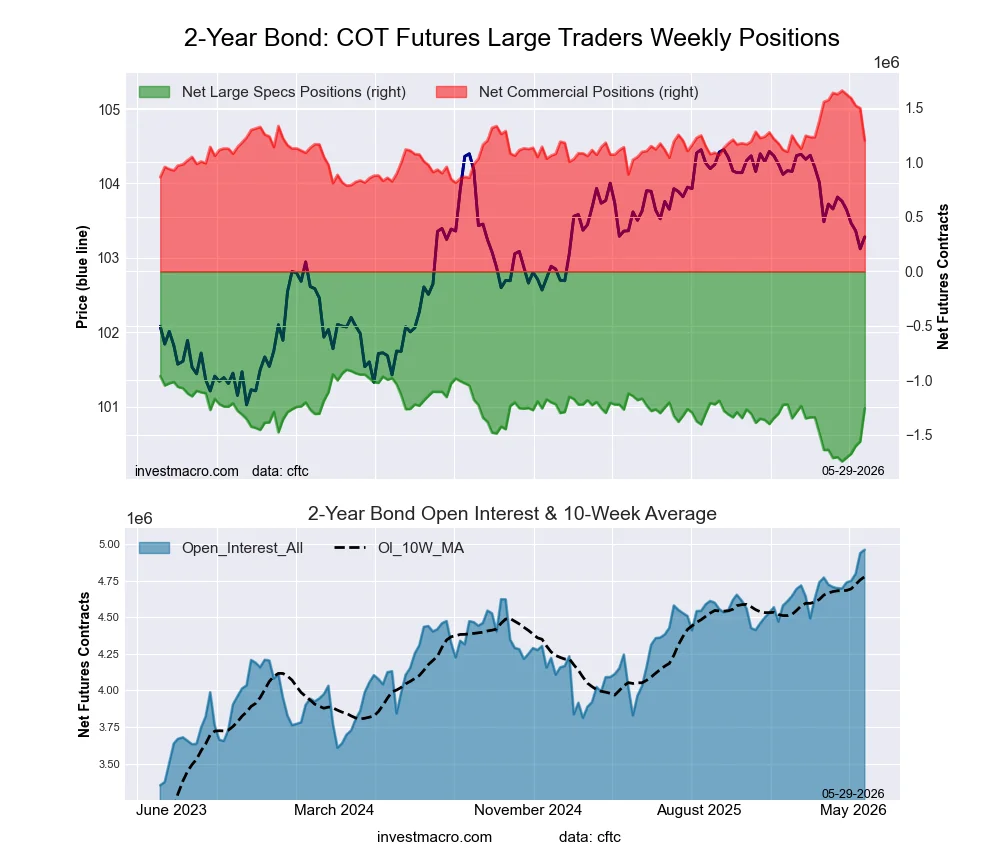
2-Year Bond (58.0 percent) vs 2-Year Bond previous week (21.7 percent)
5-Year Bond (78.9 percent) vs 5-Year Bond previous week (77.3 percent)
10-Year Bond (42.6 percent) vs 10-Year Bond previous week (35.4 percent)
Ultra 10-Year Bond (77.0 percent) vs Ultra 10-Year Bond previous week (77.1 percent)
US Treasury Bond (14.1 percent) vs US Treasury Bond previous week (21.2 percent)
Ultra US Treasury Bond (73.7 percent) vs Ultra US Treasury Bond previous week (75.7 percent)
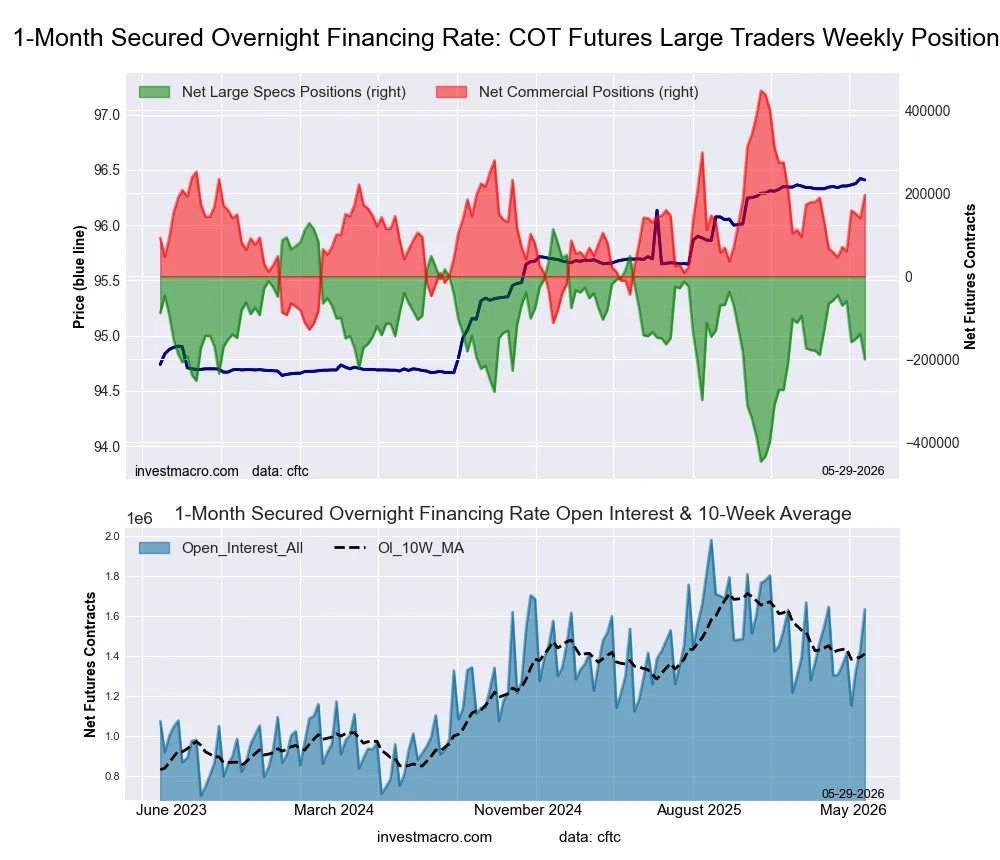
SOFR 1-Month (42.8 percent) vs SOFR 1-Month previous week (53.5 percent)
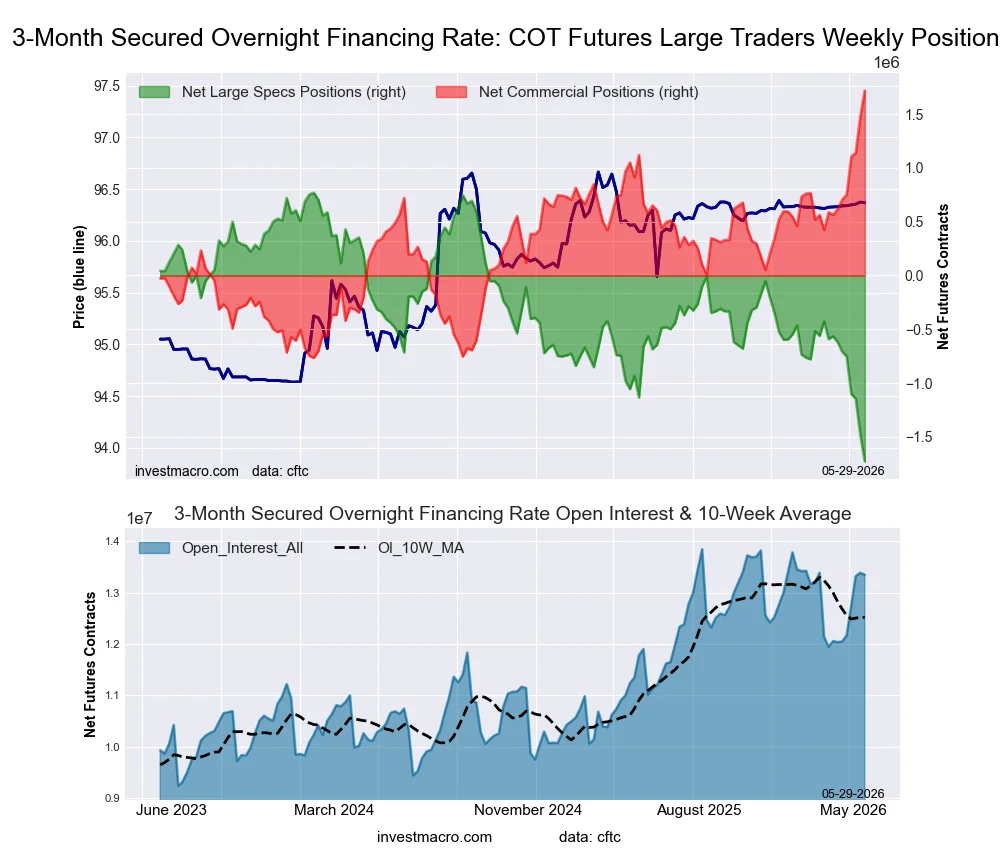
SOFR 3-Months (0.0 percent) vs SOFR 3-Months previous week (10.2 percent)
2-Year Bonds & 5-Year Bonds top the 6-Week Strength Trends
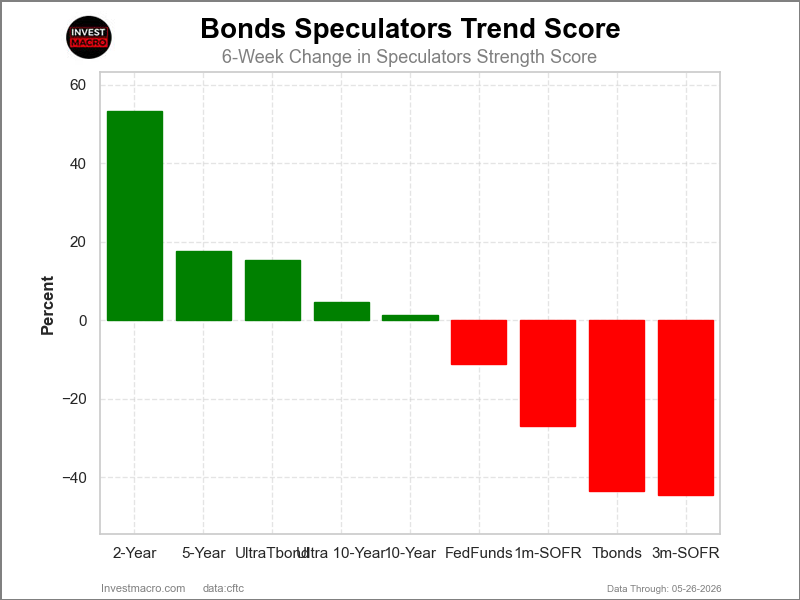
COT Strength Score Trends (or move index, calculates the 6-week changes in strength scores) showed that the 2-Year Bonds (53 percent) and the 5-Year Bonds (18 percent) lead the past six weeks trends for bonds. The Ultra Treasury Bonds (15 percent) are the next highest positive movers in the latest trends data.
The SOFR 3-Months (-44 percent) and the US Treasury Bonds (-44 percent) lead the downside trend scores currently with the SOFR 1-Month (-27 percent) following next with lower trend scores.
Strength Trend Statistics:
Fed Funds (-11.2 percent) vs Fed Funds previous week (-3.2 percent)
2-Year Bond (53.3 percent) vs 2-Year Bond previous week (18.0 percent)
5-Year Bond (17.6 percent) vs 5-Year Bond previous week (11.7 percent)
10-Year Bond (1.5 percent) vs 10-Year Bond previous week (-2.9 percent)
Ultra 10-Year Bond (4.6 percent) vs Ultra 10-Year Bond previous week (12.2 percent)
US Treasury Bond (-43.5 percent) vs US Treasury Bond previous week (-41.6 percent)
Ultra US Treasury Bond (15.4 percent) vs Ultra US Treasury Bond previous week (2.2 percent)
SOFR 1-Month (-26.9 percent) vs SOFR 1-Month previous week (-14.2 percent)
SOFR 3-Months (-44.4 percent) vs SOFR 3-Months previous week (-36.4 percent)
30-Day Federal Funds Futures:
 Positioning Notes:
- 30-Day Federal Funds large speculator standing this week totaled a net position of -106,799 contracts in the data reported through Tuesday.
- Weekly Speculator position reduction of -9,975 contracts from the previous week which had a total of -96,824 net contracts.
- This week’s current strength score (range over the past 3 years, measured from 0 to 100) shows the speculators are currently Bearish with a score of 40.7 percent.
- The Commercials are Bullish with a score of 58.8 percent.
- The Small Traders (not shown in chart) are Bullish with a score of 63.5 percent.
Price Trend-Following Model: Weak Uptrend
Our weekly trend-following model classifies the current market price position as: Weak Uptrend.
| 30-Day Federal Funds Statistics | SPECULATORS | COMMERCIALS | SMALL TRADERS |
| – Percent of Open Interest Longs: | 9.4 | 67.6 | 2.1 |
| – Percent of Open Interest Shorts: | 14.9 | 62.5 | 1.7 |
| – Net Position: | -106,799 | 98,056 | 8,743 |
| – Gross Longs: | 182,828 | 1,310,707 | 41,193 |
| – Gross Shorts: | 289,627 | 1,212,651 | 32,450 |
| – Long to Short Ratio: | 0.6 to 1 | 1.1 to 1 | 1.3 to 1 |
| NET POSITION TREND: | | | |
| – Strength Index Score (3 Year Range Pct): | 40.7 | 58.8 | 63.5 |
| – Strength Index Reading (3 Year Range): | Bearish | Bullish | Bullish |
| NET POSITION MOVEMENT INDEX: | | | |
| – 6-Week Change in Strength Index: | -11.2 | 12.1 | -10.8 |
Secured Overnight Financing Rate (3-Month) Futures:
 Positioning Notes:
- Secured Overnight Financing Rate (3-Month) large speculator standing this week totaled a net position of -1,727,299 contracts in the data reported through Tuesday.
- Weekly Speculator position decrease of -253,525 contracts from the previous week which had a total of -1,473,774 net contracts.
- This week’s current strength score (range over the past 3 years, measured from 0 to 100) shows the speculators are currently Bearish-Extreme with a score of 0.0 percent.
- The Commercials are Bullish-Extreme with a score of 100.0 percent.
- The Small Traders (not shown in chart) are Bullish with a score of 52.8 percent.
Price Trend-Following Model: Weak Uptrend
Our weekly trend-following model classifies the current market price position as: Weak Uptrend.
| SOFR 3-Months Statistics | SPECULATORS | COMMERCIALS | SMALL TRADERS |
| – Percent of Open Interest Longs: | 12.2 | 64.5 | 0.4 |
| – Percent of Open Interest Shorts: | 25.1 | 51.6 | 0.3 |
| – Net Position: | -1,727,299 | 1,718,007 | 9,292 |
| – Gross Longs: | 1,624,619 | 8,610,807 | 48,987 |
| – Gross Shorts: | 3,351,918 | 6,892,800 | 39,695 |
| – Long to Short Ratio: | 0.5 to 1 | 1.2 to 1 | 1.2 to 1 |
| NET POSITION TREND: | | | |
| – Strength Index Score (3 Year Range Pct): | 0.0 | 100.0 | 52.8 |
| – Strength Index Reading (3 Year Range): | Bearish-Extreme | Bullish-Extreme | Bullish |
| NET POSITION MOVEMENT INDEX: | | | |
| – 6-Week Change in Strength Index: | -44.4 | 44.3 | 11.8 |
Secured Overnight Financing Rate (1-Month) Futures:
 Positioning Notes:
- Secured Overnight Financing Rate (1-Month) large speculator standing this week totaled a net position of -199,896 contracts in the data reported through Tuesday.
- Weekly Speculator position decline of -60,859 contracts from the previous week which had a total of -139,037 net contracts.
- This week’s current strength score (range over the past 3 years, measured from 0 to 100) shows the speculators are currently Bearish with a score of 42.8 percent.
- The Commercials are Bullish with a score of 56.3 percent.
- The Small Traders (not shown in chart) are Bullish with a score of 75.6 percent.
Price Trend-Following Model: Strong Uptrend
Our weekly trend-following model classifies the current market price position as: Strong Uptrend.
| SOFR 1-Month Statistics | SPECULATORS | COMMERCIALS | SMALL TRADERS |
| – Percent of Open Interest Longs: | 18.7 | 63.4 | 0.6 |
| – Percent of Open Interest Shorts: | 30.9 | 51.5 | 0.3 |
| – Net Position: | -199,896 | 195,689 | 4,207 |
| – Gross Longs: | 304,950 | 1,036,376 | 8,991 |
| – Gross Shorts: | 504,846 | 840,687 | 4,784 |
| – Long to Short Ratio: | 0.6 to 1 | 1.2 to 1 | 1.9 to 1 |
| NET POSITION TREND: | | | |
| – Strength Index Score (3 Year Range Pct): | 42.8 | 56.3 | 75.6 |
| – Strength Index Reading (3 Year Range): | Bearish | Bullish | Bullish |
| NET POSITION MOVEMENT INDEX: | | | |
| – 6-Week Change in Strength Index: | -26.9 | 26.1 | 8.6 |
2-Year Treasury Note Futures:
 Positioning Notes:
- 2-Year Treasury Note large speculator standing this week totaled a net position of -1,255,246 contracts in the data reported through Tuesday.
- Weekly Speculator position lift of 305,591 contracts from the previous week which had a total of -1,560,837 net contracts.
- This week’s current strength score (range over the past 3 years, measured from 0 to 100) shows the speculators are currently Bullish with a score of 58.0 percent.
- The Commercials are Bearish with a score of 47.3 percent.
- The Small Traders (not shown in chart) are Bearish-Extreme with a score of 0.0 percent.
Price Trend-Following Model: Downtrend
Our weekly trend-following model classifies the current market price position as: Downtrend.
| 2-Year Treasury Note Statistics | SPECULATORS | COMMERCIALS | SMALL TRADERS |
| – Percent of Open Interest Longs: | 9.6 | 75.7 | 6.7 |
| – Percent of Open Interest Shorts: | 34.9 | 51.5 | 5.6 |
| – Net Position: | -1,255,246 | 1,200,673 | 54,573 |
| – Gross Longs: | 478,428 | 3,756,899 | 332,359 |
| – Gross Shorts: | 1,733,674 | 2,556,226 | 277,786 |
| – Long to Short Ratio: | 0.3 to 1 | 1.5 to 1 | 1.2 to 1 |
| NET POSITION TREND: | | | |
| – Strength Index Score (3 Year Range Pct): | 58.0 | 47.3 | 0.0 |
| – Strength Index Reading (3 Year Range): | Bullish | Bearish | Bearish-Extreme |
| NET POSITION MOVEMENT INDEX: | | | |
| – 6-Week Change in Strength Index: | 53.3 | -48.7 | -13.4 |
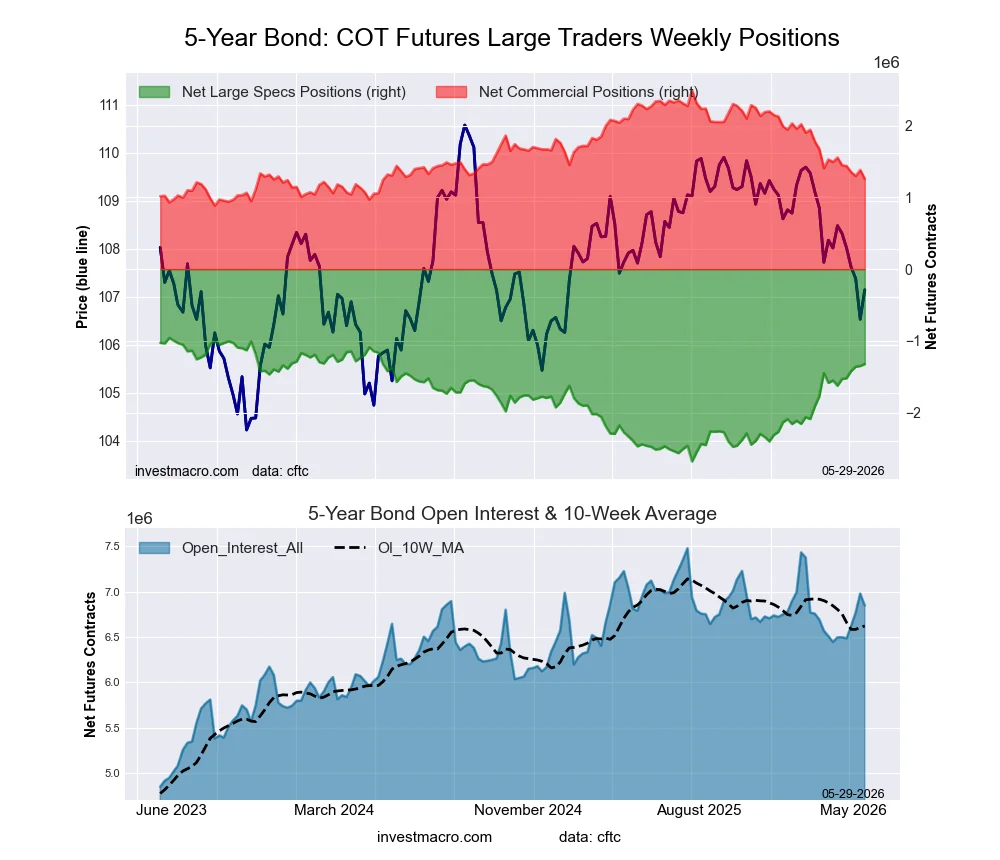
5-Year Treasury Note Futures:
 Positioning Notes:
- 5-Year Treasury Note large speculator standing this week totaled a net position of -1,323,127 contracts in the data reported through Tuesday.
- Weekly Speculator position advance of 27,389 contracts from the previous week which had a total of -1,350,516 net contracts.
- This week’s current strength score (range over the past 3 years, measured from 0 to 100) shows the speculators are currently Bullish with a score of 78.9 percent.
- The Commercials are Bearish with a score of 23.2 percent.
- The Small Traders (not shown in chart) are Bearish with a score of 34.1 percent.
Price Trend-Following Model: Weak Downtrend
Our weekly trend-following model classifies the current market price position as: Weak Downtrend.
| 5-Year Treasury Note Statistics | SPECULATORS | COMMERCIALS | SMALL TRADERS |
| – Percent of Open Interest Longs: | 7.7 | 77.4 | 6.7 |
| – Percent of Open Interest Shorts: | 27.0 | 59.0 | 5.7 |
| – Net Position: | -1,323,127 | 1,258,845 | 64,282 |
| – Gross Longs: | 526,960 | 5,297,812 | 457,425 |
| – Gross Shorts: | 1,850,087 | 4,038,967 | 393,143 |
| – Long to Short Ratio: | 0.3 to 1 | 1.3 to 1 | 1.2 to 1 |
| NET POSITION TREND: | | | |
| – Strength Index Score (3 Year Range Pct): | 78.9 | 23.2 | 34.1 |
| – Strength Index Reading (3 Year Range): | Bullish | Bearish | Bearish |
| NET POSITION MOVEMENT INDEX: | | | |
| – 6-Week Change in Strength Index: | 17.6 | -18.5 | -2.2 |
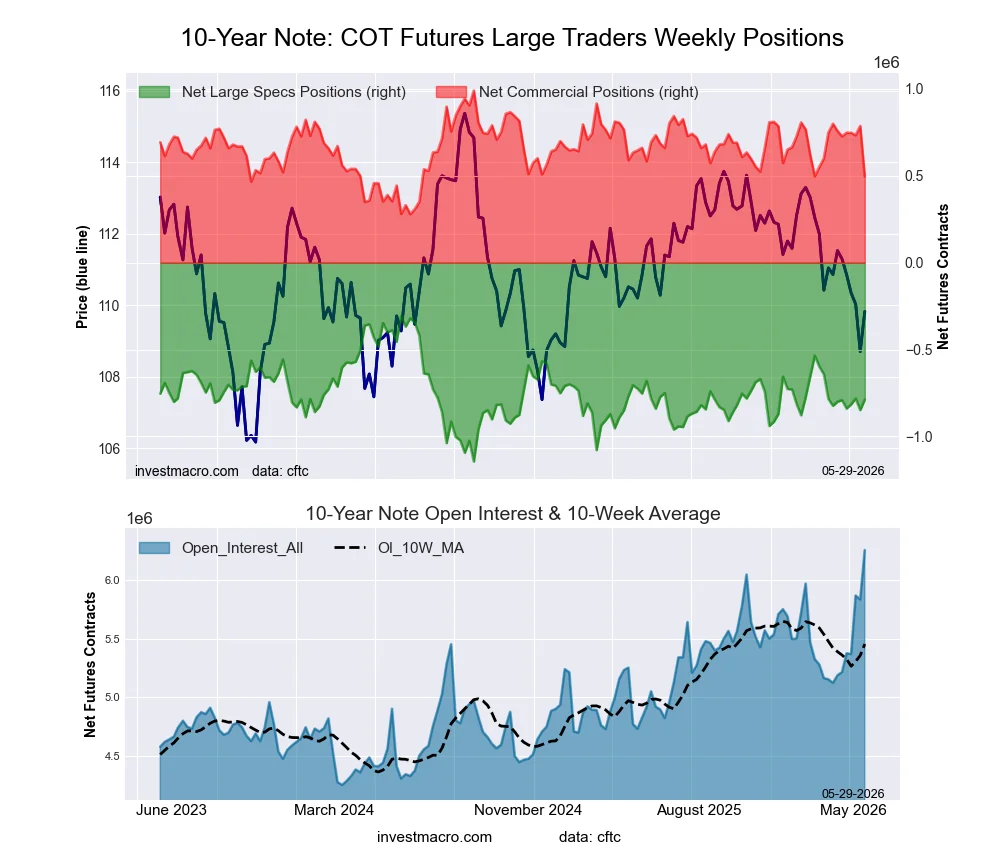
10-Year Treasury Note Futures:
 Positioning Notes:
- 10-Year Treasury Note large speculator standing this week totaled a net position of -787,954 contracts in the data reported through Tuesday.
- Weekly Speculator position advance of 60,098 contracts from the previous week which had a total of -848,052 net contracts.
- This week’s current strength score (range over the past 3 years, measured from 0 to 100) shows the speculators are currently Bearish with a score of 42.6 percent.
- The Commercials are Bearish with a score of 30.5 percent.
- The Small Traders (not shown in chart) are Bullish-Extreme with a score of 100.0 percent.
Price Trend-Following Model: Downtrend
Our weekly trend-following model classifies the current market price position as: Downtrend.
| 10-Year Treasury Note Statistics | SPECULATORS | COMMERCIALS | SMALL TRADERS |
| – Percent of Open Interest Longs: | 9.6 | 67.9 | 11.4 |
| – Percent of Open Interest Shorts: | 22.2 | 60.0 | 6.8 |
| – Net Position: | -787,954 | 496,185 | 291,769 |
| – Gross Longs: | 600,164 | 4,248,016 | 715,099 |
| – Gross Shorts: | 1,388,118 | 3,751,831 | 423,330 |
| – Long to Short Ratio: | 0.4 to 1 | 1.1 to 1 | 1.7 to 1 |
| NET POSITION TREND: | | | |
| – Strength Index Score (3 Year Range Pct): | 42.6 | 30.5 | 100.0 |
| – Strength Index Reading (3 Year Range): | Bearish | Bearish | Bullish-Extreme |
| NET POSITION MOVEMENT INDEX: | | | |
| – 6-Week Change in Strength Index: | 1.5 | -36.8 | 78.9 |
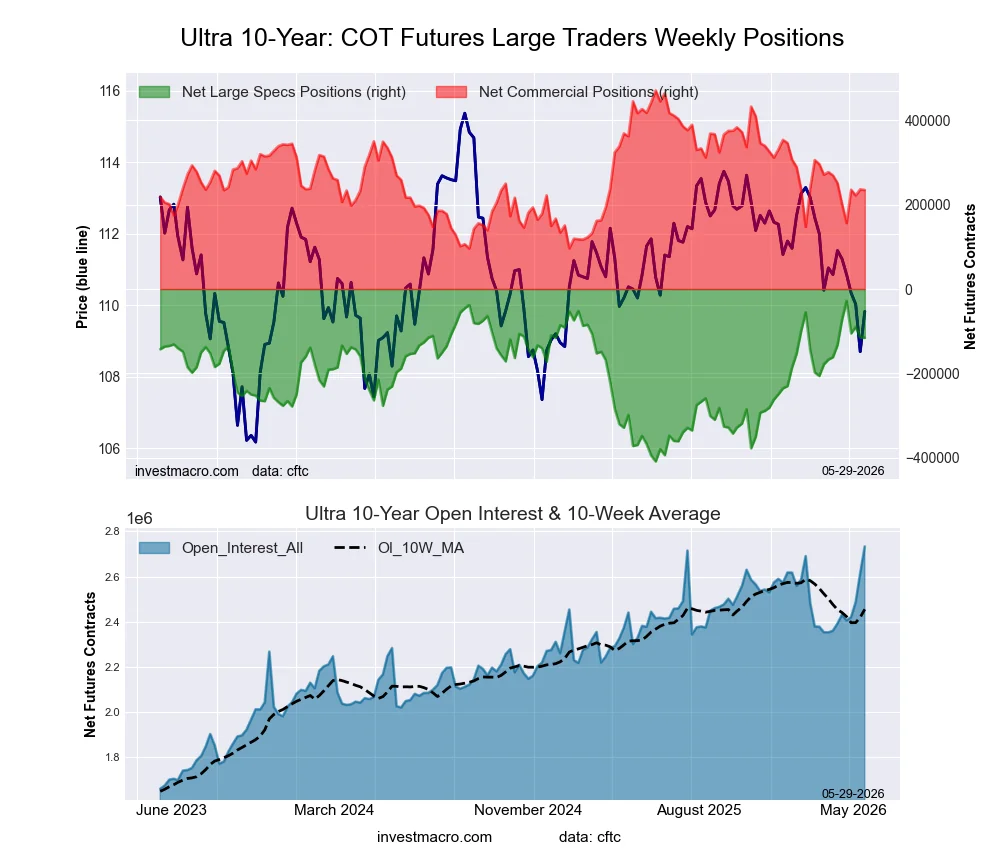
Ultra 10-Year Notes Futures:
 Positioning Notes:
- Ultra 10-Year Notes large speculator standing this week totaled a net position of -115,530 contracts in the data reported through Tuesday.
- Weekly Speculator position lowering of -576 contracts from the previous week which had a total of -114,954 net contracts.
- This week’s current strength score (range over the past 3 years, measured from 0 to 100) shows the speculators are currently Bullish with a score of 77.0 percent.
- The Commercials are Bearish with a score of 37.0 percent.
- The Small Traders (not shown in chart) are Bearish-Extreme with a score of 13.9 percent.
Price Trend-Following Model: Downtrend
Our weekly trend-following model classifies the current market price position as: Downtrend.
| Ultra 10-Year Notes Statistics | SPECULATORS | COMMERCIALS | SMALL TRADERS |
| – Percent of Open Interest Longs: | 8.6 | 76.2 | 9.9 |
| – Percent of Open Interest Shorts: | 12.8 | 67.6 | 14.2 |
| – Net Position: | -115,530 | 234,363 | -118,833 |
| – Gross Longs: | 235,008 | 2,081,677 | 269,622 |
| – Gross Shorts: | 350,538 | 1,847,314 | 388,455 |
| – Long to Short Ratio: | 0.7 to 1 | 1.1 to 1 | 0.7 to 1 |
| NET POSITION TREND: | | | |
| – Strength Index Score (3 Year Range Pct): | 77.0 | 37.0 | 13.9 |
| – Strength Index Reading (3 Year Range): | Bullish | Bearish | Bearish-Extreme |
| NET POSITION MOVEMENT INDEX: | | | |
| – 6-Week Change in Strength Index: | 4.6 | -4.4 | -0.8 |
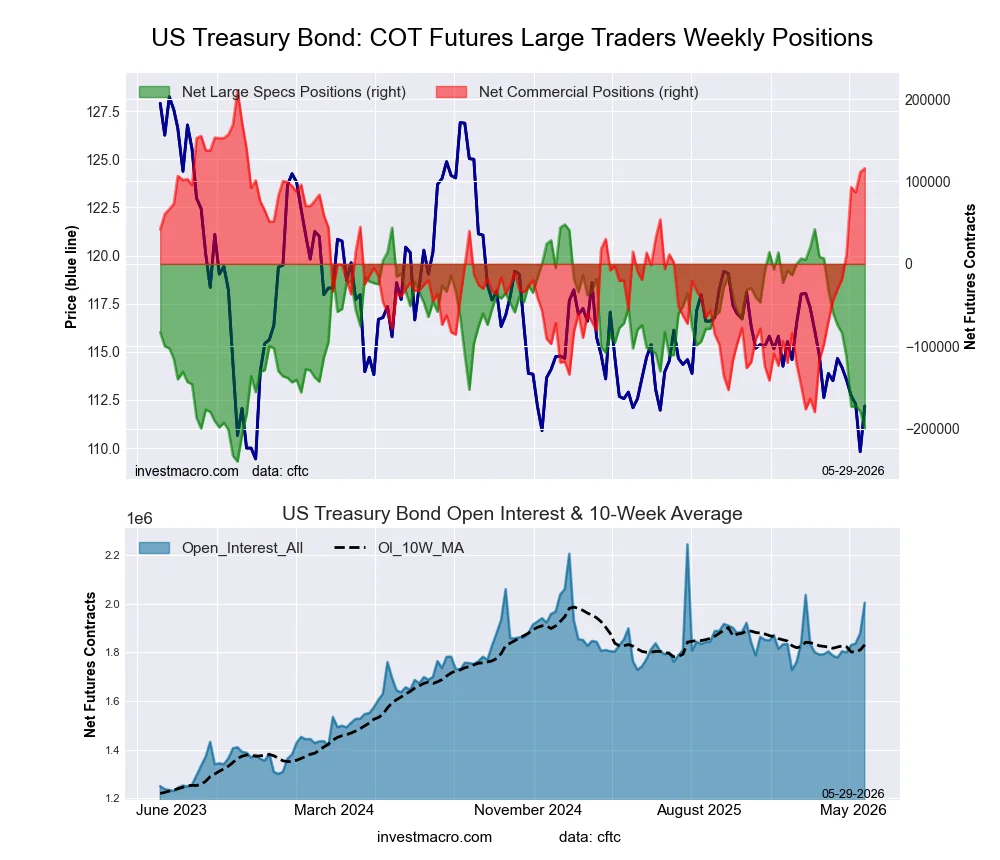
US Treasury Bonds Futures:
 Positioning Notes:
- US Treasury Bonds large speculator standing this week totaled a net position of -199,251 contracts in the data reported through Tuesday.
- Weekly Speculator position decline of -20,577 contracts from the previous week which had a total of -178,674 net contracts.
- This week’s current strength score (range over the past 3 years, measured from 0 to 100) shows the speculators are currently Bearish-Extreme with a score of 14.1 percent.
- The Commercials are Bullish with a score of 75.8 percent.
- The Small Traders (not shown in chart) are Bearish with a score of 38.8 percent.
Price Trend-Following Model: Downtrend
Our weekly trend-following model classifies the current market price position as: Downtrend.
| US Treasury Bonds Statistics | SPECULATORS | COMMERCIALS | SMALL TRADERS |
| – Percent of Open Interest Longs: | 8.2 | 74.2 | 13.1 |
| – Percent of Open Interest Shorts: | 18.1 | 68.5 | 8.9 |
| – Net Position: | -199,251 | 115,899 | 83,352 |
| – Gross Longs: | 164,586 | 1,488,410 | 262,170 |
| – Gross Shorts: | 363,837 | 1,372,511 | 178,818 |
| – Long to Short Ratio: | 0.5 to 1 | 1.1 to 1 | 1.5 to 1 |
| NET POSITION TREND: | | | |
| – Strength Index Score (3 Year Range Pct): | 14.1 | 75.8 | 38.8 |
| – Strength Index Reading (3 Year Range): | Bearish-Extreme | Bullish | Bearish |
| NET POSITION MOVEMENT INDEX: | | | |
| – 6-Week Change in Strength Index: | -43.5 | 37.6 | -15.0 |
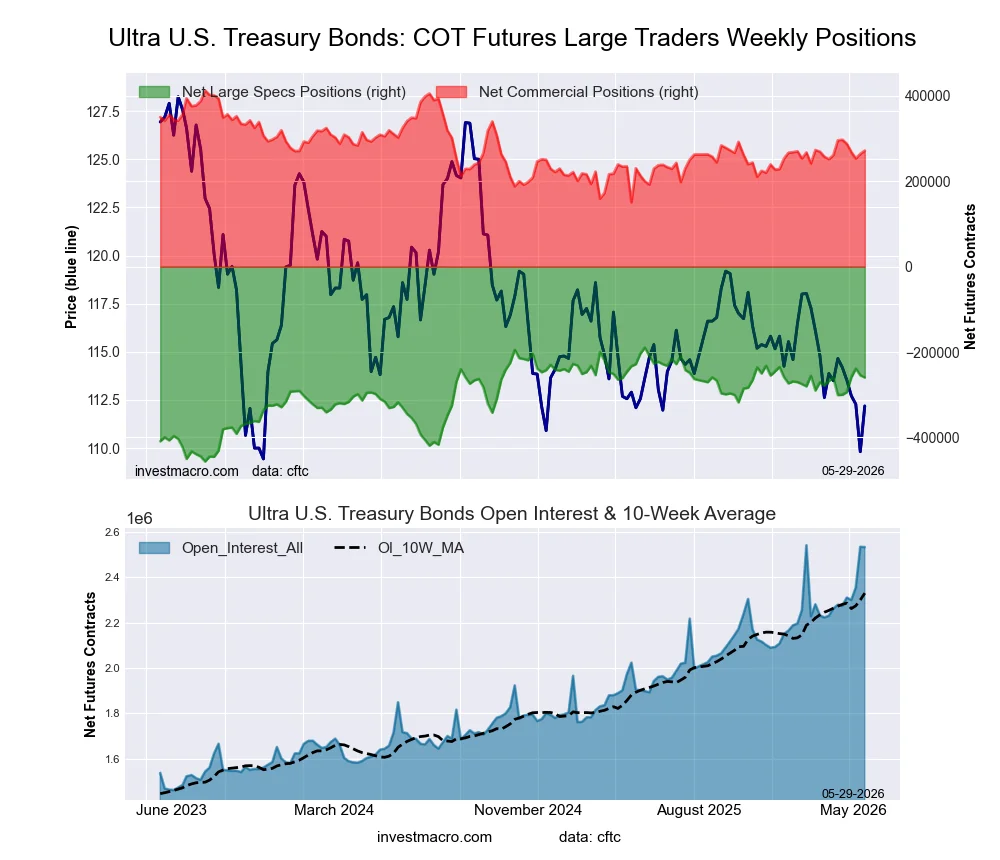
Ultra US Treasury Bonds Futures:
 Positioning Notes:
- Ultra US Treasury Bonds large speculator standing this week totaled a net position of -259,842 contracts in the data reported through Tuesday.
- Weekly Speculator position fall of -5,378 contracts from the previous week which had a total of -254,464 net contracts.
- This week’s current strength score (range over the past 3 years, measured from 0 to 100) shows the speculators are currently Bullish with a score of 73.7 percent.
- The Commercials are Bearish with a score of 46.3 percent.
- The Small Traders (not shown in chart) are Bearish-Extreme with a score of 2.7 percent.
Price Trend-Following Model: Downtrend
Our weekly trend-following model classifies the current market price position as: Downtrend.
| Ultra US Treasury Bonds Statistics | SPECULATORS | COMMERCIALS | SMALL TRADERS |
| – Percent of Open Interest Longs: | 5.7 | 82.9 | 7.9 |
| – Percent of Open Interest Shorts: | 16.0 | 72.2 | 8.4 |
| – Net Position: | -259,842 | 271,954 | -12,112 |
| – Gross Longs: | 144,429 | 2,100,077 | 199,583 |
| – Gross Shorts: | 404,271 | 1,828,123 | 211,695 |
| – Long to Short Ratio: | 0.4 to 1 | 1.1 to 1 | 0.9 to 1 |
| NET POSITION TREND: | | | |
| – Strength Index Score (3 Year Range Pct): | 73.7 | 46.3 | 2.7 |
| – Strength Index Reading (3 Year Range): | Bullish | Bearish | Bearish-Extreme |
| NET POSITION MOVEMENT INDEX: | | | |
| – 6-Week Change in Strength Index: | 15.4 | -9.1 | -17.5 |
Article By InvestMacro – Receive our weekly COT Reports by Email
*COT Report: The COT data, released weekly to the public each Friday, is updated through the most recent Tuesday (data is 3 days old) and shows a quick view of how large speculators or non-commercials (for-profit traders) were positioned in the futures markets.
The CFTC categorizes trader positions according to commercial hedgers (traders who use futures contracts for hedging as part of the business), non-commercials (large traders who speculate to realize trading profits) and nonreportable traders (usually small traders/speculators) as well as their open interest (contracts open in the market at time of reporting).See CFTC criteria here.
All information and opinions on this website and contained in this article are for general informational purposes only and do not constitute investment advice.