By InvestMacro
Here are the latest charts and statistics for the Commitment of Traders (COT) reports data published by the Commodities Futures Trading Commission (CFTC).
The latest COT data is updated through Tuesday June 9th and shows a quick view of how large traders (for-profit speculators and commercial entities) were positioned in the futures markets.
Weekly Speculator Changes led lower by Corn and Soybean Meal
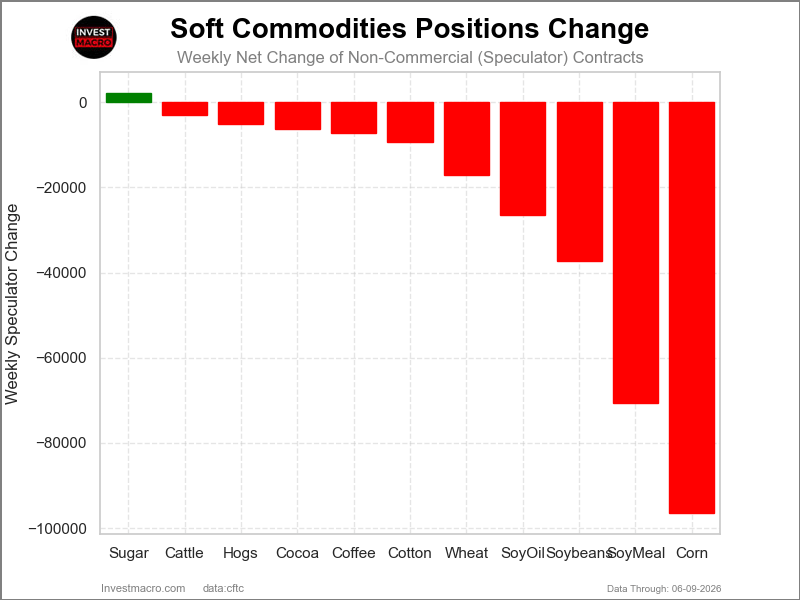
The COT soft commodities markets speculator bets were overall lower this week as just one out of the eleven softs markets we cover had higher positioning while the other ten markets had lower speculator contracts.
Leading the gains for the softs markets was Sugar with a small increase by 2,105 weekly contracts.
The markets with the declines in speculator bets this week were Corn (-96,383 contracts), Soybean Meal (-70,583 contracts), Soybeans (-37,321 contracts), Soybean Oil (-26,485 contracts), Wheat (-17,091 contracts), Cotton (-9,249 contracts), Coffee (-7,212 contracts), Cocoa (-6,185 contracts), Lean Hogs (-5,067 contracts) and with Live Cattle (-3,036 contracts) also registering lower bets on the week.
Cocoa and Coffee lead Soft Commodities price performance
Leading the Soft Commodities price gains this week was Cocoa, which rose by almost 4% with a 3.79% gain. Coffee came in second with a 2.90% rise on the week. Wheat was also up by over 2% with a 2.26% increase.
On the downside, Live Cattle was virtually unchanged with a -0.14% dip. Cotton was lower by -0.50%, Soybeans fell by -0.62%, followed by Corn, which declined by -0.96%. Lean Hogs was next with a -1.37% decline, followed by Soybean Meal, which dropped over 2% by -2.08%.
Soybean Oil was down by -2.41%. And Sugar was the biggest decliner with a -2.97% drop.
Soft Commodities Data:
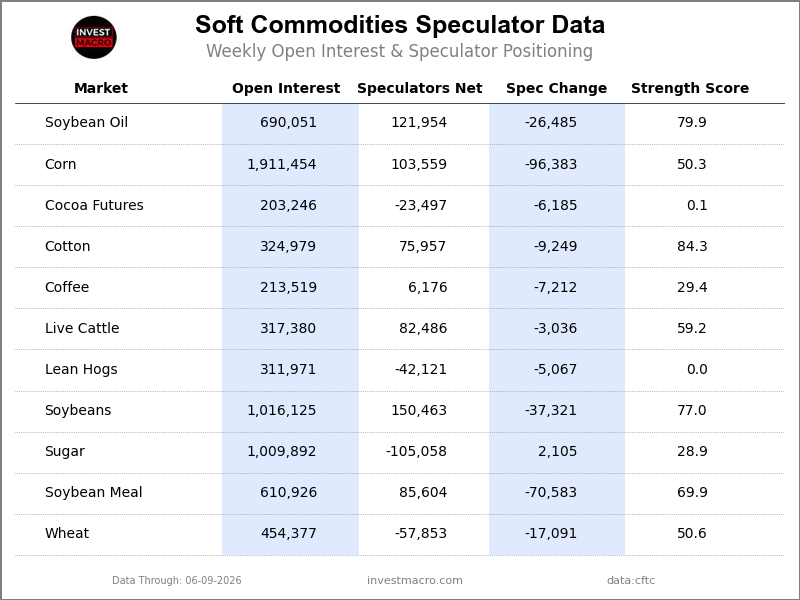
Legend: Weekly Speculators Change | Speculators Current Net Position | Speculators Strength Score compared to last 3-Years (0-100 range)
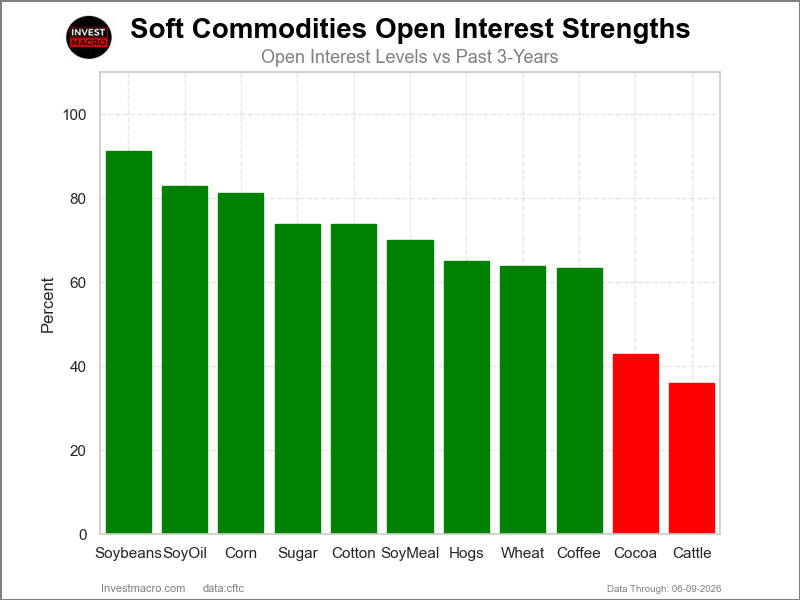
Strength Scores led by Cotton & Soybean Oil
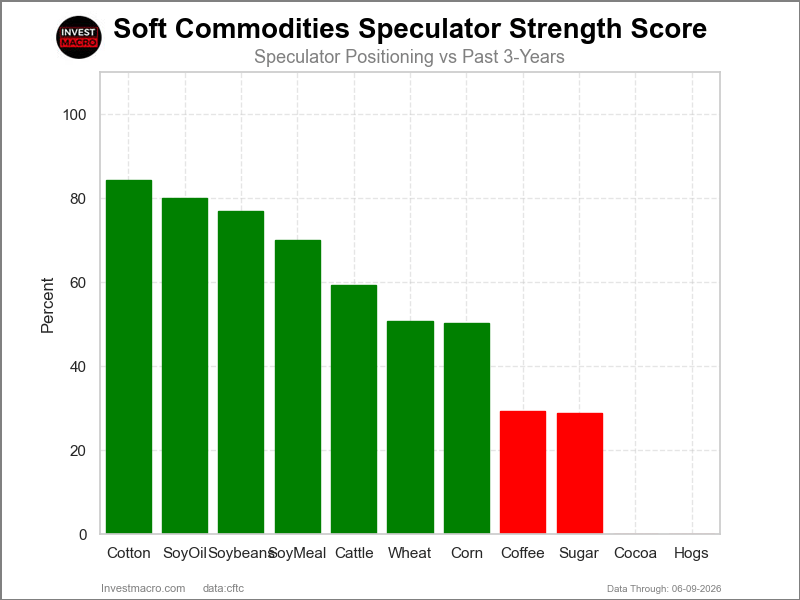
COT Strength Scores (a normalized measure of Speculator positions over a 3-Year range, from 0 to 100 where above 80 is Extreme-Bullish and below 20 is Extreme-Bearish) showed that Cotton (84 percent) and Soybean Oil (80 percent) lead the softs markets this week. Soybeans (77 percent), Soybean Meal (70 percent) and Live Cattle (59 percent) come in as the next highest in the weekly strength scores.
On the downside, Lean Hogs (0 percent) and Cocoa (0 percent) come in at the lowest strength levels currently and are in Extreme-Bearish territory (below 20 percent). The next lowest strength scores are the Sugar (29 percent) and the Coffee (29 percent).
Strength Statistics:
Corn (50.3 percent) vs Corn previous week (63.4 percent)
Sugar (28.9 percent) vs Sugar previous week (28.5 percent)
Coffee (29.4 percent) vs Coffee previous week (36.6 percent)
Soybeans (77.0 percent) vs Soybeans previous week (85.3 percent)
Soybean Oil (79.9 percent) vs Soybean Oil previous week (90.6 percent)
Soybean Meal (69.9 percent) vs Soybean Meal previous week (98.6 percent)
Live Cattle (59.2 percent) vs Live Cattle previous week (62.2 percent)
Lean Hogs (0.0 percent) vs Lean Hogs previous week (3.5 percent)
Cotton (84.3 percent) vs Cotton previous week (89.8 percent)
Cocoa (0.1 percent) vs Cocoa previous week (5.7 percent)
Wheat (50.6 percent) vs Wheat previous week (65.0 percent)
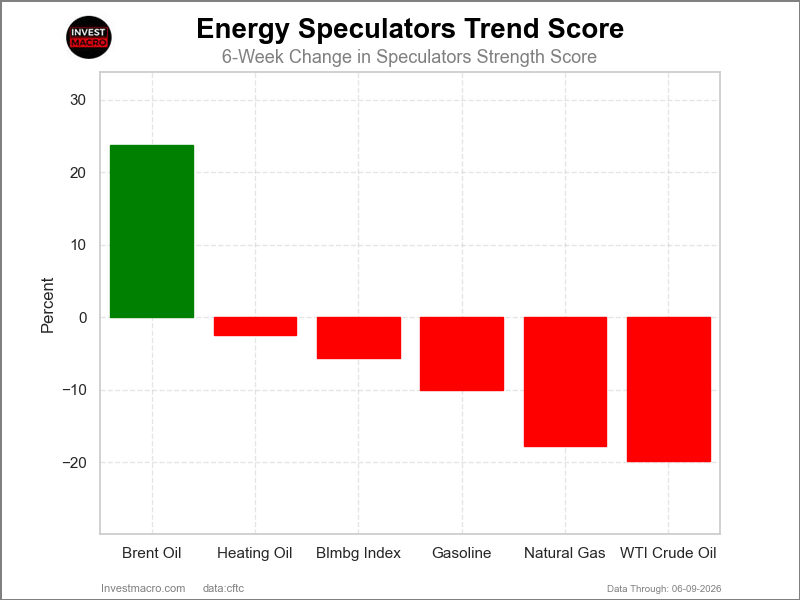
Sugar & Cocoa top the 6-Week Strength Trends
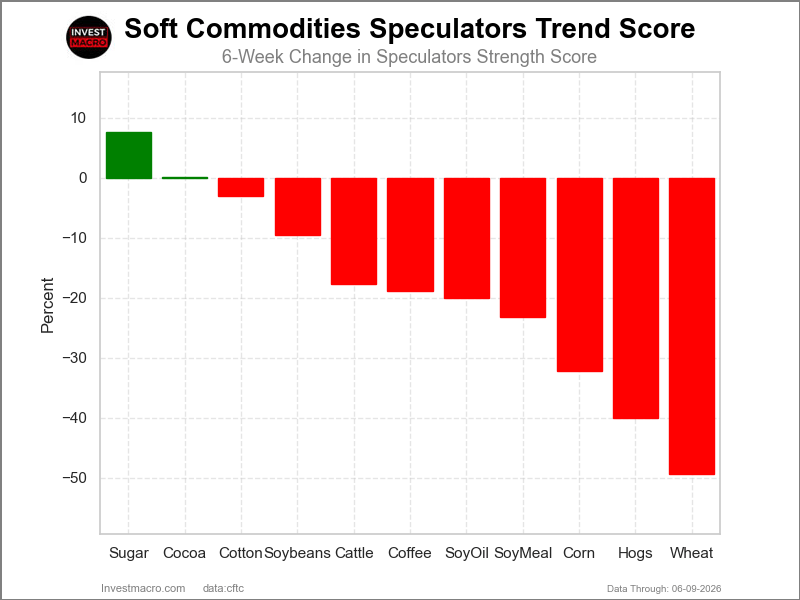
COT Strength Score Trends (or move index, calculates the 6-week changes in strength scores) showed that Sugar (8 percent) and Cocoa (0.1 percent) lead the past six weeks trends for soft commodities.
Wheat (-49 percent) leads the downside trend scores currently with Lean Hogs (-40 percent), Corn (-32 percent) and Soybean Meal (-23 percent) following next with lower trend scores.
Strength Trend Statistics:
Corn (-32.3 percent) vs Corn previous week (-8.7 percent)
Sugar (7.6 percent) vs Sugar previous week (9.5 percent)
Coffee (-18.9 percent) vs Coffee previous week (-5.9 percent)
Soybeans (-9.6 percent) vs Soybeans previous week (-5.2 percent)
Soybean Oil (-20.1 percent) vs Soybean Oil previous week (-8.3 percent)
Soybean Meal (-23.3 percent) vs Soybean Meal previous week (8.0 percent)
Live Cattle (-17.7 percent) vs Live Cattle previous week (-16.8 percent)
Lean Hogs (-40.1 percent) vs Lean Hogs previous week (-42.1 percent)
Cotton (-3.0 percent) vs Cotton previous week (1.6 percent)
Cocoa (0.1 percent) vs Cocoa previous week (1.9 percent)
Wheat (-49.4 percent) vs Wheat previous week (-12.8 percent)
Individual Soft Commodities Markets:
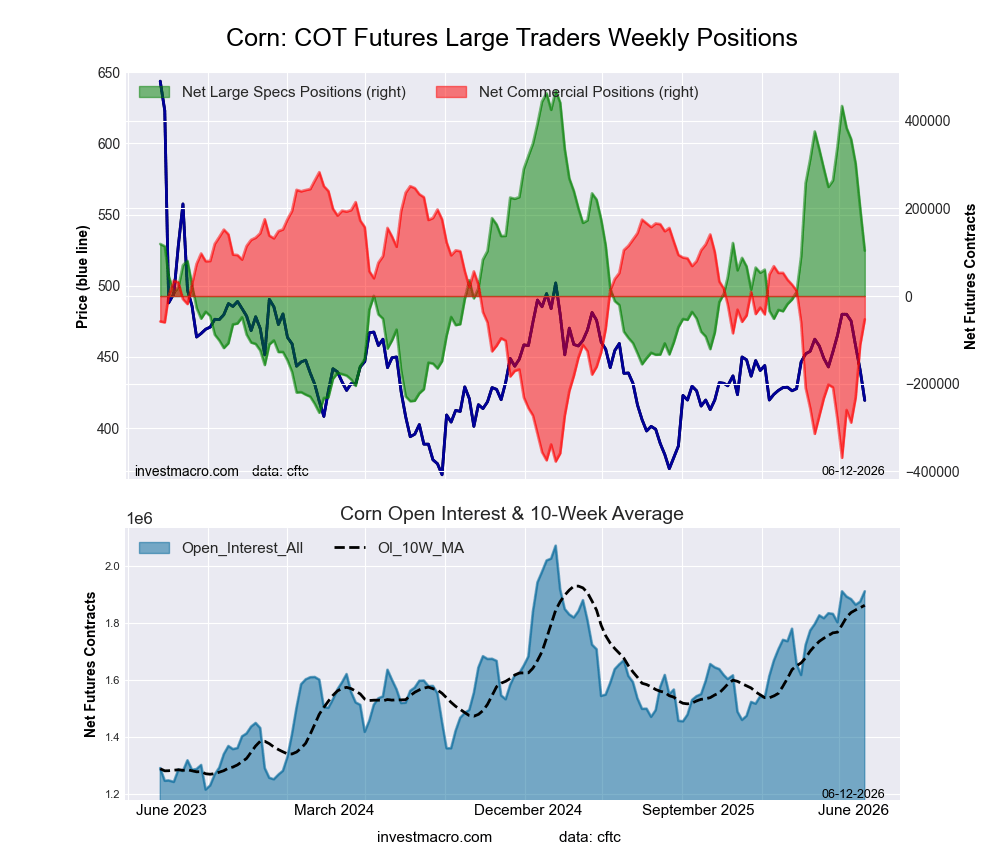
CORN Futures:
 Positioning Notes:
- CORN large speculator standing this week was a net position of 103,559 contracts in the data reported through Tuesday.
- Weekly Speculator position reduction of -96,383 contracts from the previous week which had a total of 199,942 net contracts.
- This week’s current strength score (range over the past 3 years, measured from 0 to 100) shows the speculators are currently Bullish with a score of 50.3 percent.
- The Commercials are Bearish with a score of 49.1 percent.
- The Small Traders (not shown in chart) are Bullish with a score of 62.0 percent.
Price Trend-Following Model: Weak Uptrend
Our weekly trend-following model classifies the current market price position as: Weak Uptrend.
| CORN Futures Statistics | SPECULATORS | COMMERCIALS | SMALL TRADERS |
| – Percent of Open Interest Longs: | 25.0 | 44.4 | 7.4 |
| – Percent of Open Interest Shorts: | 19.6 | 47.2 | 10.0 |
| – Net Position: | 103,559 | -53,122 | -50,437 |
| – Gross Longs: | 477,576 | 848,686 | 141,418 |
| – Gross Shorts: | 374,017 | 901,808 | 191,855 |
| – Long to Short Ratio: | 1.3 to 1 | 0.9 to 1 | 0.7 to 1 |
| NET POSITION TREND: | | | |
| – Strength Index Score (3 Year Range Pct): | 50.3 | 49.1 | 62.0 |
| – Strength Index Reading (3 Year Range): | Bullish | Bearish | Bullish |
| NET POSITION MOVEMENT INDEX: | | | |
| – 6-Week Change in Strength Index: | -32.3 | 34.7 | 6.9 |
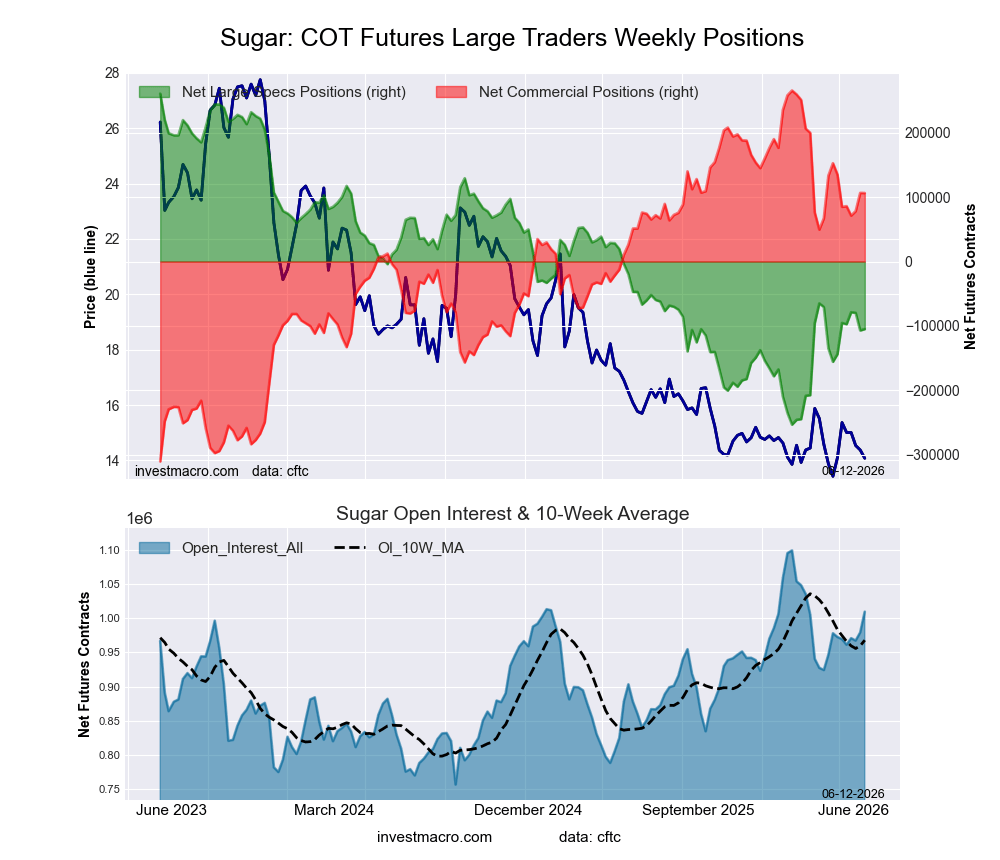
SUGAR Futures:
 Positioning Notes:
- SUGAR large speculator standing this week was a net position of -105,058 contracts in the data reported through Tuesday.
- Weekly Speculator position rise of 2,105 contracts from the previous week which had a total of -107,163 net contracts.
- This week’s current strength score (range over the past 3 years, measured from 0 to 100) shows the speculators are currently Bearish with a score of 28.9 percent.
- The Commercials are Bullish with a score of 72.4 percent.
- The Small Traders (not shown in chart) are Bearish with a score of 30.4 percent.
Price Trend-Following Model: Strong Downtrend
Our weekly trend-following model classifies the current market price position as: Strong Downtrend.
| SUGAR Futures Statistics | SPECULATORS | COMMERCIALS | SMALL TRADERS |
| – Percent of Open Interest Longs: | 22.3 | 50.9 | 8.2 |
| – Percent of Open Interest Shorts: | 32.7 | 40.3 | 8.3 |
| – Net Position: | -105,058 | 106,415 | -1,357 |
| – Gross Longs: | 225,149 | 513,549 | 82,833 |
| – Gross Shorts: | 330,207 | 407,134 | 84,190 |
| – Long to Short Ratio: | 0.7 to 1 | 1.3 to 1 | 1.0 to 1 |
| NET POSITION TREND: | | | |
| – Strength Index Score (3 Year Range Pct): | 28.9 | 72.4 | 30.4 |
| – Strength Index Reading (3 Year Range): | Bearish | Bullish | Bearish |
| NET POSITION MOVEMENT INDEX: | | | |
| – 6-Week Change in Strength Index: | 7.6 | -5.0 | -12.5 |
COFFEE Futures:
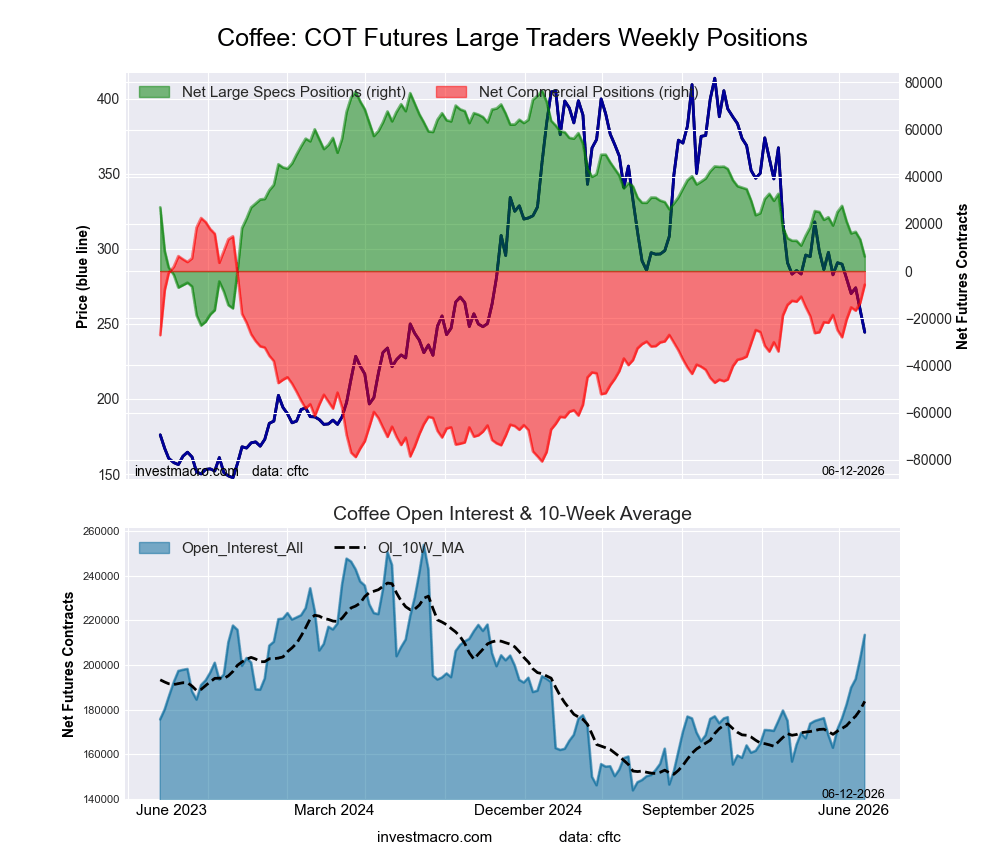 Positioning Notes:
- COFFEE large speculator standing this week was a net position of 6,176 contracts in the data reported through Tuesday.
- Weekly Speculator position reduction of -7,212 contracts from the previous week which had a total of 13,388 net contracts.
- This week’s current strength score (range over the past 3 years, measured from 0 to 100) shows the speculators are currently Bearish with a score of 29.4 percent.
- The Commercials are Bullish with a score of 72.6 percent.
- The Small Traders (not shown in chart) are Bearish-Extreme with a score of 8.6 percent.
Price Trend-Following Model: Strong Downtrend
Our weekly trend-following model classifies the current market price position as: Strong Downtrend.
| COFFEE Futures Statistics | SPECULATORS | COMMERCIALS | SMALL TRADERS |
| – Percent of Open Interest Longs: | 24.1 | 41.4 | 4.1 |
| – Percent of Open Interest Shorts: | 21.2 | 44.1 | 4.3 |
| – Net Position: | 6,176 | -5,785 | -391 |
| – Gross Longs: | 51,440 | 88,452 | 8,747 |
| – Gross Shorts: | 45,264 | 94,237 | 9,138 |
| – Long to Short Ratio: | 1.1 to 1 | 0.9 to 1 | 1.0 to 1 |
| NET POSITION TREND: | | | |
| – Strength Index Score (3 Year Range Pct): | 29.4 | 72.6 | 8.6 |
| – Strength Index Reading (3 Year Range): | Bearish | Bullish | Bearish-Extreme |
| NET POSITION MOVEMENT INDEX: | | | |
| – 6-Week Change in Strength Index: | -18.9 | 18.7 | -6.9 |
SOYBEANS Futures:
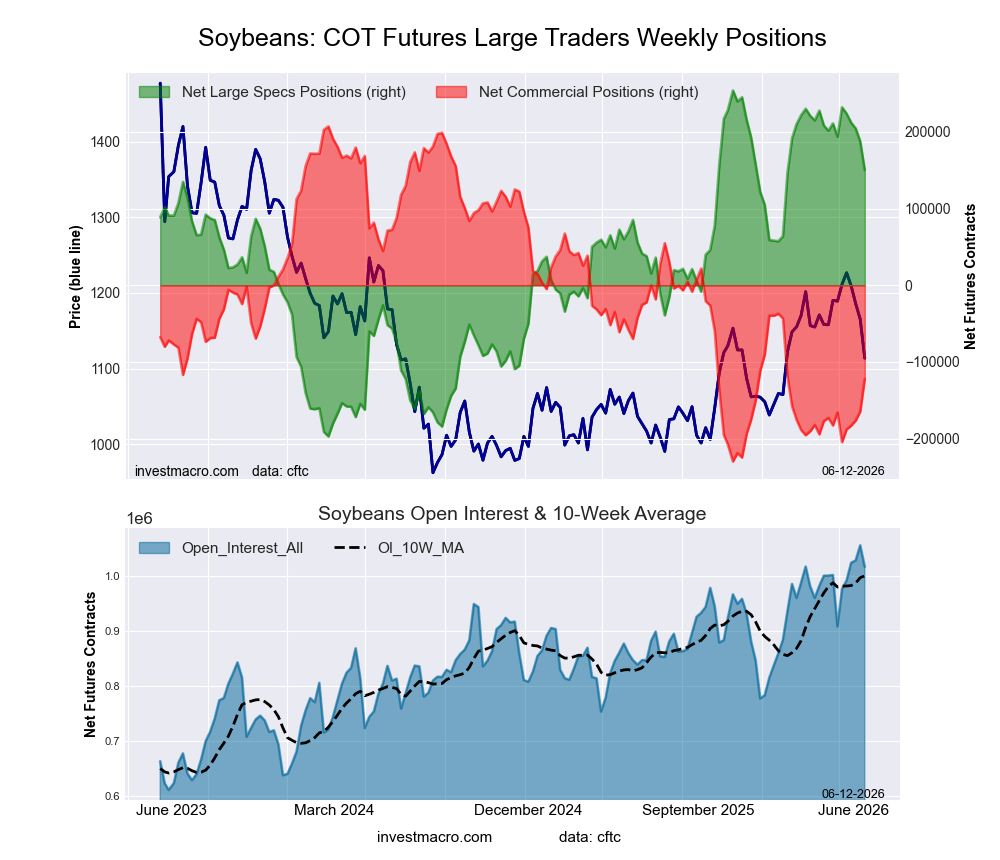 Positioning Notes:
- SOYBEANS large speculator standing this week was a net position of 150,463 contracts in the data reported through Tuesday.
- Weekly Speculator position decrease of -37,321 contracts from the previous week which had a total of 187,784 net contracts.
- This week’s current strength score (range over the past 3 years, measured from 0 to 100) shows the speculators are currently Bullish with a score of 77.0 percent.
- The Commercials are Bearish with a score of 24.7 percent.
- The Small Traders (not shown in chart) are Bearish with a score of 24.3 percent.
Price Trend-Following Model: Weak Uptrend
Our weekly trend-following model classifies the current market price position as: Weak Uptrend.
| SOYBEANS Futures Statistics | SPECULATORS | COMMERCIALS | SMALL TRADERS |
| – Percent of Open Interest Longs: | 26.3 | 48.8 | 4.5 |
| – Percent of Open Interest Shorts: | 11.5 | 60.8 | 7.3 |
| – Net Position: | 150,463 | -122,120 | -28,343 |
| – Gross Longs: | 267,406 | 495,979 | 45,342 |
| – Gross Shorts: | 116,943 | 618,099 | 73,685 |
| – Long to Short Ratio: | 2.3 to 1 | 0.8 to 1 | 0.6 to 1 |
| NET POSITION TREND: | | | |
| – Strength Index Score (3 Year Range Pct): | 77.0 | 24.7 | 24.3 |
| – Strength Index Reading (3 Year Range): | Bullish | Bearish | Bearish |
| NET POSITION MOVEMENT INDEX: | | | |
| – 6-Week Change in Strength Index: | -9.6 | 10.1 | -1.9 |
SOYBEAN OIL Futures:
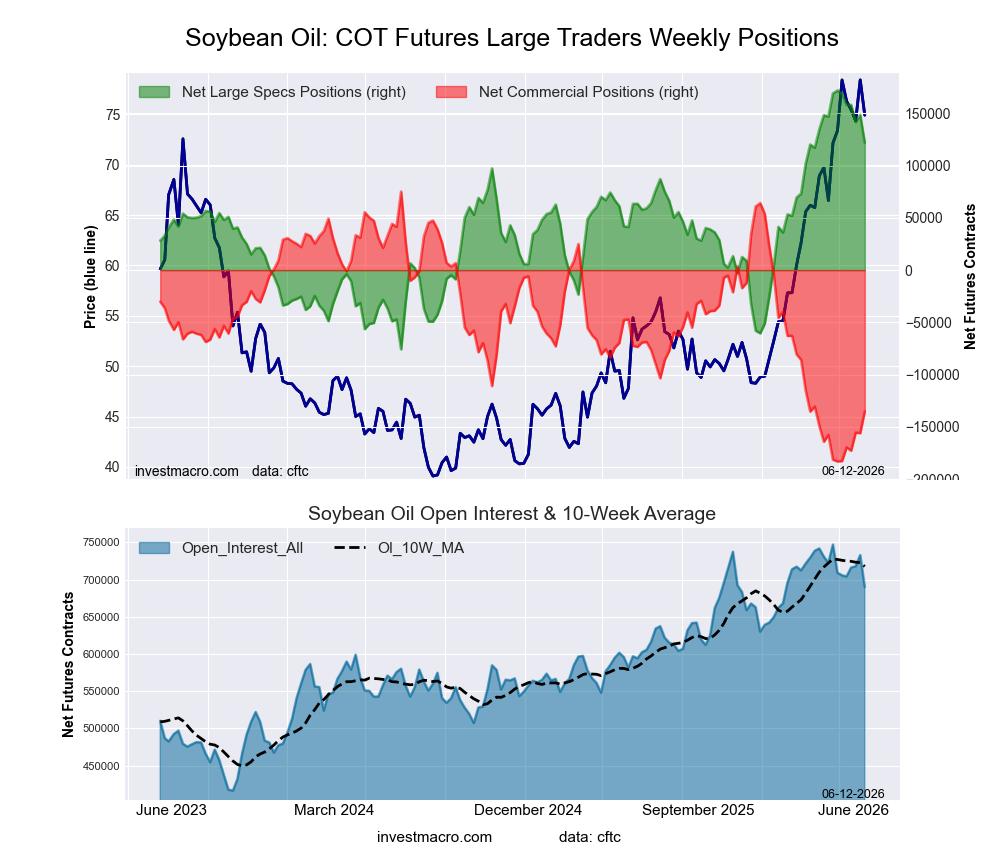 Positioning Notes:
- SOYBEAN OIL large speculator standing this week was a net position of 121,954 contracts in the data reported through Tuesday.
- Weekly Speculator position lowering of -26,485 contracts from the previous week which had a total of 148,439 net contracts.
- This week’s current strength score (range over the past 3 years, measured from 0 to 100) shows the speculators are currently Bullish with a score of 79.9 percent.
- The Commercials are Bearish-Extreme with a score of 18.6 percent.
- The Small Traders (not shown in chart) are Bullish-Extreme with a score of 83.8 percent.
Price Trend-Following Model: Uptrend
Our weekly trend-following model classifies the current market price position as: Uptrend.
| SOYBEAN OIL Futures Statistics | SPECULATORS | COMMERCIALS | SMALL TRADERS |
| – Percent of Open Interest Longs: | 27.1 | 45.9 | 5.9 |
| – Percent of Open Interest Shorts: | 9.4 | 65.5 | 4.0 |
| – Net Position: | 121,954 | -135,102 | 13,148 |
| – Gross Longs: | 186,964 | 316,763 | 40,539 |
| – Gross Shorts: | 65,010 | 451,865 | 27,391 |
| – Long to Short Ratio: | 2.9 to 1 | 0.7 to 1 | 1.5 to 1 |
| NET POSITION TREND: | | | |
| – Strength Index Score (3 Year Range Pct): | 79.9 | 18.6 | 83.8 |
| – Strength Index Reading (3 Year Range): | Bullish | Bearish-Extreme | Bullish-Extreme |
| NET POSITION MOVEMENT INDEX: | | | |
| – 6-Week Change in Strength Index: | -20.1 | 18.6 | 9.3 |
SOYBEAN MEAL Futures:
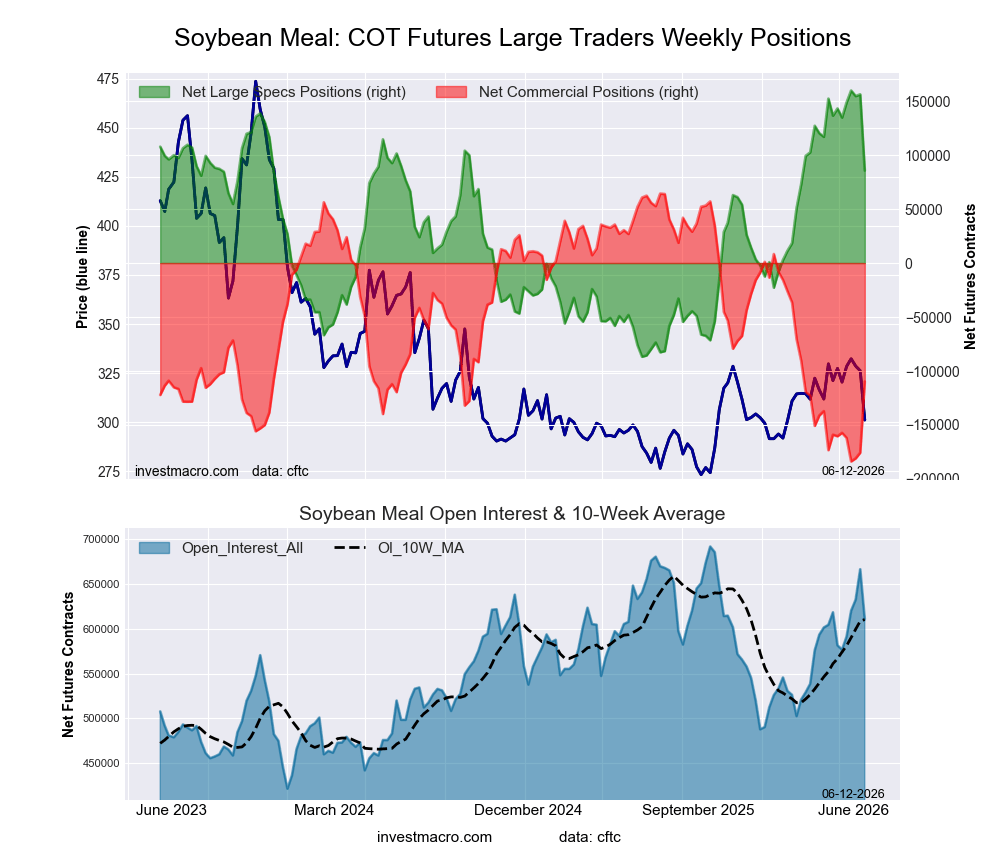 Positioning Notes:
- SOYBEAN MEAL large speculator standing this week was a net position of 85,604 contracts in the data reported through Tuesday.
- Weekly Speculator position lowering of -70,583 contracts from the previous week which had a total of 156,187 net contracts.
- This week’s current strength score (range over the past 3 years, measured from 0 to 100) shows the speculators are currently Bullish with a score of 69.9 percent.
- The Commercials are Bearish with a score of 29.8 percent.
- The Small Traders (not shown in chart) are Bullish with a score of 78.1 percent.
Price Trend-Following Model: Weak Uptrend
Our weekly trend-following model classifies the current market price position as: Weak Uptrend.
| SOYBEAN MEAL Futures Statistics | SPECULATORS | COMMERCIALS | SMALL TRADERS |
| – Percent of Open Interest Longs: | 26.9 | 48.6 | 8.4 |
| – Percent of Open Interest Shorts: | 12.9 | 66.6 | 4.5 |
| – Net Position: | 85,604 | -109,770 | 24,166 |
| – Gross Longs: | 164,267 | 297,197 | 51,481 |
| – Gross Shorts: | 78,663 | 406,967 | 27,315 |
| – Long to Short Ratio: | 2.1 to 1 | 0.7 to 1 | 1.9 to 1 |
| NET POSITION TREND: | | | |
| – Strength Index Score (3 Year Range Pct): | 69.9 | 29.8 | 78.1 |
| – Strength Index Reading (3 Year Range): | Bullish | Bearish | Bullish |
| NET POSITION MOVEMENT INDEX: | | | |
| – 6-Week Change in Strength Index: | -23.3 | 20.4 | 39.3 |
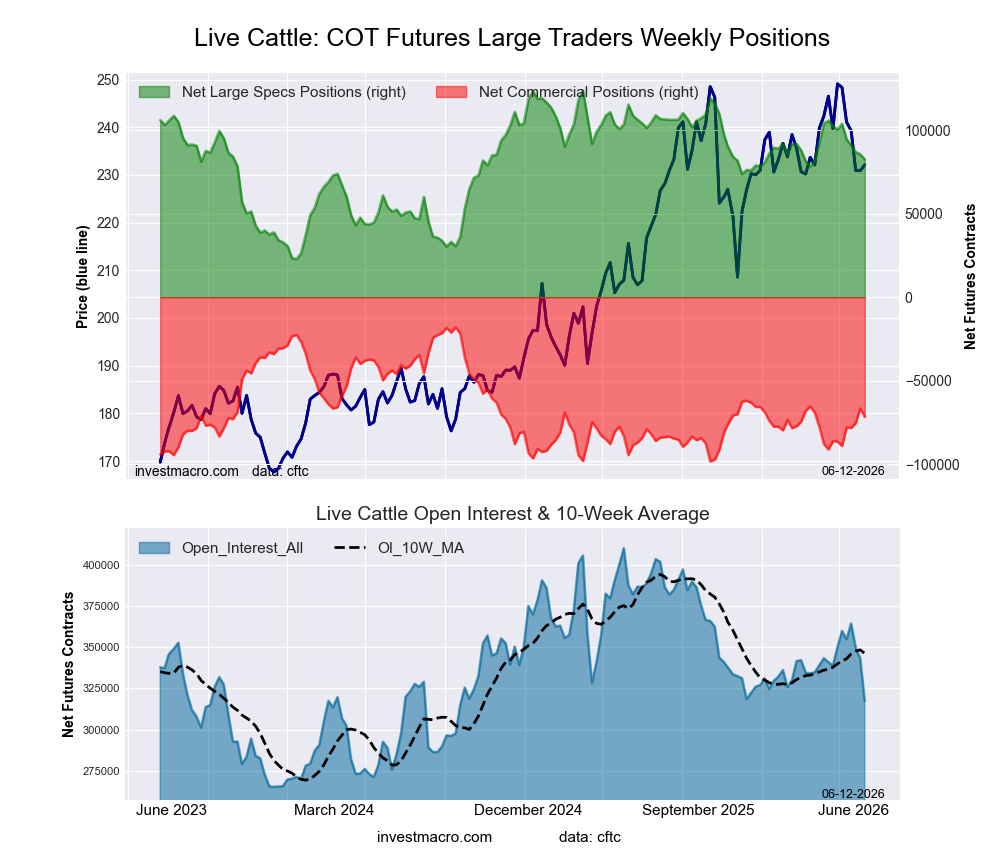
LIVE CATTLE Futures:
 Positioning Notes:
- LIVE CATTLE large speculator standing this week was a net position of 82,486 contracts in the data reported through Tuesday.
- Weekly Speculator position lowering of -3,036 contracts from the previous week which had a total of 85,522 net contracts.
- This week’s current strength score (range over the past 3 years, measured from 0 to 100) shows the speculators are currently Bullish with a score of 59.2 percent.
- The Commercials are Bearish with a score of 33.2 percent.
- The Small Traders (not shown in chart) are Bullish with a score of 60.2 percent.
Price Trend-Following Model: Weak Uptrend
Our weekly trend-following model classifies the current market price position as: Weak Uptrend.
| LIVE CATTLE Futures Statistics | SPECULATORS | COMMERCIALS | SMALL TRADERS |
| – Percent of Open Interest Longs: | 43.2 | 31.2 | 8.6 |
| – Percent of Open Interest Shorts: | 17.2 | 53.8 | 12.1 |
| – Net Position: | 82,486 | -71,638 | -10,848 |
| – Gross Longs: | 137,031 | 99,064 | 27,433 |
| – Gross Shorts: | 54,545 | 170,702 | 38,281 |
| – Long to Short Ratio: | 2.5 to 1 | 0.6 to 1 | 0.7 to 1 |
| NET POSITION TREND: | | | |
| – Strength Index Score (3 Year Range Pct): | 59.2 | 33.2 | 60.2 |
| – Strength Index Reading (3 Year Range): | Bullish | Bearish | Bullish |
| NET POSITION MOVEMENT INDEX: | | | |
| – 6-Week Change in Strength Index: | -17.7 | 18.5 | 10.6 |
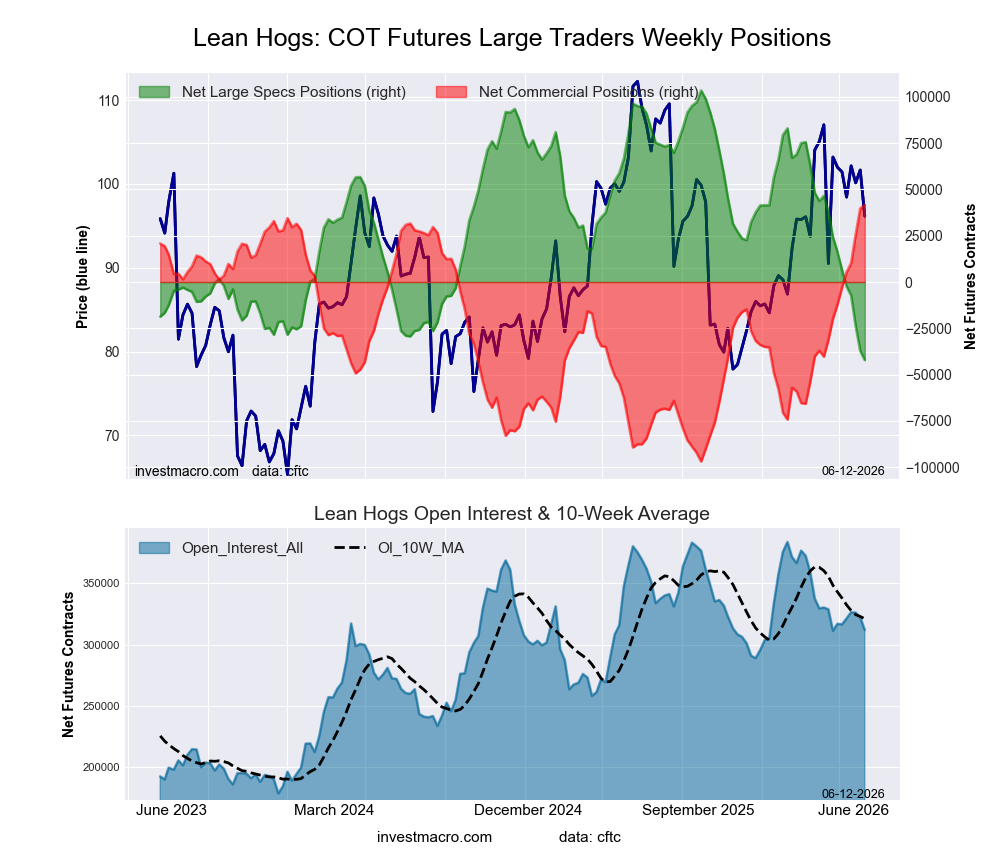
LEAN HOGS Futures:
 Positioning Notes:
- LEAN HOGS large speculator standing this week was a net position of -42,121 contracts in the data reported through Tuesday.
- Weekly Speculator position decline of -5,067 contracts from the previous week which had a total of -37,054 net contracts.
- This week’s current strength score (range over the past 3 years, measured from 0 to 100) shows the speculators are currently Bearish-Extreme with a score of 0.0 percent.
- The Commercials are Bullish-Extreme with a score of 100.0 percent.
- The Small Traders (not shown in chart) are Bullish-Extreme with a score of 92.2 percent.
Price Trend-Following Model: Weak Uptrend
Our weekly trend-following model classifies the current market price position as: Weak Uptrend.
| LEAN HOGS Futures Statistics | SPECULATORS | COMMERCIALS | SMALL TRADERS |
| – Percent of Open Interest Longs: | 22.8 | 41.8 | 8.0 |
| – Percent of Open Interest Shorts: | 36.3 | 28.4 | 7.9 |
| – Net Position: | -42,121 | 41,690 | 431 |
| – Gross Longs: | 71,117 | 130,274 | 25,107 |
| – Gross Shorts: | 113,238 | 88,584 | 24,676 |
| – Long to Short Ratio: | 0.6 to 1 | 1.5 to 1 | 1.0 to 1 |
| NET POSITION TREND: | | | |
| – Strength Index Score (3 Year Range Pct): | 0.0 | 100.0 | 92.2 |
| – Strength Index Reading (3 Year Range): | Bearish-Extreme | Bullish-Extreme | Bullish-Extreme |
| NET POSITION MOVEMENT INDEX: | | | |
| – 6-Week Change in Strength Index: | -40.1 | 38.9 | 30.7 |
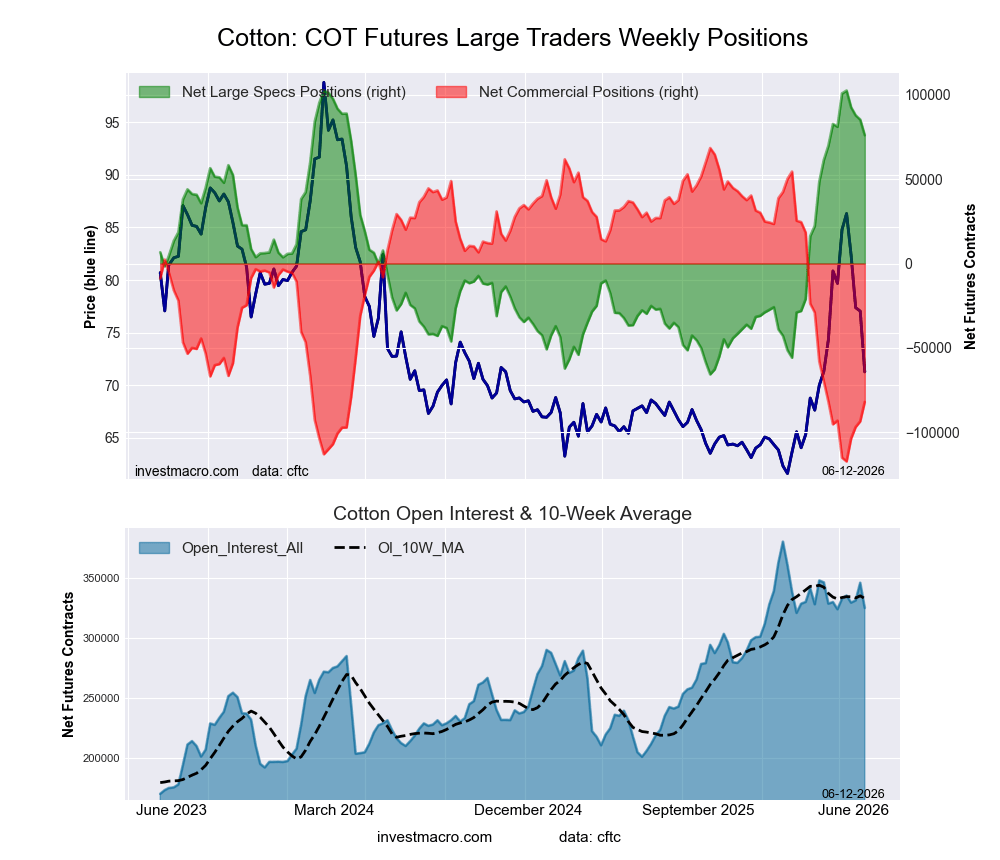
COTTON Futures:
 Positioning Notes:
- COTTON large speculator standing this week was a net position of 75,957 contracts in the data reported through Tuesday.
- Weekly Speculator position lowering of -9,249 contracts from the previous week which had a total of 85,206 net contracts.
- This week’s current strength score (range over the past 3 years, measured from 0 to 100) shows the speculators are currently Bullish-Extreme with a score of 84.3 percent.
- The Commercials are Bearish-Extreme with a score of 19.0 percent.
- The Small Traders (not shown in chart) are Bullish with a score of 50.6 percent.
Price Trend-Following Model: Weak Uptrend
Our weekly trend-following model classifies the current market price position as: Weak Uptrend.
| COTTON Futures Statistics | SPECULATORS | COMMERCIALS | SMALL TRADERS |
| – Percent of Open Interest Longs: | 38.9 | 37.4 | 4.8 |
| – Percent of Open Interest Shorts: | 15.5 | 62.6 | 2.9 |
| – Net Position: | 75,957 | -81,917 | 5,960 |
| – Gross Longs: | 126,353 | 121,661 | 15,510 |
| – Gross Shorts: | 50,396 | 203,578 | 9,550 |
| – Long to Short Ratio: | 2.5 to 1 | 0.6 to 1 | 1.6 to 1 |
| NET POSITION TREND: | | | |
| – Strength Index Score (3 Year Range Pct): | 84.3 | 19.0 | 50.6 |
| – Strength Index Reading (3 Year Range): | Bullish-Extreme | Bearish-Extreme | Bullish |
| NET POSITION MOVEMENT INDEX: | | | |
| – 6-Week Change in Strength Index: | -3.0 | 6.0 | -34.2 |
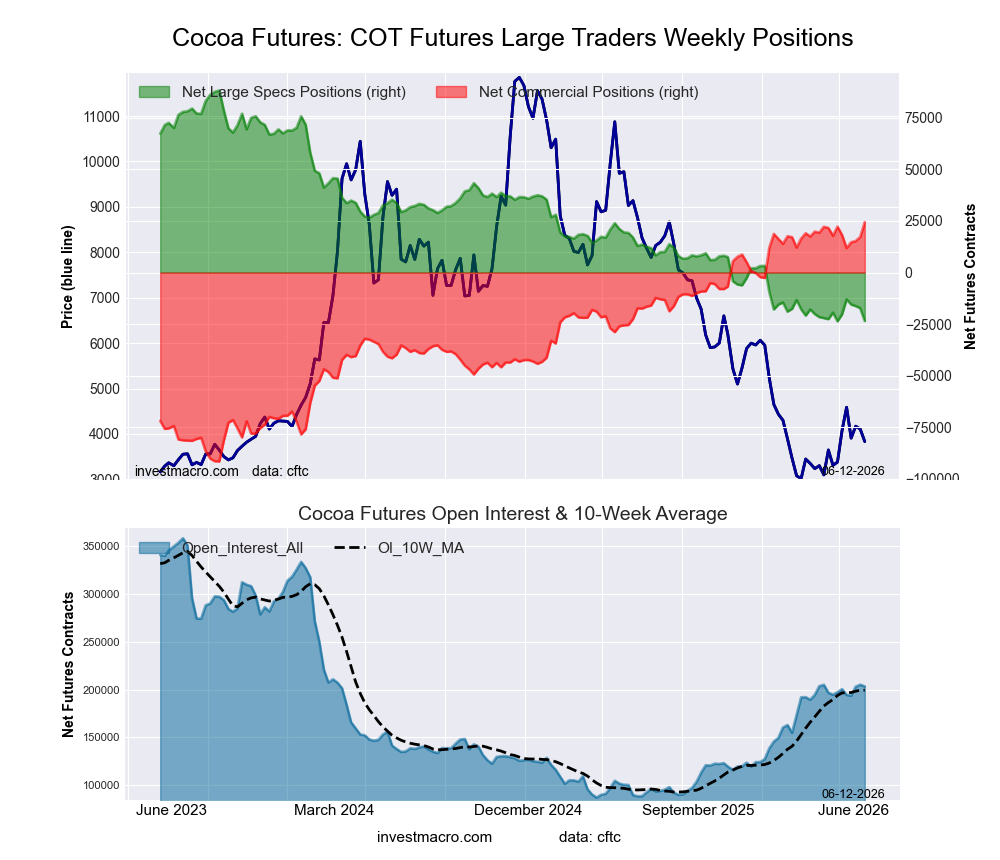
COCOA Futures:
 Positioning Notes:
- COCOA large speculator standing this week was a net position of -23,497 contracts in the data reported through Tuesday.
- Weekly Speculator position lowering of -6,185 contracts from the previous week which had a total of -17,312 net contracts.
- This week’s current strength score (range over the past 3 years, measured from 0 to 100) shows the speculators are currently Bearish-Extreme with a score of 0.1 percent.
- The Commercials are Bullish-Extreme with a score of 100.0 percent.
- The Small Traders (not shown in chart) are Bearish-Extreme with a score of 18.4 percent.
Price Trend-Following Model: Weak Uptrend
Our weekly trend-following model classifies the current market price position as: Weak Uptrend.
| COCOA Futures Statistics | SPECULATORS | COMMERCIALS | SMALL TRADERS |
| – Percent of Open Interest Longs: | 19.4 | 53.6 | 5.3 |
| – Percent of Open Interest Shorts: | 30.9 | 41.6 | 5.8 |
| – Net Position: | -23,497 | 24,426 | -929 |
| – Gross Longs: | 39,354 | 108,965 | 10,789 |
| – Gross Shorts: | 62,851 | 84,539 | 11,718 |
| – Long to Short Ratio: | 0.6 to 1 | 1.3 to 1 | 0.9 to 1 |
| NET POSITION TREND: | | | |
| – Strength Index Score (3 Year Range Pct): | 0.1 | 100.0 | 18.4 |
| – Strength Index Reading (3 Year Range): | Bearish-Extreme | Bullish-Extreme | Bearish-Extreme |
| NET POSITION MOVEMENT INDEX: | | | |
| – 6-Week Change in Strength Index: | 0.1 | 1.9 | -22.0 |
WHEAT Futures:
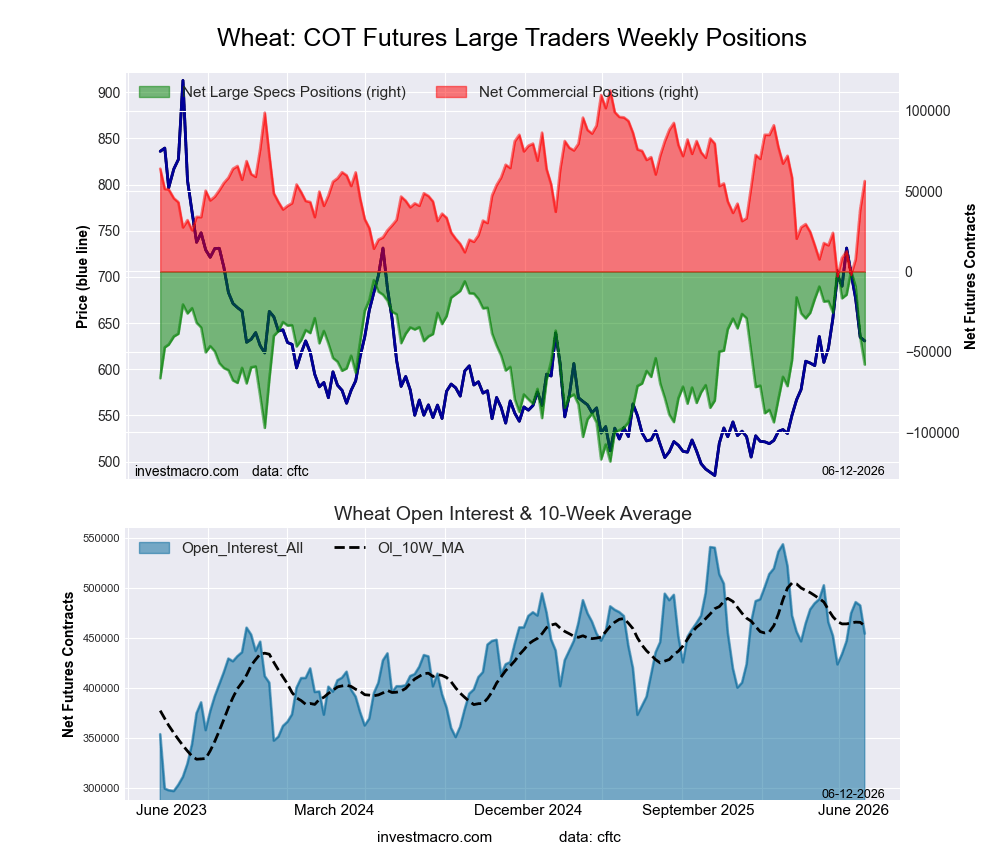 Positioning Notes:
- WHEAT large speculator standing this week was a net position of -57,853 contracts in the data reported through Tuesday.
- Weekly Speculator position decrease of -17,091 contracts from the previous week which had a total of -40,762 net contracts.
- This week’s current strength score (range over the past 3 years, measured from 0 to 100) shows the speculators are currently Bullish with a score of 50.6 percent.
- The Commercials are Bullish with a score of 51.3 percent.
- The Small Traders (not shown in chart) are Bullish with a score of 62.3 percent.
Price Trend-Following Model: Weak Uptrend
Our weekly trend-following model classifies the current market price position as: Weak Uptrend.
| WHEAT Futures Statistics | SPECULATORS | COMMERCIALS | SMALL TRADERS |
| – Percent of Open Interest Longs: | 25.5 | 40.6 | 8.0 |
| – Percent of Open Interest Shorts: | 38.2 | 28.2 | 7.6 |
| – Net Position: | -57,853 | 56,192 | 1,661 |
| – Gross Longs: | 115,711 | 184,410 | 36,405 |
| – Gross Shorts: | 173,564 | 128,218 | 34,744 |
| – Long to Short Ratio: | 0.7 to 1 | 1.4 to 1 | 1.0 to 1 |
| NET POSITION TREND: | | | |
| – Strength Index Score (3 Year Range Pct): | 50.6 | 51.3 | 62.3 |
| – Strength Index Reading (3 Year Range): | Bullish | Bullish | Bullish |
| NET POSITION MOVEMENT INDEX: | | | |
| – 6-Week Change in Strength Index: | -49.4 | 51.3 | -2.9 |
Article By InvestMacro – Receive our weekly COT Reports by Email
*COT Report: The COT data, released weekly to the public each Friday, is updated through the most recent Tuesday (data is 3 days old) and shows a quick view of how large speculators or non-commercials (for-profit traders) were positioned in the futures markets.
The CFTC categorizes trader positions according to commercial hedgers (traders who use futures contracts for hedging as part of the business), non-commercials (large traders who speculate to realize trading profits) and nonreportable traders (usually small traders/speculators) as well as their open interest (contracts open in the market at time of reporting).See CFTC criteria here.
All information and opinions on this website and contained in this article are for general informational purposes only and do not constitute investment advice.