
By RoboForex Analytical Department
The EUR/USD pair moved upward to 1.0844 on Thursday, marking an unexpected shift following a period of strong US dollar performance. This change in dynamics can be attributed to investors’ positive response to comments made by US Federal Reserve Chair Jerome Powell regarding the future of interest rates. Powell’s remarks led to a surge in risk appetite, resulting in the dollar’s decline.
Powell indicated that economic indicators would heavily influence the Federal Reserve’s decisions on interest rate adjustments. Traders interpreted his comments as suggesting that, given the recent modest nature of US economic data, the anticipated forecast of three rate cuts in 2024, starting in June, remains on the table. The expectation is for the Federal Reserve to reduce interest rates by 75 basis points by the year’s end, which aligns with earlier statements from the Fed. These hinted at a majority consensus among monetary policy committee members to commence rate cuts within the year, contingent on economic data.
Powell’s reaffirming the Fed’s trajectory towards lower interest rates, with specific timing depending on upcoming data, sets the stage for March’s closely watched US employment market reports. The focus will be on whether the unemployment rate has remained steady and whether there has been any deceleration in the growth of average wages.
Technical analysis of EUR/USD
Free Reports:
 Get our Weekly Commitment of Traders Reports - See where the biggest traders (Hedge Funds and Commercial Hedgers) are positioned in the futures markets on a weekly basis.
 Sign Up for Our Stock Market Newsletter – Get updated on News, Charts & Rankings of Public Companies when you join our Stocks Newsletter
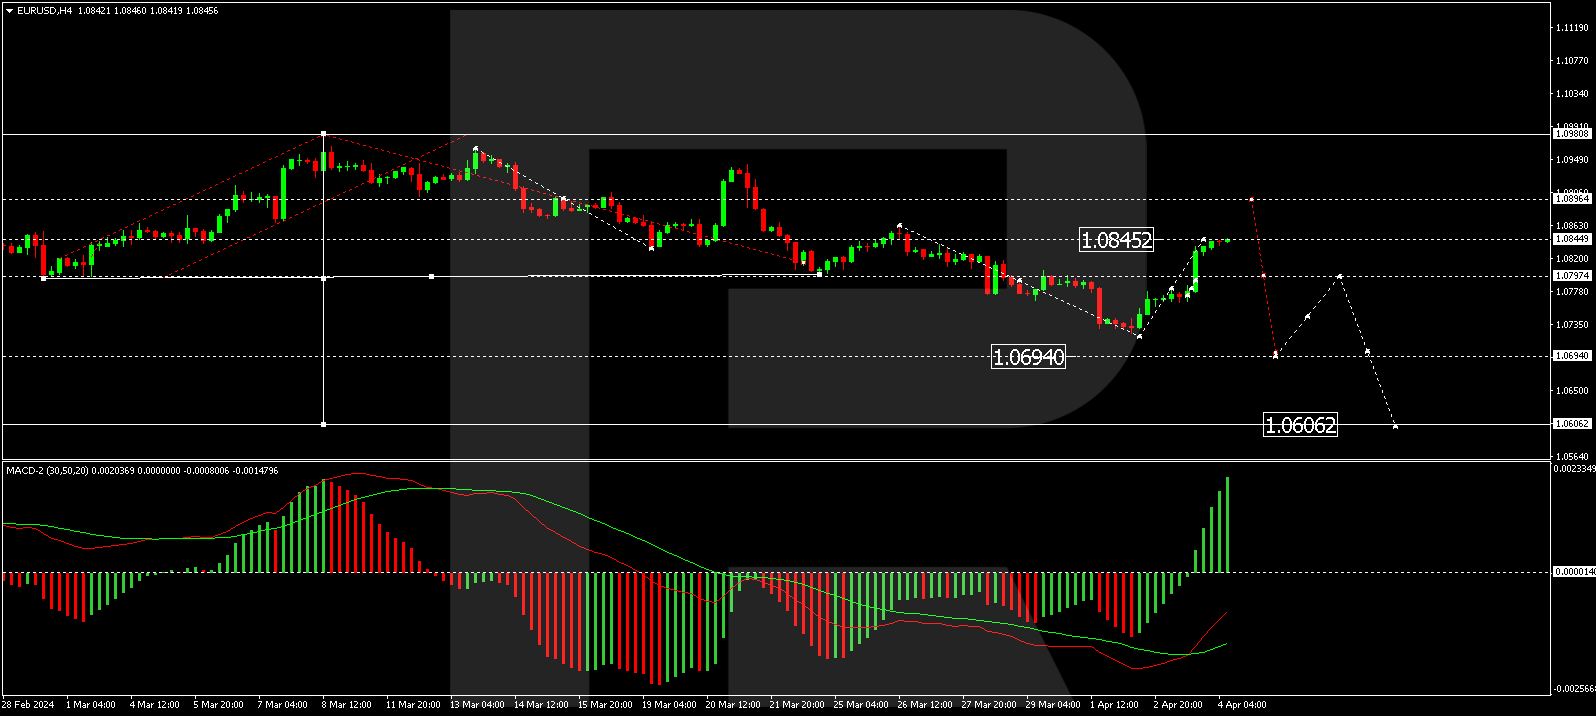
On the H4 chart, the EUR/USD pair has completed a correction to 1.0783, with a narrow consolidation range now established around this level. An upward breakout from this range could lead to a continuation of the correction to 1.0847, potentially followed by a new downward wave to 1.0694. This scenario is supported by the MACD indicator, where the signal line is below zero and the histogram peaks, suggesting a potential sharp decline.
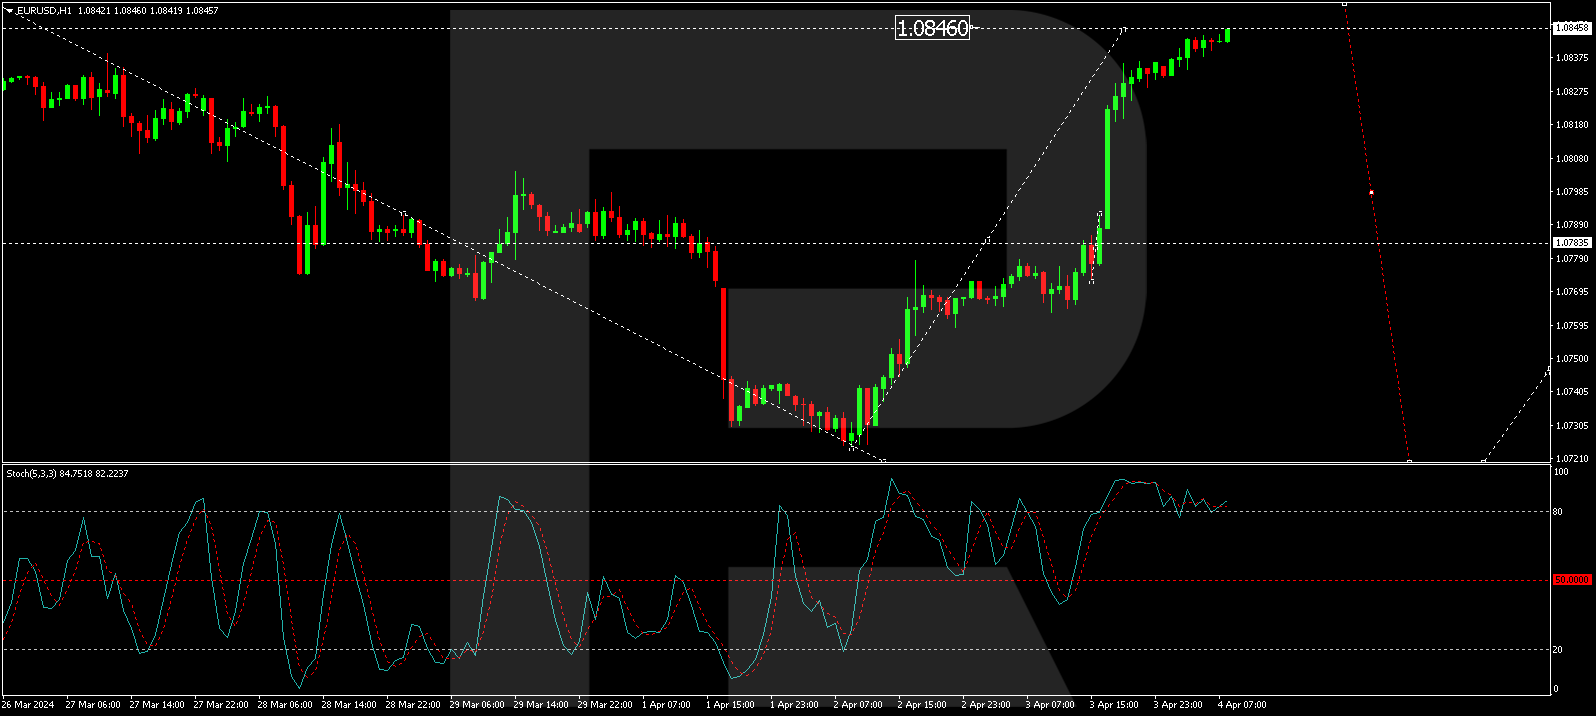
The H1 chart reveals a corrective pattern towards 1.0847, with an expected shift towards 1.0783 to commence a decline phase. A new consolidation range at these levels could lead to further correction to 1.0888 or a downward wave to 1.0694 upon a breakout. The Stochastic oscillator, positioned above 80, anticipates a significant drop to the 50 mark, potentially leading to further declines.
Disclaimer
Any forecasts contained herein are based on the author’s particular opinion. This analysis may not be treated as trading advice. RoboForex bears no responsibility for trading results based on trading recommendations and reviews contained herein.

- EUR/USD: Busy Week Ahead Aug 3, 2026
- Positive sentiment in the AI sector supported stock indices. Oil prices remain volatile Aug 3, 2026
- The Tech‑heavy NASDAQ Index jumped by more than 3.3%. The offshore yuan is trading at its highest level since 2023 Jul 31, 2026
- USD/JPY After Volatility: Multiple Events in One Day Jul 31, 2026
- The US indices sell off amid renewed US-Iran clashes. Oil jumps by 7% Jul 30, 2026
- USD/JPY Temporary in Equilibrium: Multiple Factors in Focus Jul 30, 2026
- GBP/USD at Month’s Lows: The Outlook Remains Weak Jul 29, 2026
- Crude oil falls below $80 per barrel. Australia sees inflation slowdown Jul 29, 2026
- The US Tech sector hit by sell‑off. Oil prices decline on renewed negotiations Jul 28, 2026
- Gold Declines, Focus on Fed and Falling Oil Prices Jul 28, 2026
