
By RoboForex Analytical Department
Gold’s price soared to a new record high on Monday, stabilising around 2344.00 USD per troy ounce. A confluence of factors is currently bolstering the precious metal’s value.
Geopolitical tensions in the Middle East are a significant driver, positioning gold as a preferred “safe-haven” investment. Additionally, central banks worldwide are increasing their gold reserves, while global exchange-traded funds (ETFs) that track the metal’s price continue to show keen interest.
Recent US job market data for March surpassed expectations, indicating a robust end to the first quarter for the US economy. These developments could impact the Federal Reserve’s interest rate decisions, as lower rates diminish the opportunity cost of holding gold, further supporting its price increase.
Since the start of the year, gold has appreciated over 12% in value, showcasing an impressive performance for what is traditionally viewed as a conservative asset.
XAU/USD technical analysis
Free Reports:
 Download Our Metatrader 4 Indicators – Put Our Free MetaTrader 4 Custom Indicators on your charts when you join our Weekly Newsletter
 Get our Weekly Commitment of Traders Reports - See where the biggest traders (Hedge Funds and Commercial Hedgers) are positioned in the futures markets on a weekly basis.
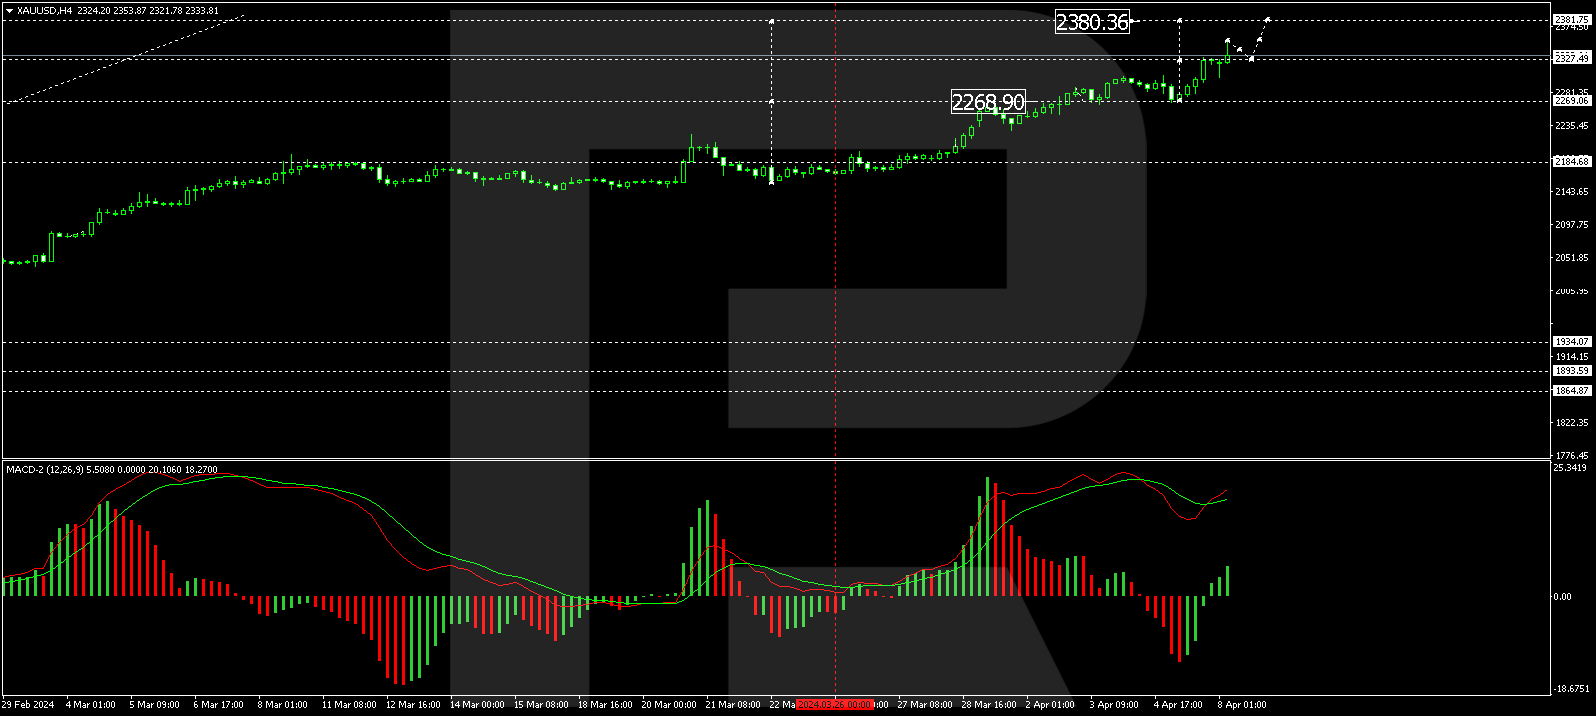
The H4 chart for XAU/USD indicates that a growth wave reached 2330.00, followed by the formation of a consolidation range around this level. This range has now expanded to 2353.85. A technical retracement to 2330.00 is anticipated (testing from above), with potential subsequent growth to 2380.33 as a local target. The MACD indicator, with its signal line well above zero and pointing upwards, supports this growth scenario.
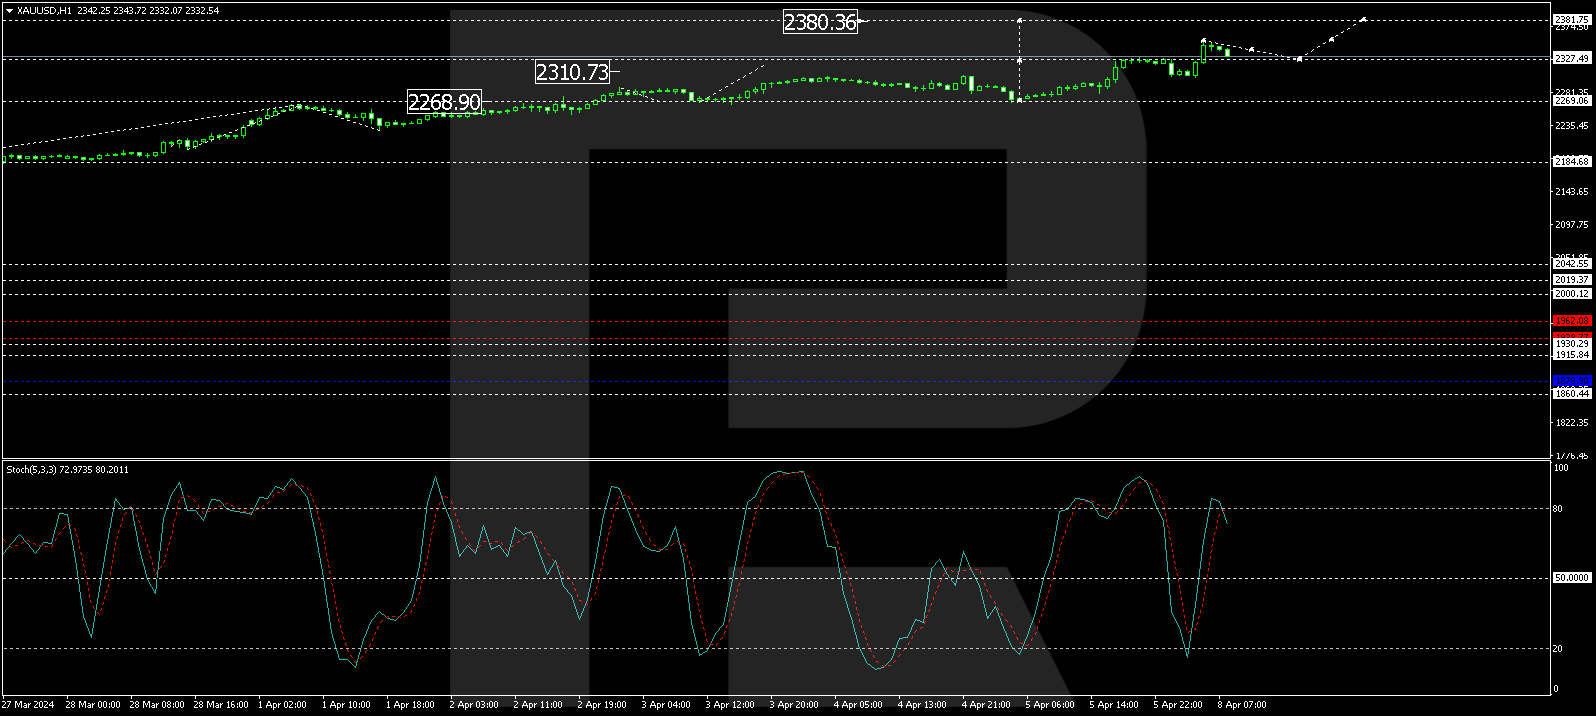
On the H1 chart, XAU/USD established support at 2269.00, completing a growth structure to 2330.53. A consolidation range has formed around this level, now extended to 2353.85. A corrective move to 2327.50 (testing from above) is expected, potentially leading to a new growth wave towards 2386.36. This forecast is confirmed by the Stochastic oscillator, with its signal line preparing to drop to 50 before climbing back to 80.
Disclaimer
Any forecasts contained herein are based on the author’s particular opinion. This analysis may not be treated as trading advice. RoboForex bears no responsibility for trading results based on trading recommendations and reviews contained herein.

- EUR/USD: Busy Week Ahead Aug 3, 2026
- Positive sentiment in the AI sector supported stock indices. Oil prices remain volatile Aug 3, 2026
- The Tech‑heavy NASDAQ Index jumped by more than 3.3%. The offshore yuan is trading at its highest level since 2023 Jul 31, 2026
- USD/JPY After Volatility: Multiple Events in One Day Jul 31, 2026
- The US indices sell off amid renewed US-Iran clashes. Oil jumps by 7% Jul 30, 2026
- USD/JPY Temporary in Equilibrium: Multiple Factors in Focus Jul 30, 2026
- GBP/USD at Month’s Lows: The Outlook Remains Weak Jul 29, 2026
- Crude oil falls below $80 per barrel. Australia sees inflation slowdown Jul 29, 2026
- The US Tech sector hit by sell‑off. Oil prices decline on renewed negotiations Jul 28, 2026
- Gold Declines, Focus on Fed and Falling Oil Prices Jul 28, 2026
