By InvestMacro
Here are the latest charts and statistics for the Commitment of Traders (COT) reports data published by the Commodities Futures Trading Commission (CFTC).
The latest COT data is updated through Tuesday May 14th and shows a quick view of how large traders (for-profit speculators and commercial entities) were positioned in the futures markets.
Weekly Speculator Changes led by Corn & Wheat
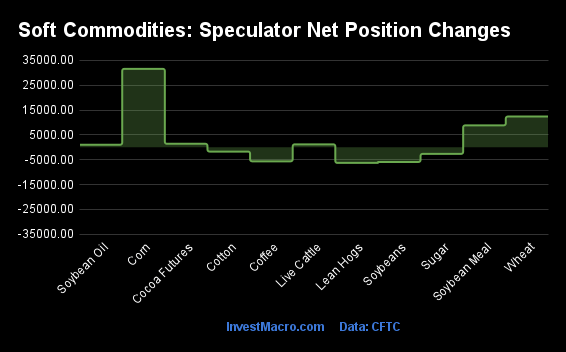
The COT soft commodities markets speculator bets were higher this week as six out of the eleven softs markets we cover had higher positioning while the other five markets had lower speculator contracts.
Leading the gains for the softs markets was Corn (31,578 contracts) with Wheat (12,370 contracts), Soybean Meal (8,815 contracts), Cocoa (1,396 contracts), Live Cattle (1,184 contracts) and Soybean Oil (1,021 contracts) also showing positive weeks.
The markets with the declines in speculator bets this week were Lean Hogs (-6,315 contracts), Soybeans (-5,927 contracts), Coffee (-5,666 contracts), Sugar (-2,670 contracts) and with Cotton (-1,737 contracts) also registering lower bets on the week.
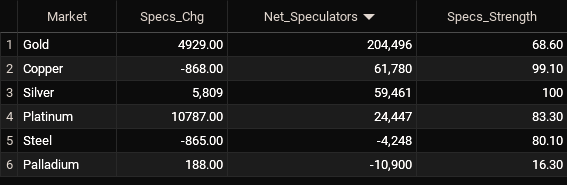
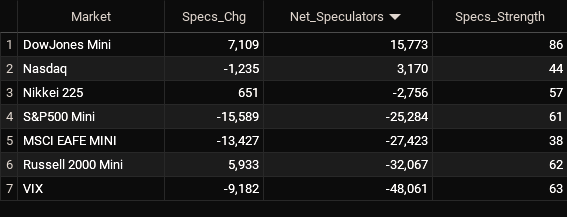
Soft Commodities Net Speculators Leaderboard
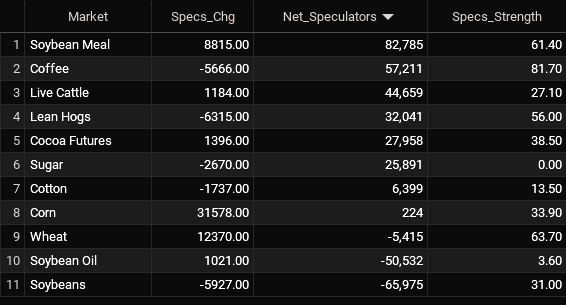
Legend: Weekly Speculators Change | Speculators Current Net Position | Speculators Strength Score compared to last 3-Years (0-100 range)
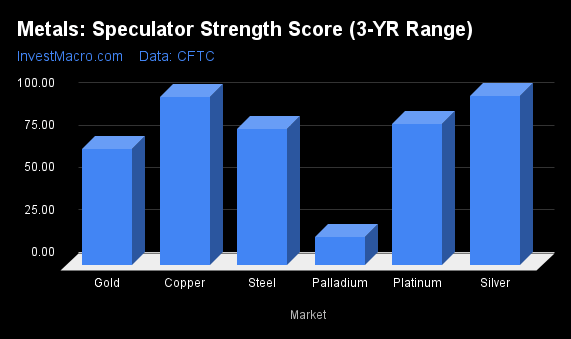
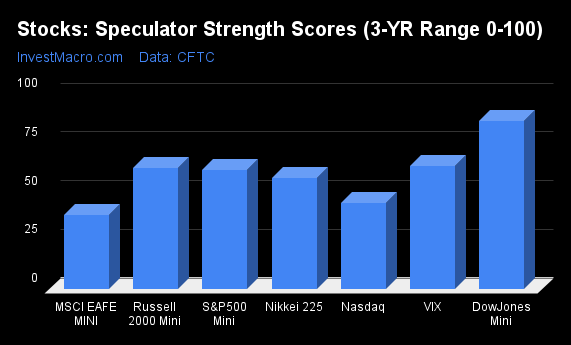
Strength Scores led by Coffee & Wheat
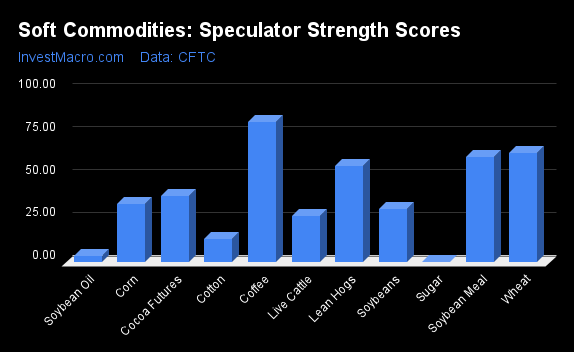
COT Strength Scores (a normalized measure of Speculator positions over a 3-Year range, from 0 to 100 where above 80 is Extreme-Bullish and below 20 is Extreme-Bearish) showed that Coffee (82 percent) and Wheat (64 percent) lead the softs markets this week. Soybean Meal (61 percent) and Lean Hogs (56 percent) come in as the next highest in the weekly strength scores.
On the downside, Sugar (0 percent), Soybean Oil (4 percent) and Cotton (14 percent) come in at the lowest strength levels currently and are in Extreme-Bearish territory (below 20 percent).
Strength Statistics:
Corn (33.9 percent) vs Corn previous week (29.9 percent)
Sugar (0.0 percent) vs Sugar previous week (1.0 percent)
Coffee (81.7 percent) vs Coffee previous week (87.2 percent)
Soybeans (31.0 percent) vs Soybeans previous week (32.4 percent)
Soybean Oil (3.6 percent) vs Soybean Oil previous week (3.0 percent)
Soybean Meal (61.4 percent) vs Soybean Meal previous week (57.7 percent)
Live Cattle (27.1 percent) vs Live Cattle previous week (25.8 percent)
Lean Hogs (56.0 percent) vs Lean Hogs previous week (61.2 percent)
Cotton (13.5 percent) vs Cotton previous week (14.8 percent)
Cocoa (38.5 percent) vs Cocoa previous week (37.1 percent)
Wheat (63.7 percent) vs Wheat previous week (55.2 percent)
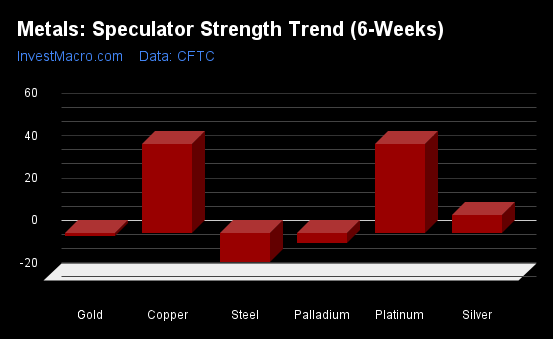
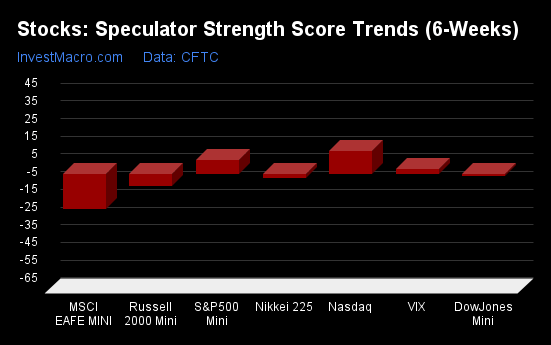
Soybean Meal & Wheat top the 6-Week Strength Trends
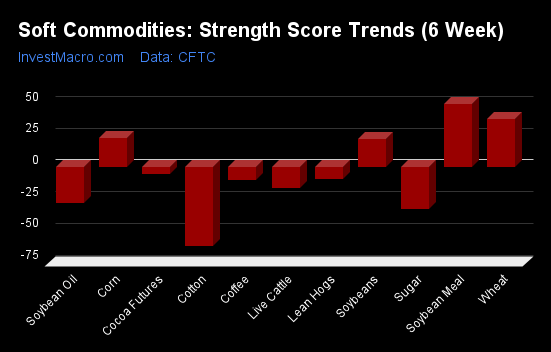
COT Strength Score Trends (or move index, calculates the 6-week changes in strength scores) showed that Soybean Meal (50 percent) and Wheat (38 percent) lead the past six weeks trends for soft commodities. Corn (23 percent) and Soybeans (22 percent) are the next highest positive movers in the latest trends data.
Cotton (-62 percent) leads the downside trend scores currently with Sugar (-33 percent), Soybean Oil (-29 percent) and Live Cattle (-17 percent) following next with lower trend scores.
Strength Trend Statistics:
Corn (23.1 percent) vs Corn previous week (18.7 percent)
Sugar (-33.1 percent) vs Sugar previous week (-26.0 percent)
Coffee (-10.0 percent) vs Coffee previous week (6.7 percent)
Soybeans (21.7 percent) vs Soybeans previous week (22.1 percent)
Soybean Oil (-28.6 percent) vs Soybean Oil previous week (-26.1 percent)
Soybean Meal (49.7 percent) vs Soybean Meal previous week (42.5 percent)
Live Cattle (-16.6 percent) vs Live Cattle previous week (-25.3 percent)
Lean Hogs (-9.1 percent) vs Lean Hogs previous week (3.0 percent)
Cotton (-62.0 percent) vs Cotton previous week (-60.6 percent)
Cocoa (-5.8 percent) vs Cocoa previous week (-10.0 percent)
Wheat (38.1 percent) vs Wheat previous week (30.5 percent)
Individual Soft Commodities Markets:
CORN Futures:
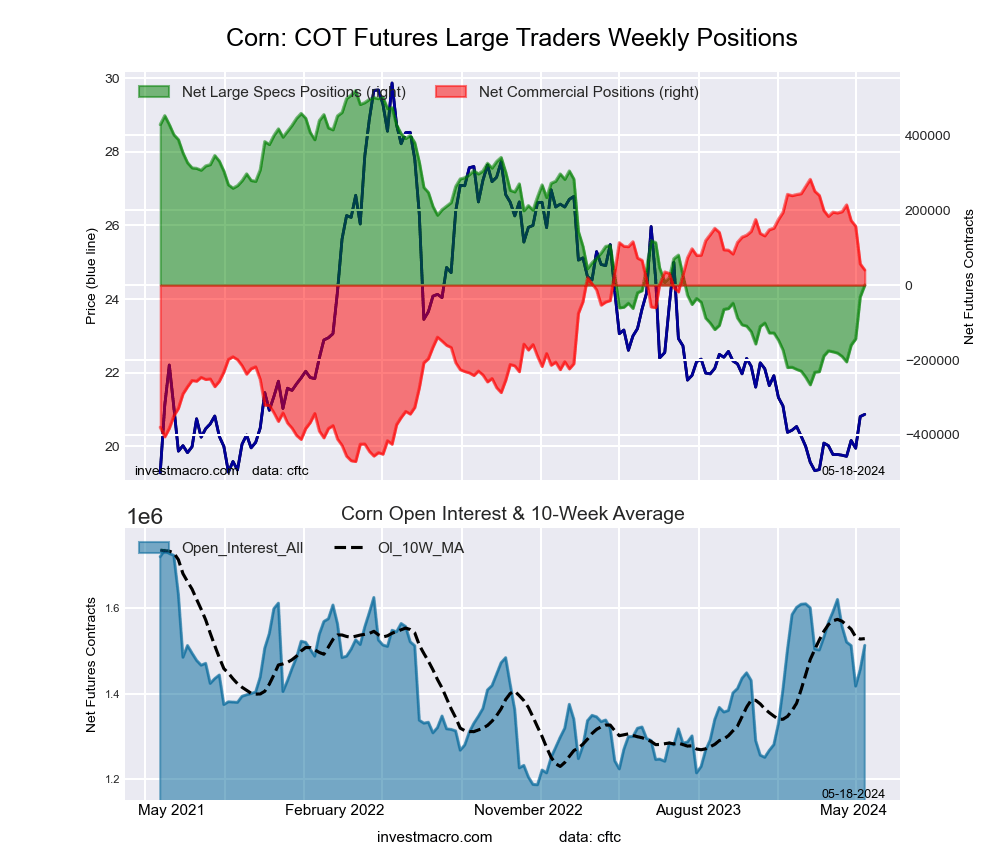 The CORN large speculator standing this week resulted in a net position of 224 contracts in the data reported through Tuesday. This was a weekly lift of 31,578 contracts from the previous week which had a total of -31,354 net contracts.
This week’s current strength score (the trader positioning range over the past three years, measured from 0 to 100) shows the speculators are currently Bearish with a score of 33.9 percent. The commercials are Bullish with a score of 67.9 percent and the small traders (not shown in chart) are Bullish with a score of 53.7 percent.
Price Trend-Following Model: Weak Downtrend
Our weekly trend-following model classifies the current market price position as: Weak Downtrend. The current action for the model is considered to be: Hold – Maintain Short Position.
| CORN Futures Statistics | SPECULATORS | COMMERCIALS | SMALL TRADERS |
| – Percent of Open Interest Longs: | 22.3 | 41.8 | 9.1 |
| – Percent of Open Interest Shorts: | 22.3 | 39.1 | 11.8 |
| – Net Position: | 224 | 40,405 | -40,629 |
| – Gross Longs: | 337,217 | 632,478 | 138,445 |
| – Gross Shorts: | 336,993 | 592,073 | 179,074 |
| – Long to Short Ratio: | 1.0 to 1 | 1.1 to 1 | 0.8 to 1 |
| NET POSITION TREND: | | | |
| – Strength Index Score (3 Year Range Pct): | 33.9 | 67.9 | 53.7 |
| – Strength Index Reading (3 Year Range): | Bearish | Bullish | Bullish |
| NET POSITION MOVEMENT INDEX: | | | |
| – 6-Week Change in Strength Index: | 23.1 | -20.2 | -38.9 |
SUGAR Futures:
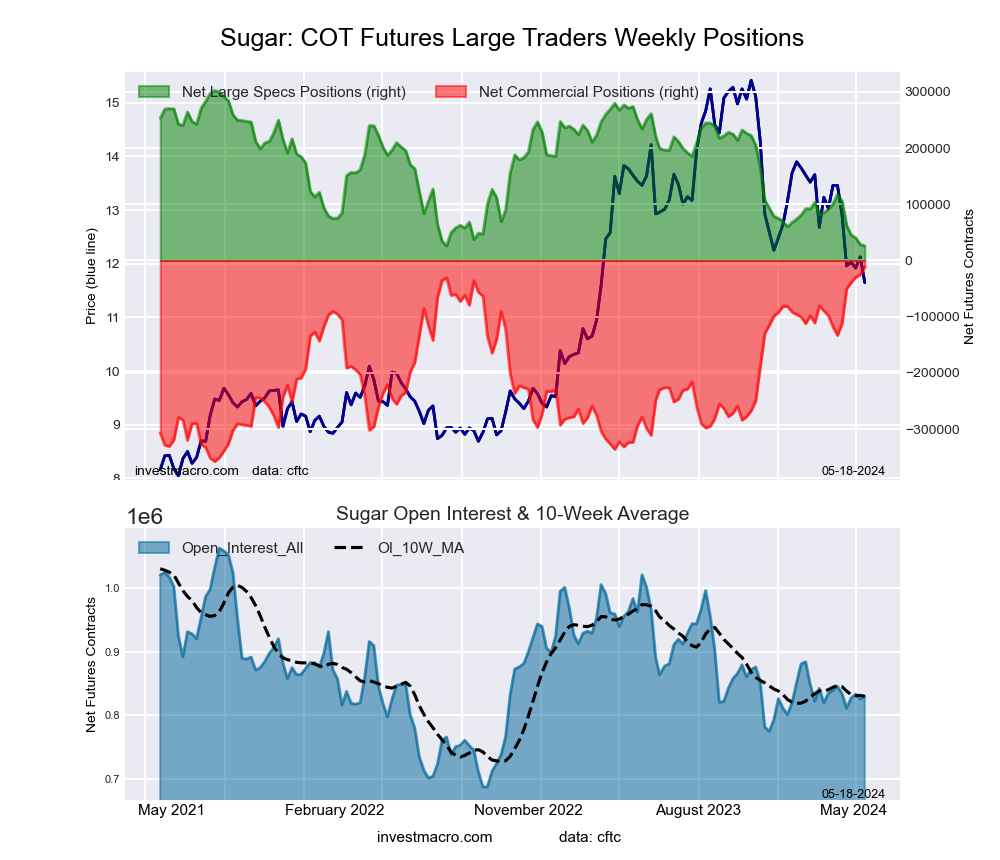 The SUGAR large speculator standing this week resulted in a net position of 25,891 contracts in the data reported through Tuesday. This was a weekly reduction of -2,670 contracts from the previous week which had a total of 28,561 net contracts.
This week’s current strength score (the trader positioning range over the past three years, measured from 0 to 100) shows the speculators are currently Bearish-Extreme with a score of 0.0 percent. The commercials are Bullish-Extreme with a score of 100.0 percent and the small traders (not shown in chart) are Bearish-Extreme with a score of 0.0 percent.
Price Trend-Following Model: Strong Downtrend
Our weekly trend-following model classifies the current market price position as: Strong Downtrend. The current action for the model is considered to be: Hold – Maintain Short Position.
| SUGAR Futures Statistics | SPECULATORS | COMMERCIALS | SMALL TRADERS |
| – Percent of Open Interest Longs: | 25.3 | 53.0 | 7.3 |
| – Percent of Open Interest Shorts: | 22.2 | 54.4 | 9.0 |
| – Net Position: | 25,891 | -11,459 | -14,432 |
| – Gross Longs: | 209,791 | 439,623 | 60,523 |
| – Gross Shorts: | 183,900 | 451,082 | 74,955 |
| – Long to Short Ratio: | 1.1 to 1 | 1.0 to 1 | 0.8 to 1 |
| NET POSITION TREND: | | | |
| – Strength Index Score (3 Year Range Pct): | 0.0 | 100.0 | 0.0 |
| – Strength Index Reading (3 Year Range): | Bearish-Extreme | Bullish-Extreme | Bearish-Extreme |
| NET POSITION MOVEMENT INDEX: | | | |
| – 6-Week Change in Strength Index: | -33.1 | 35.1 | -39.4 |
COFFEE Futures:
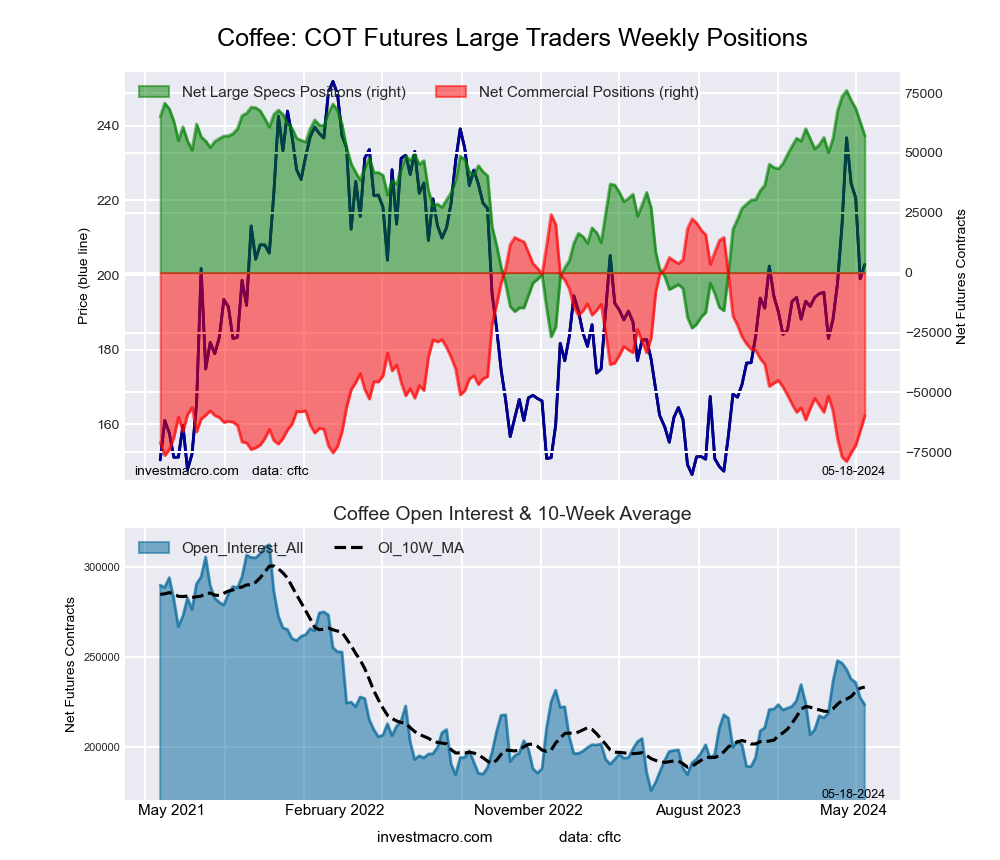 The COFFEE large speculator standing this week resulted in a net position of 57,211 contracts in the data reported through Tuesday. This was a weekly lowering of -5,666 contracts from the previous week which had a total of 62,877 net contracts.
This week’s current strength score (the trader positioning range over the past three years, measured from 0 to 100) shows the speculators are currently Bullish-Extreme with a score of 81.7 percent. The commercials are Bearish-Extreme with a score of 18.6 percent and the small traders (not shown in chart) are Bullish with a score of 51.5 percent.
Price Trend-Following Model: Uptrend
Our weekly trend-following model classifies the current market price position as: Uptrend. The current action for the model is considered to be: Hold – Maintain Long Position.
| COFFEE Futures Statistics | SPECULATORS | COMMERCIALS | SMALL TRADERS |
| – Percent of Open Interest Longs: | 34.6 | 36.3 | 4.1 |
| – Percent of Open Interest Shorts: | 9.0 | 63.0 | 3.0 |
| – Net Position: | 57,211 | -59,694 | 2,483 |
| – Gross Longs: | 77,228 | 81,022 | 9,092 |
| – Gross Shorts: | 20,017 | 140,716 | 6,609 |
| – Long to Short Ratio: | 3.9 to 1 | 0.6 to 1 | 1.4 to 1 |
| NET POSITION TREND: | | | |
| – Strength Index Score (3 Year Range Pct): | 81.7 | 18.6 | 51.5 |
| – Strength Index Reading (3 Year Range): | Bullish-Extreme | Bearish-Extreme | Bullish |
| NET POSITION MOVEMENT INDEX: | | | |
| – 6-Week Change in Strength Index: | -10.0 | 9.4 | 8.3 |
SOYBEANS Futures:
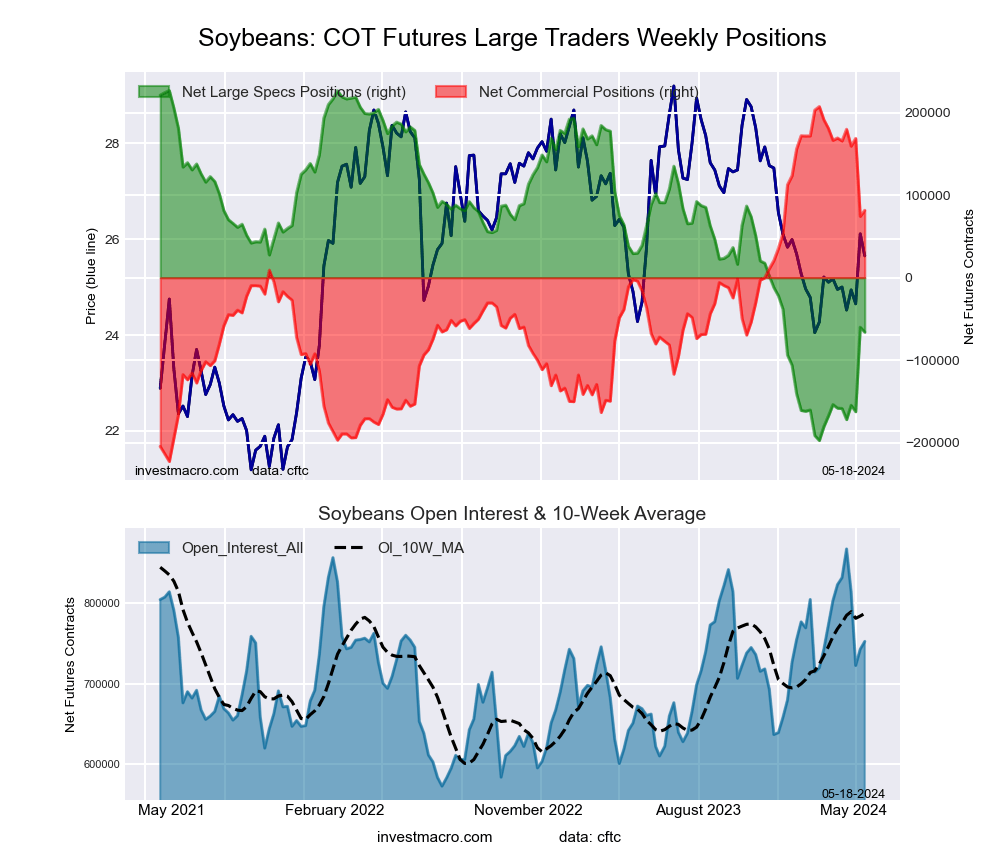 The SOYBEANS large speculator standing this week resulted in a net position of -65,975 contracts in the data reported through Tuesday. This was a weekly reduction of -5,927 contracts from the previous week which had a total of -60,048 net contracts.
This week’s current strength score (the trader positioning range over the past three years, measured from 0 to 100) shows the speculators are currently Bearish with a score of 31.0 percent. The commercials are Bullish with a score of 70.8 percent and the small traders (not shown in chart) are Bullish with a score of 70.4 percent.
Price Trend-Following Model: Weak Downtrend
Our weekly trend-following model classifies the current market price position as: Weak Downtrend. The current action for the model is considered to be: Hold – Maintain Short Position.
| SOYBEANS Futures Statistics | SPECULATORS | COMMERCIALS | SMALL TRADERS |
| – Percent of Open Interest Longs: | 14.9 | 59.3 | 7.3 |
| – Percent of Open Interest Shorts: | 23.7 | 48.5 | 9.3 |
| – Net Position: | -65,975 | 81,604 | -15,629 |
| – Gross Longs: | 112,139 | 446,696 | 54,657 |
| – Gross Shorts: | 178,114 | 365,092 | 70,286 |
| – Long to Short Ratio: | 0.6 to 1 | 1.2 to 1 | 0.8 to 1 |
| NET POSITION TREND: | | | |
| – Strength Index Score (3 Year Range Pct): | 31.0 | 70.8 | 70.4 |
| – Strength Index Reading (3 Year Range): | Bearish | Bullish | Bullish |
| NET POSITION MOVEMENT INDEX: | | | |
| – 6-Week Change in Strength Index: | 21.7 | -20.4 | -11.6 |
SOYBEAN OIL Futures:
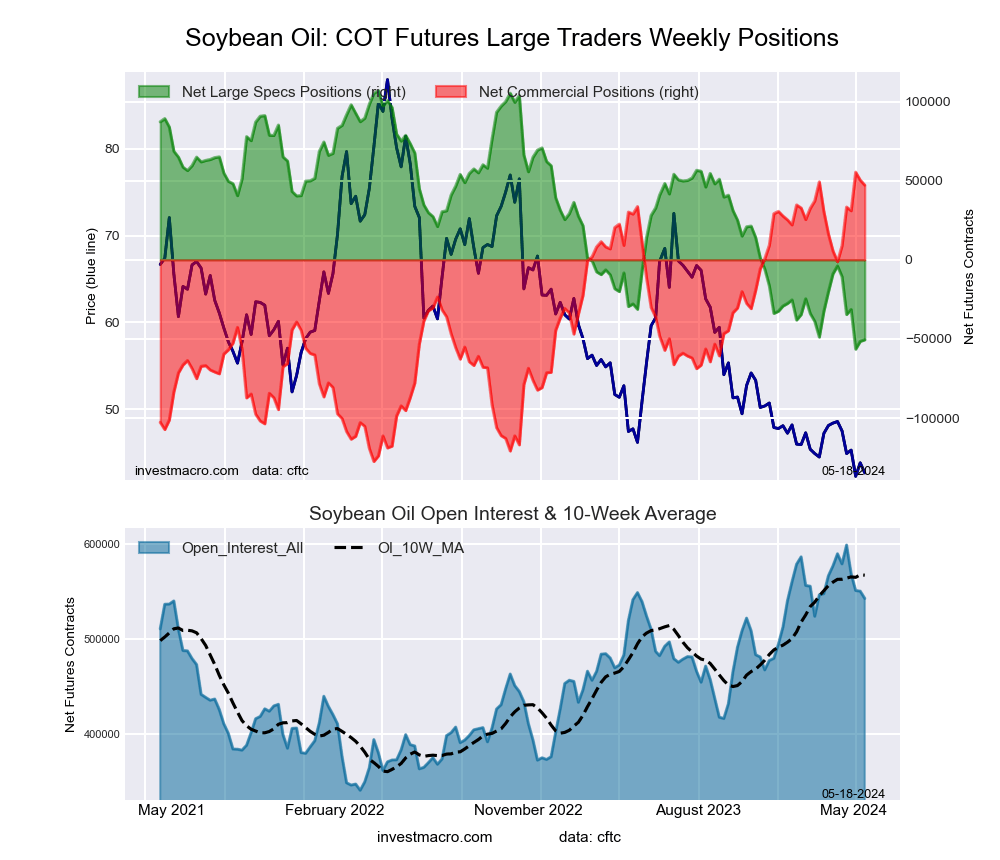 The SOYBEAN OIL large speculator standing this week resulted in a net position of -50,532 contracts in the data reported through Tuesday. This was a weekly gain of 1,021 contracts from the previous week which had a total of -51,553 net contracts.
This week’s current strength score (the trader positioning range over the past three years, measured from 0 to 100) shows the speculators are currently Bearish-Extreme with a score of 3.6 percent. The commercials are Bullish-Extreme with a score of 95.5 percent and the small traders (not shown in chart) are Bearish with a score of 27.1 percent.
Price Trend-Following Model: Strong Downtrend
Our weekly trend-following model classifies the current market price position as: Strong Downtrend. The current action for the model is considered to be: Hold – Maintain Short Position.
| SOYBEAN OIL Futures Statistics | SPECULATORS | COMMERCIALS | SMALL TRADERS |
| – Percent of Open Interest Longs: | 20.1 | 53.2 | 5.9 |
| – Percent of Open Interest Shorts: | 29.5 | 44.5 | 5.2 |
| – Net Position: | -50,532 | 47,181 | 3,351 |
| – Gross Longs: | 109,303 | 288,450 | 31,814 |
| – Gross Shorts: | 159,835 | 241,269 | 28,463 |
| – Long to Short Ratio: | 0.7 to 1 | 1.2 to 1 | 1.1 to 1 |
| NET POSITION TREND: | | | |
| – Strength Index Score (3 Year Range Pct): | 3.6 | 95.5 | 27.1 |
| – Strength Index Reading (3 Year Range): | Bearish-Extreme | Bullish-Extreme | Bearish |
| NET POSITION MOVEMENT INDEX: | | | |
| – 6-Week Change in Strength Index: | -28.6 | 26.5 | -6.8 |
SOYBEAN MEAL Futures:
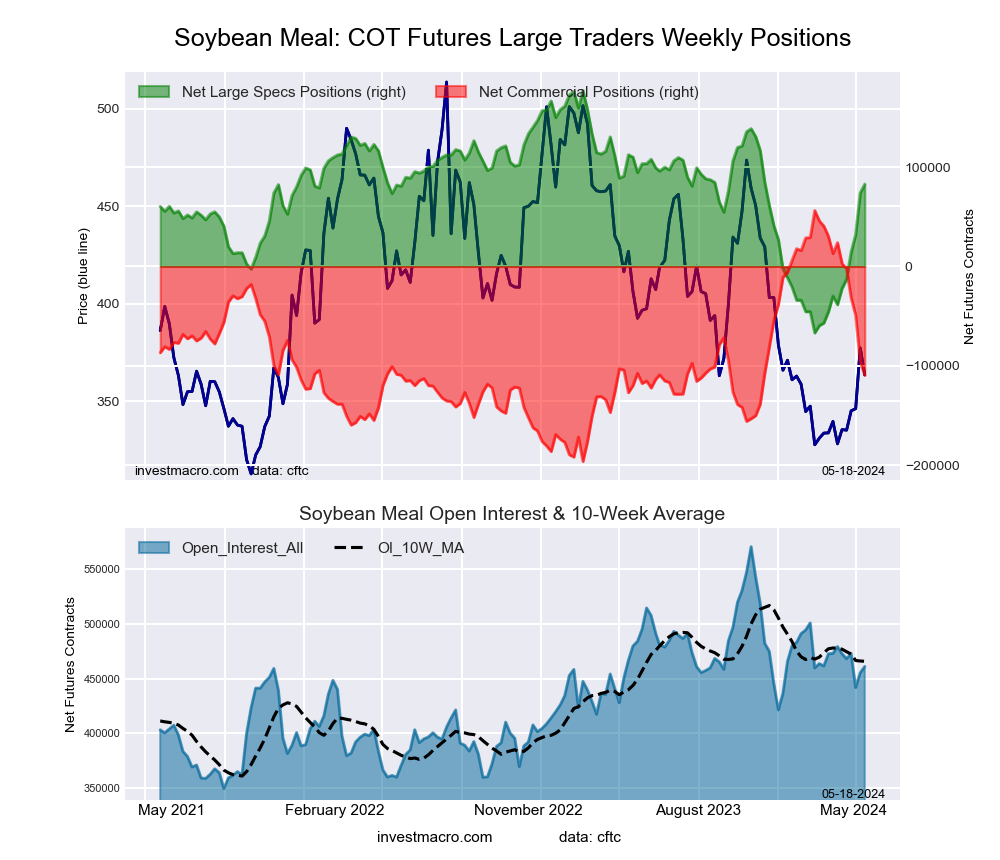 The SOYBEAN MEAL large speculator standing this week resulted in a net position of 82,785 contracts in the data reported through Tuesday. This was a weekly increase of 8,815 contracts from the previous week which had a total of 73,970 net contracts.
This week’s current strength score (the trader positioning range over the past three years, measured from 0 to 100) shows the speculators are currently Bullish with a score of 61.4 percent. The commercials are Bearish with a score of 34.4 percent and the small traders (not shown in chart) are Bullish with a score of 75.4 percent.
Price Trend-Following Model: Weak Downtrend
Our weekly trend-following model classifies the current market price position as: Weak Downtrend. The current action for the model is considered to be: Hold – Maintain Short Position.
| SOYBEAN MEAL Futures Statistics | SPECULATORS | COMMERCIALS | SMALL TRADERS |
| – Percent of Open Interest Longs: | 32.7 | 38.4 | 11.1 |
| – Percent of Open Interest Shorts: | 14.7 | 62.1 | 5.3 |
| – Net Position: | 82,785 | -109,370 | 26,585 |
| – Gross Longs: | 150,611 | 176,885 | 50,993 |
| – Gross Shorts: | 67,826 | 286,255 | 24,408 |
| – Long to Short Ratio: | 2.2 to 1 | 0.6 to 1 | 2.1 to 1 |
| NET POSITION TREND: | | | |
| – Strength Index Score (3 Year Range Pct): | 61.4 | 34.4 | 75.4 |
| – Strength Index Reading (3 Year Range): | Bullish | Bearish | Bullish |
| NET POSITION MOVEMENT INDEX: | | | |
| – 6-Week Change in Strength Index: | 49.7 | -52.8 | 54.6 |
LIVE CATTLE Futures:
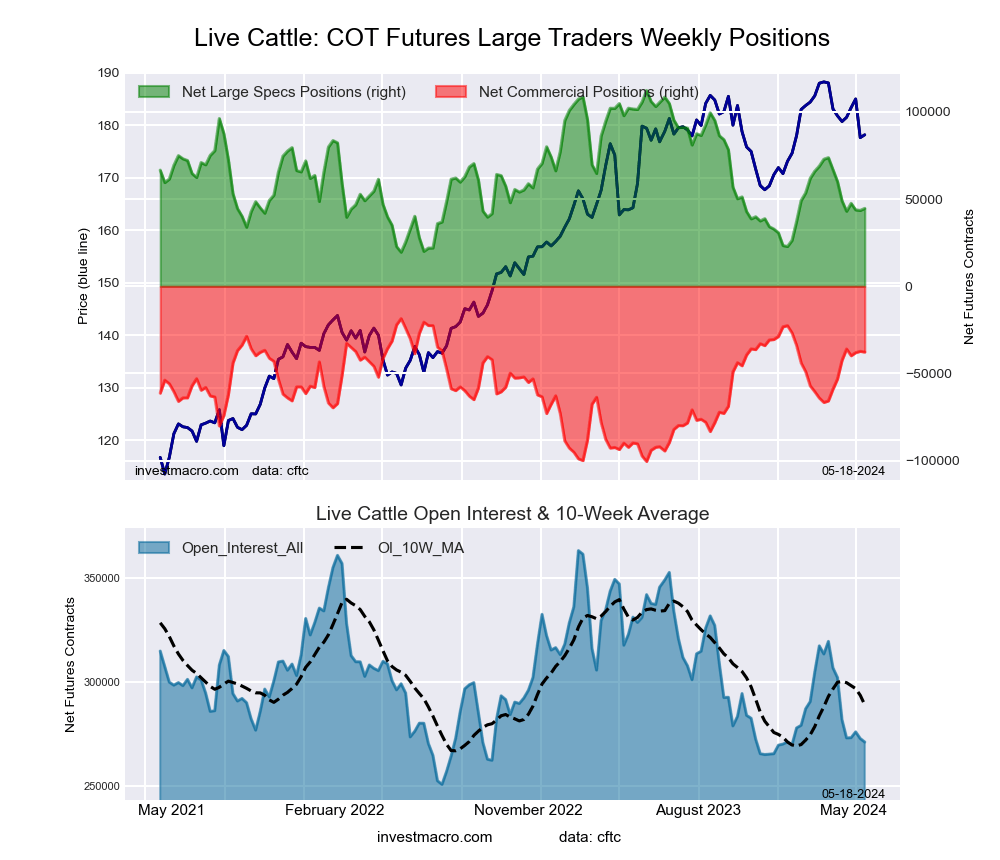 The LIVE CATTLE large speculator standing this week resulted in a net position of 44,659 contracts in the data reported through Tuesday. This was a weekly advance of 1,184 contracts from the previous week which had a total of 43,475 net contracts.
This week’s current strength score (the trader positioning range over the past three years, measured from 0 to 100) shows the speculators are currently Bearish with a score of 27.1 percent. The commercials are Bullish with a score of 76.6 percent and the small traders (not shown in chart) are Bullish with a score of 52.9 percent.
Price Trend-Following Model: Weak Uptrend
Our weekly trend-following model classifies the current market price position as: Weak Uptrend. The current action for the model is considered to be: Hold – Maintain Long Position.
| LIVE CATTLE Futures Statistics | SPECULATORS | COMMERCIALS | SMALL TRADERS |
| – Percent of Open Interest Longs: | 36.9 | 35.0 | 10.1 |
| – Percent of Open Interest Shorts: | 20.4 | 48.9 | 12.6 |
| – Net Position: | 44,659 | -37,742 | -6,917 |
| – Gross Longs: | 100,002 | 94,857 | 27,263 |
| – Gross Shorts: | 55,343 | 132,599 | 34,180 |
| – Long to Short Ratio: | 1.8 to 1 | 0.7 to 1 | 0.8 to 1 |
| NET POSITION TREND: | | | |
| – Strength Index Score (3 Year Range Pct): | 27.1 | 76.6 | 52.9 |
| – Strength Index Reading (3 Year Range): | Bearish | Bullish | Bullish |
| NET POSITION MOVEMENT INDEX: | | | |
| – 6-Week Change in Strength Index: | -16.6 | 18.9 | -0.4 |
LEAN HOGS Futures:
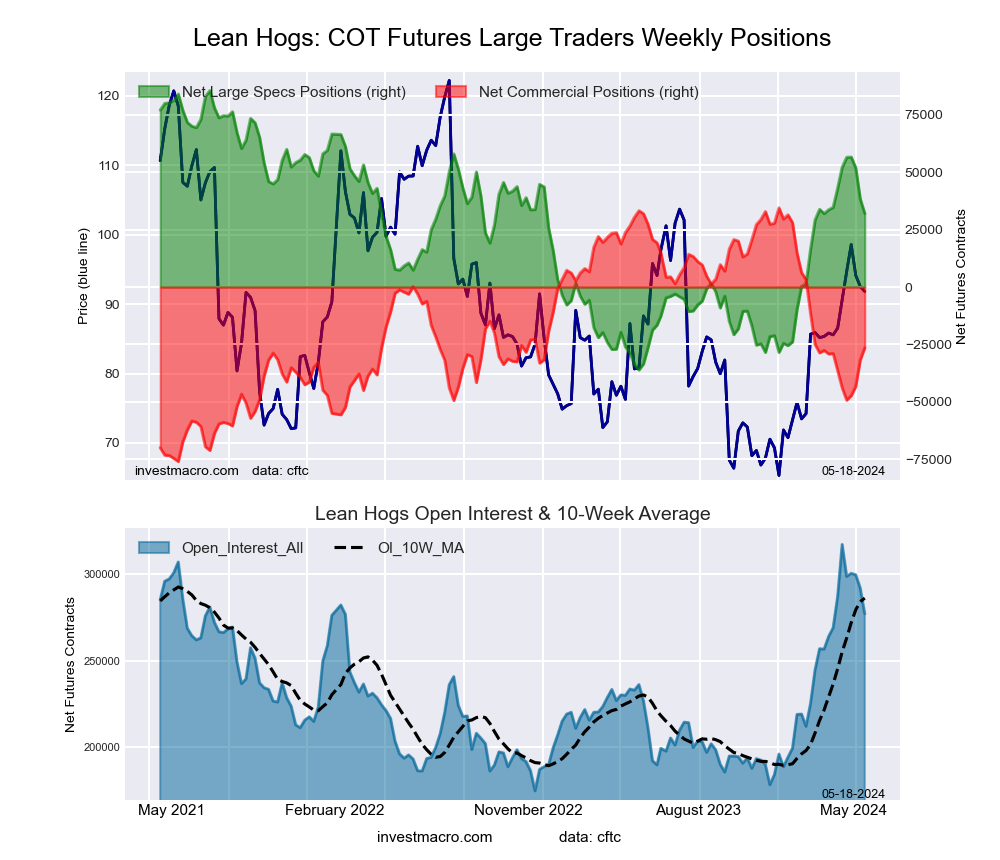 The LEAN HOGS large speculator standing this week resulted in a net position of 32,041 contracts in the data reported through Tuesday. This was a weekly reduction of -6,315 contracts from the previous week which had a total of 38,356 net contracts.
This week’s current strength score (the trader positioning range over the past three years, measured from 0 to 100) shows the speculators are currently Bullish with a score of 56.0 percent. The commercials are Bearish with a score of 44.8 percent and the small traders (not shown in chart) are Bullish with a score of 58.3 percent.
Price Trend-Following Model: Strong Uptrend
Our weekly trend-following model classifies the current market price position as: Strong Uptrend. The current action for the model is considered to be: Hold – Maintain Long Position.
| LEAN HOGS Futures Statistics | SPECULATORS | COMMERCIALS | SMALL TRADERS |
| – Percent of Open Interest Longs: | 33.7 | 36.5 | 7.8 |
| – Percent of Open Interest Shorts: | 22.1 | 46.0 | 9.8 |
| – Net Position: | 32,041 | -26,444 | -5,597 |
| – Gross Longs: | 93,393 | 101,191 | 21,492 |
| – Gross Shorts: | 61,352 | 127,635 | 27,089 |
| – Long to Short Ratio: | 1.5 to 1 | 0.8 to 1 | 0.8 to 1 |
| NET POSITION TREND: | | | |
| – Strength Index Score (3 Year Range Pct): | 56.0 | 44.8 | 58.3 |
| – Strength Index Reading (3 Year Range): | Bullish | Bearish | Bullish |
| NET POSITION MOVEMENT INDEX: | | | |
| – 6-Week Change in Strength Index: | -9.1 | 9.0 | 5.3 |
COTTON Futures:
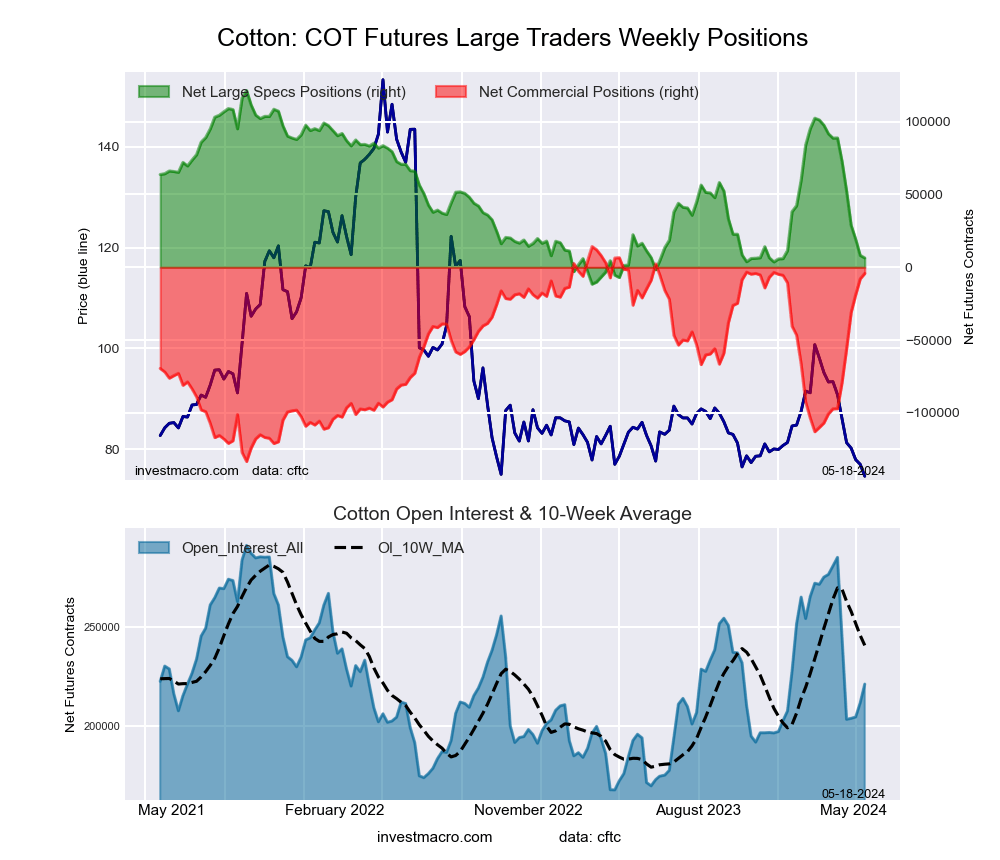 The COTTON large speculator standing this week resulted in a net position of 6,399 contracts in the data reported through Tuesday. This was a weekly reduction of -1,737 contracts from the previous week which had a total of 8,136 net contracts.
This week’s current strength score (the trader positioning range over the past three years, measured from 0 to 100) shows the speculators are currently Bearish-Extreme with a score of 13.5 percent. The commercials are Bullish-Extreme with a score of 87.5 percent and the small traders (not shown in chart) are Bearish-Extreme with a score of 3.0 percent.
Price Trend-Following Model: Strong Downtrend
Our weekly trend-following model classifies the current market price position as: Strong Downtrend. The current action for the model is considered to be: Hold – Maintain Short Position.
| COTTON Futures Statistics | SPECULATORS | COMMERCIALS | SMALL TRADERS |
| – Percent of Open Interest Longs: | 30.8 | 44.0 | 5.7 |
| – Percent of Open Interest Shorts: | 27.9 | 45.9 | 6.7 |
| – Net Position: | 6,399 | -4,249 | -2,150 |
| – Gross Longs: | 68,159 | 97,259 | 12,682 |
| – Gross Shorts: | 61,760 | 101,508 | 14,832 |
| – Long to Short Ratio: | 1.1 to 1 | 1.0 to 1 | 0.9 to 1 |
| NET POSITION TREND: | | | |
| – Strength Index Score (3 Year Range Pct): | 13.5 | 87.5 | 3.0 |
| – Strength Index Reading (3 Year Range): | Bearish-Extreme | Bullish-Extreme | Bearish-Extreme |
| NET POSITION MOVEMENT INDEX: | | | |
| – 6-Week Change in Strength Index: | -62.0 | 62.9 | -63.3 |
COCOA Futures:
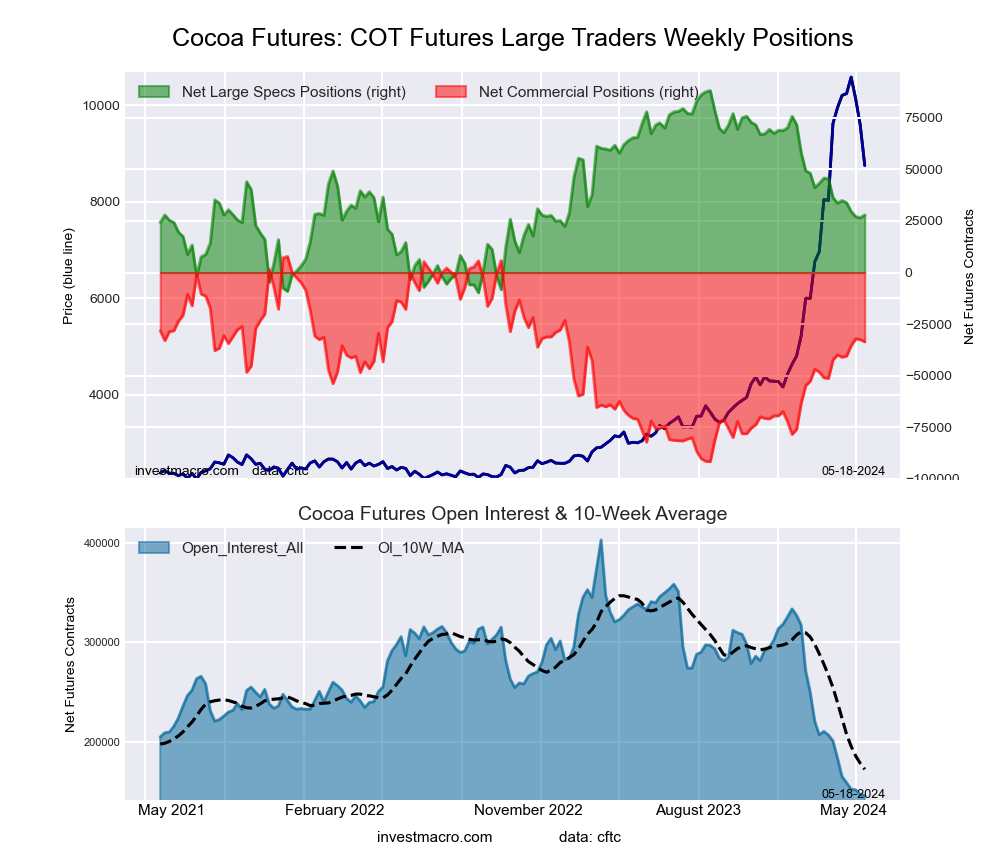 The COCOA large speculator standing this week resulted in a net position of 27,958 contracts in the data reported through Tuesday. This was a weekly advance of 1,396 contracts from the previous week which had a total of 26,562 net contracts.
This week’s current strength score (the trader positioning range over the past three years, measured from 0 to 100) shows the speculators are currently Bearish with a score of 38.5 percent. The commercials are Bullish with a score of 58.4 percent and the small traders (not shown in chart) are Bullish with a score of 60.0 percent.
Price Trend-Following Model: Weak Uptrend
Our weekly trend-following model classifies the current market price position as: Weak Uptrend. The current action for the model is considered to be: Hold – Maintain Long Position.
| COCOA Futures Statistics | SPECULATORS | COMMERCIALS | SMALL TRADERS |
| – Percent of Open Interest Longs: | 31.0 | 35.7 | 7.5 |
| – Percent of Open Interest Shorts: | 11.9 | 58.6 | 3.6 |
| – Net Position: | 27,958 | -33,568 | 5,610 |
| – Gross Longs: | 45,316 | 52,231 | 10,914 |
| – Gross Shorts: | 17,358 | 85,799 | 5,304 |
| – Long to Short Ratio: | 2.6 to 1 | 0.6 to 1 | 2.1 to 1 |
| NET POSITION TREND: | | | |
| – Strength Index Score (3 Year Range Pct): | 38.5 | 58.4 | 60.0 |
| – Strength Index Reading (3 Year Range): | Bearish | Bullish | Bullish |
| NET POSITION MOVEMENT INDEX: | | | |
| – 6-Week Change in Strength Index: | -5.8 | 6.4 | -5.3 |
WHEAT Futures:
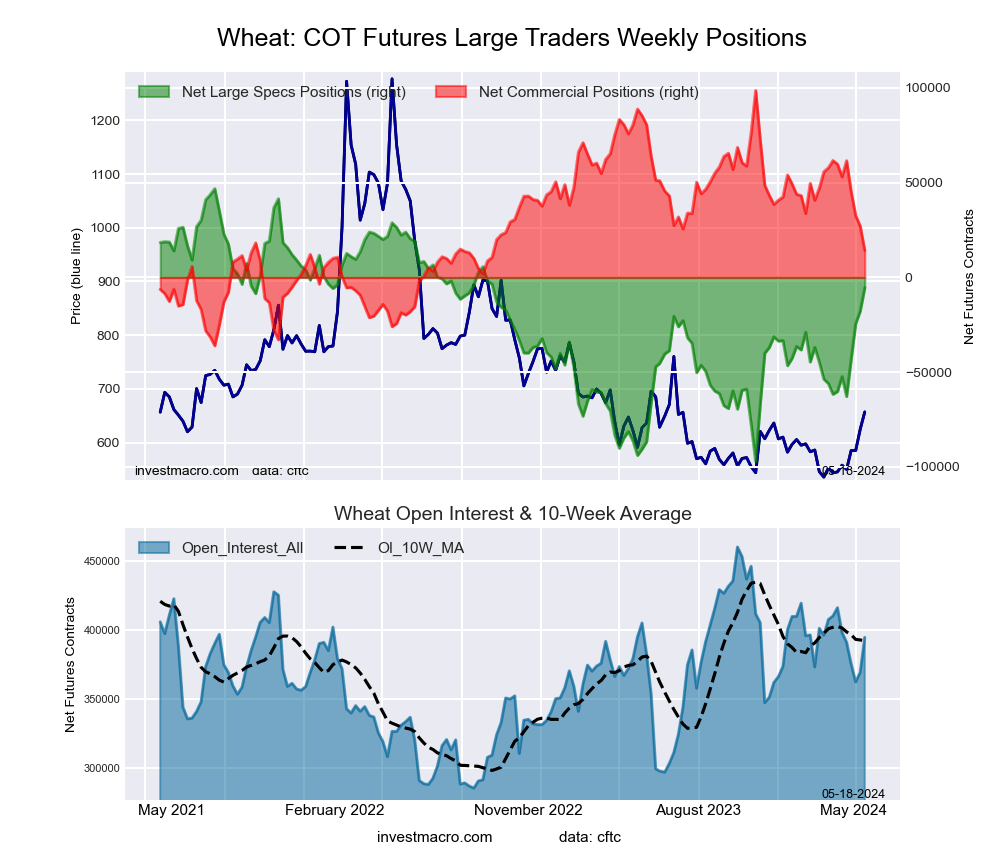 The WHEAT large speculator standing this week resulted in a net position of -5,415 contracts in the data reported through Tuesday. This was a weekly advance of 12,370 contracts from the previous week which had a total of -17,785 net contracts.
This week’s current strength score (the trader positioning range over the past three years, measured from 0 to 100) shows the speculators are currently Bullish with a score of 63.7 percent. The commercials are Bearish with a score of 37.3 percent and the small traders (not shown in chart) are Bearish with a score of 28.1 percent.
Price Trend-Following Model: Strong Uptrend
Our weekly trend-following model classifies the current market price position as: Strong Uptrend. The current action for the model is considered to be: New Buy – Long Position.
| WHEAT Futures Statistics | SPECULATORS | COMMERCIALS | SMALL TRADERS |
| – Percent of Open Interest Longs: | 33.6 | 35.8 | 7.1 |
| – Percent of Open Interest Shorts: | 34.9 | 32.2 | 9.3 |
| – Net Position: | -5,415 | 14,159 | -8,744 |
| – Gross Longs: | 132,484 | 141,475 | 28,160 |
| – Gross Shorts: | 137,899 | 127,316 | 36,904 |
| – Long to Short Ratio: | 1.0 to 1 | 1.1 to 1 | 0.8 to 1 |
| NET POSITION TREND: | | | |
| – Strength Index Score (3 Year Range Pct): | 63.7 | 37.3 | 28.1 |
| – Strength Index Reading (3 Year Range): | Bullish | Bearish | Bearish |
| NET POSITION MOVEMENT INDEX: | | | |
| – 6-Week Change in Strength Index: | 38.1 | -33.8 | -40.1 |
Article By InvestMacro – Receive our weekly COT Newsletter
*COT Report: The COT data, released weekly to the public each Friday, is updated through the most recent Tuesday (data is 3 days old) and shows a quick view of how large speculators or non-commercials (for-profit traders) were positioned in the futures markets.
The CFTC categorizes trader positions according to commercial hedgers (traders who use futures contracts for hedging as part of the business), non-commercials (large traders who speculate to realize trading profits) and nonreportable traders (usually small traders/speculators) as well as their open interest (contracts open in the market at time of reporting). See CFTC criteria here.