
By RoboForex Analytical Department
On Monday, a troy ounce of gold set a new price peak of 3438.00 USD. This surge was fuelled by renewed speculation about potential interest rate cuts by the US Federal Reserve, vigorous gold purchases by banks globally, and strong investor demand for safe-haven assets.
Recent statistics indicating a slowdown in consumer inflation in the US and a decline in retail sales have given the Fed more flexibility for potential ease of monetary policy this year. Although the Fed’s official stance has not changed, investors are already speculating on a rate cut. A lower interest rate would enhance the appeal of non-interest-bearing assets such as gold.
Additionally, escalating geopolitical tensions in the Middle East contribute to the rise in gold prices. Furthermore, global central banks, including China, continue to buy gold to diversify their reserves and reduce dependency on the US dollar.
XAU/USD technical analysis
Free Reports:
 Download Our Metatrader 4 Indicators – Put Our Free MetaTrader 4 Custom Indicators on your charts when you join our Weekly Newsletter
 Get our Weekly Commitment of Traders Reports - See where the biggest traders (Hedge Funds and Commercial Hedgers) are positioned in the futures markets on a weekly basis.
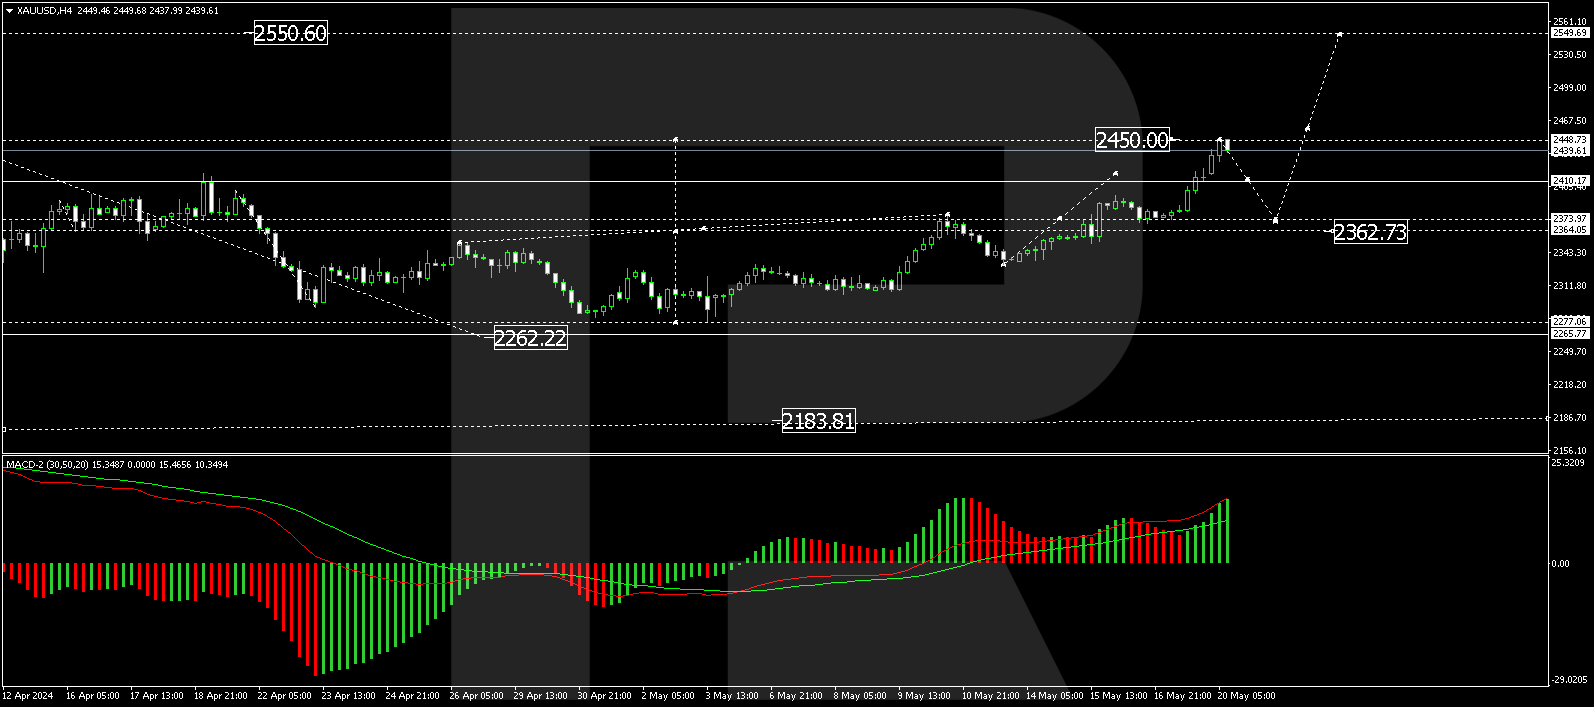
On the H4 chart of XAU/USD, a consolidation range has formed above the level of 2374.00, with the growth wave continuing towards 2550.00. The local target of 2450.00 has been achieved. Today, a corrective move to at least 2410.00 is expected. If this level breaks, the correction could extend to 2374.00. Following this correction, growth towards 2550.00 is anticipated. This bullish scenario is supported by the MACD indicator, with its signal line above zero and pointing upwards towards new highs.
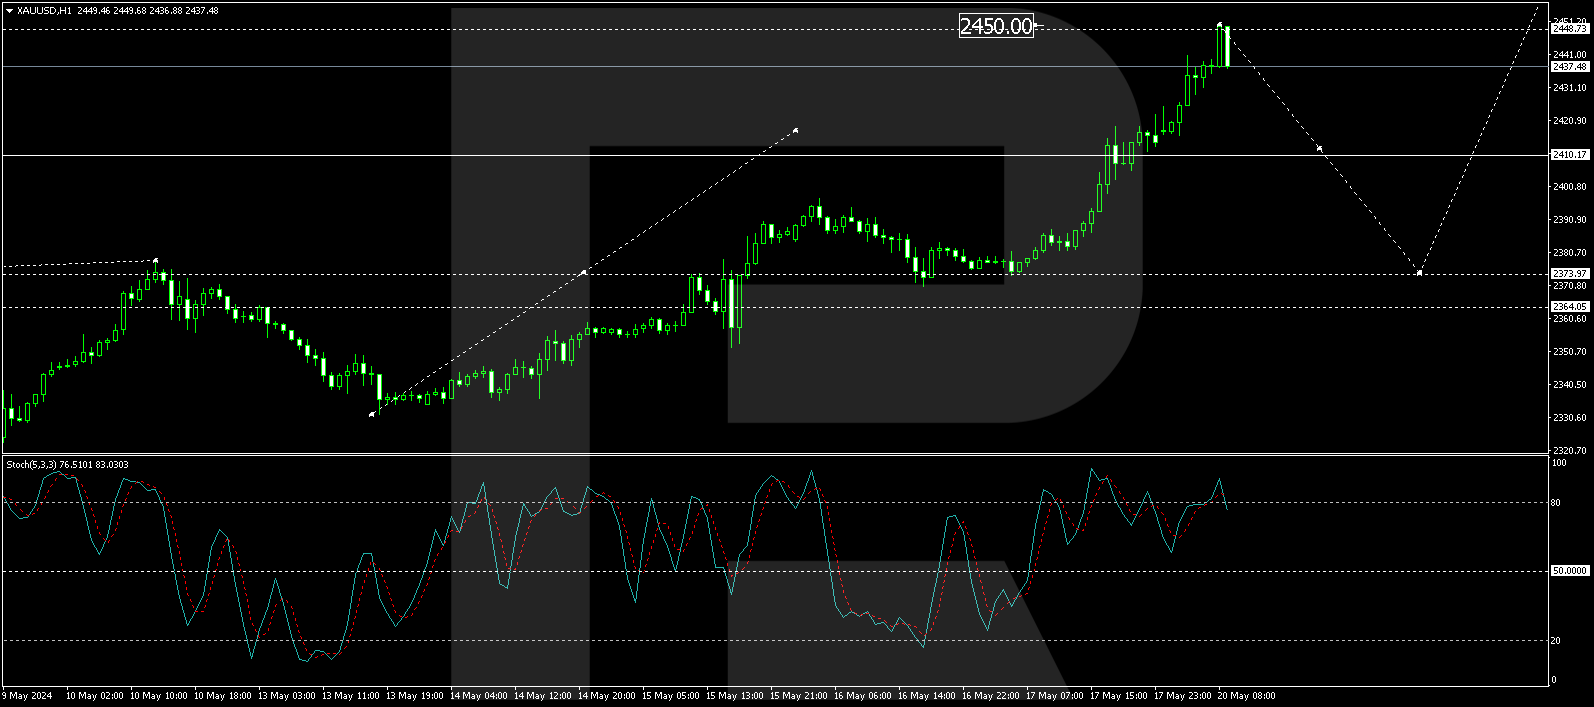
On the H1 chart, a growth wave to 2450.00 was completed. Today, a correction to 2410.00 (testing from above) is anticipated. After this correction, another growth wave to 2450.00 is expected, potentially extending to 2550.00. This scenario is technically supported by the Stochastic oscillator, with its signal line currently above 80 and expected to decline to 20 before resuming its upward trend.
Summary
Gold hits a new record high, driven by speculation about potential US interest rate cuts by the US Federal Reserve, strong demand from central banks, and increased geopolitical tensions in the Middle East. Technical analysis indicates short-term correction before continuing the upward trend towards higher targets. Investors should monitor these developments closely, as the market remains highly responsive to economic and geopolitical signals.
Disclaimer
Any forecasts contained herein are based on the author’s particular opinion. This analysis may not be treated as trading advice. RoboForex bears no responsibility for trading results based on trading recommendations and reviews contained herein.

- COT Metals Charts: Weekly Speculator Bets led by Copper & Steel Jul 18, 2026
- COT Bonds Charts: Weekly Speculator Bets led by 2-Year, SOFR 3M & 5-Year Bonds Jul 18, 2026
- COT Energy Charts: Weekly Speculator Bets led by Brent Oil & Heating Oil Jul 18, 2026
- COT Soft Commodities Charts: Weekly Speculator Bets led by Wheat, Corn & Soybean Meal Jul 18, 2026
- The Bank of Canada kept its interest rate unchanged. Platinum prices reached a three‑week high Jul 16, 2026
- Stock indices rose after the release of US inflation data. China’s GDP slowed sharply Jul 15, 2026
- GBP/USD Awaits Political News: What Will Happen Next Jul 15, 2026
- USD/JPY Holds at Highs: Pressure Lingers on Yen Jul 14, 2026
- Oil prices jumped 4% amid a new wave of escalation between the US and Iran Jul 13, 2026
- EUR/USD: US Inflation Will Determine Everything Jul 13, 2026
