By JustMarkets
The US stock indices closed lower on Thursday. At the end of the day, the Dow Jones Index (US30) was down 1.53% (the worst day in a year), while the S&P 500 Index (US500) lost 0.74%. The NASDAQ Technology Index (US100) closed negative 0.39%. Stock indices initially increased, with the S&P 500 (US500) and NASDAQ (US100) setting new record highs. But then the market began to sell off, sending the S&P 500 (US500) to a 1-week low and the Dow Jones (US30) to a 2-week low. The fall in the indices was mainly due to an acceleration in business activity, which reinforced the view of US officials that the Fed will conduct only one rate cut this year instead of the planned three. Markets are pricing in a 25 bps chance of a rate cut at 0% at the June 12 FOMC meeting and 10% at the next meeting on July 31.
The US weekly initial jobless claims fell by 800 to 215,000, indicating a strengthening labor market compared to expectations of 220,000. The S&P Manufacturing PMI for May unexpectedly rose by 0.9 to 50.9, stronger than expectations for a decline to 49.9.
Boeing (BA) closed down more than 7%, topping the Dow Jones Industrials’ list of losers, after CFO West said the company’s second-quarter cash burn would be the same or worse than the first quarter when the company spent nearly $4 billion to rebuild operations. Shares of Dell Technologies (DELL) are up more than 4% after Evercore ISI added it to its list of tactical outperformers with a $165 price target.
Equity markets in Europe were mostly flat yesterday. Germany’s DAX (DE40) rose by 0.06%, France’s CAC 40 (FR40) closed higher by 0.13%, Spain’s IBEX 35 (ES35) fell by 0.16%, and the UK’s FTSE 100 (UK100) closed negative 0.37%.
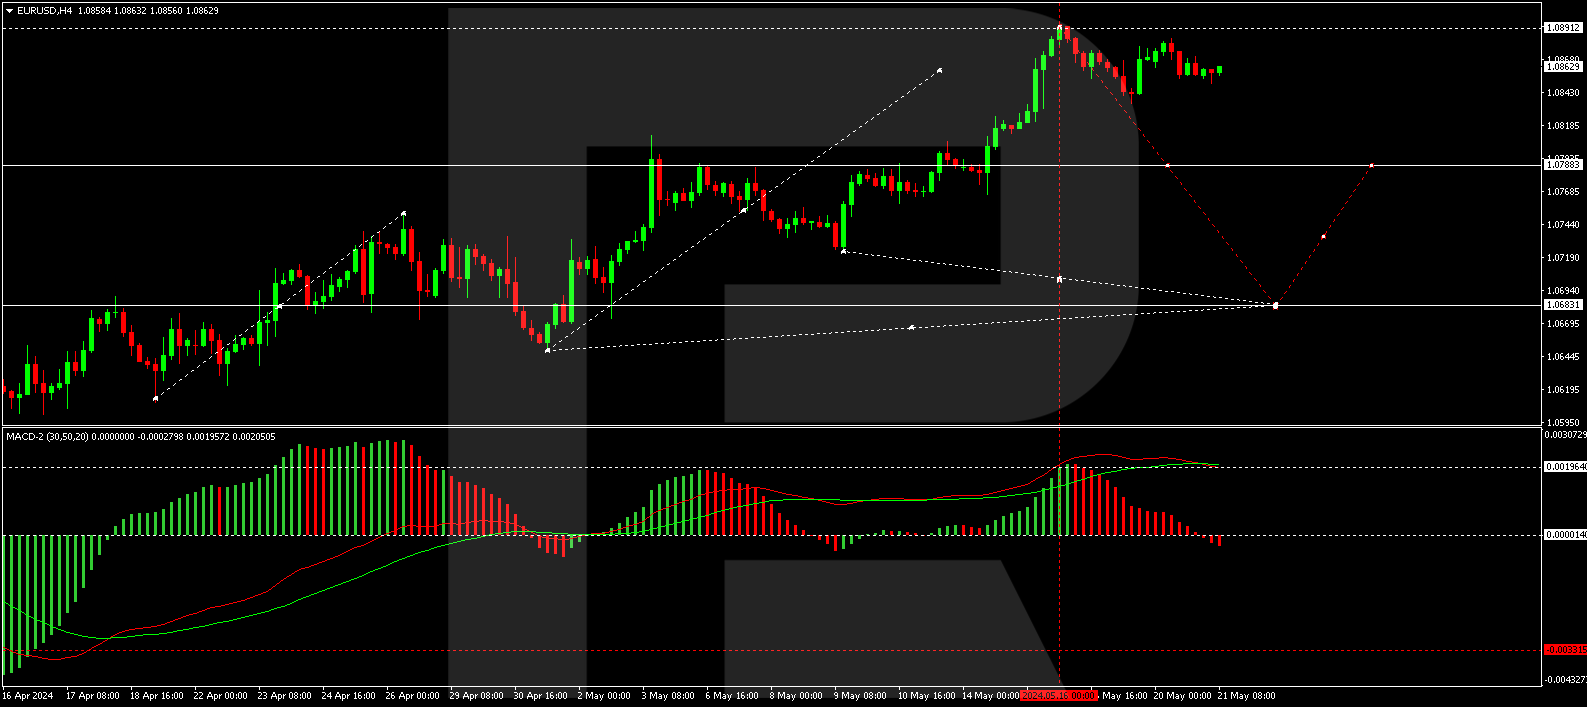
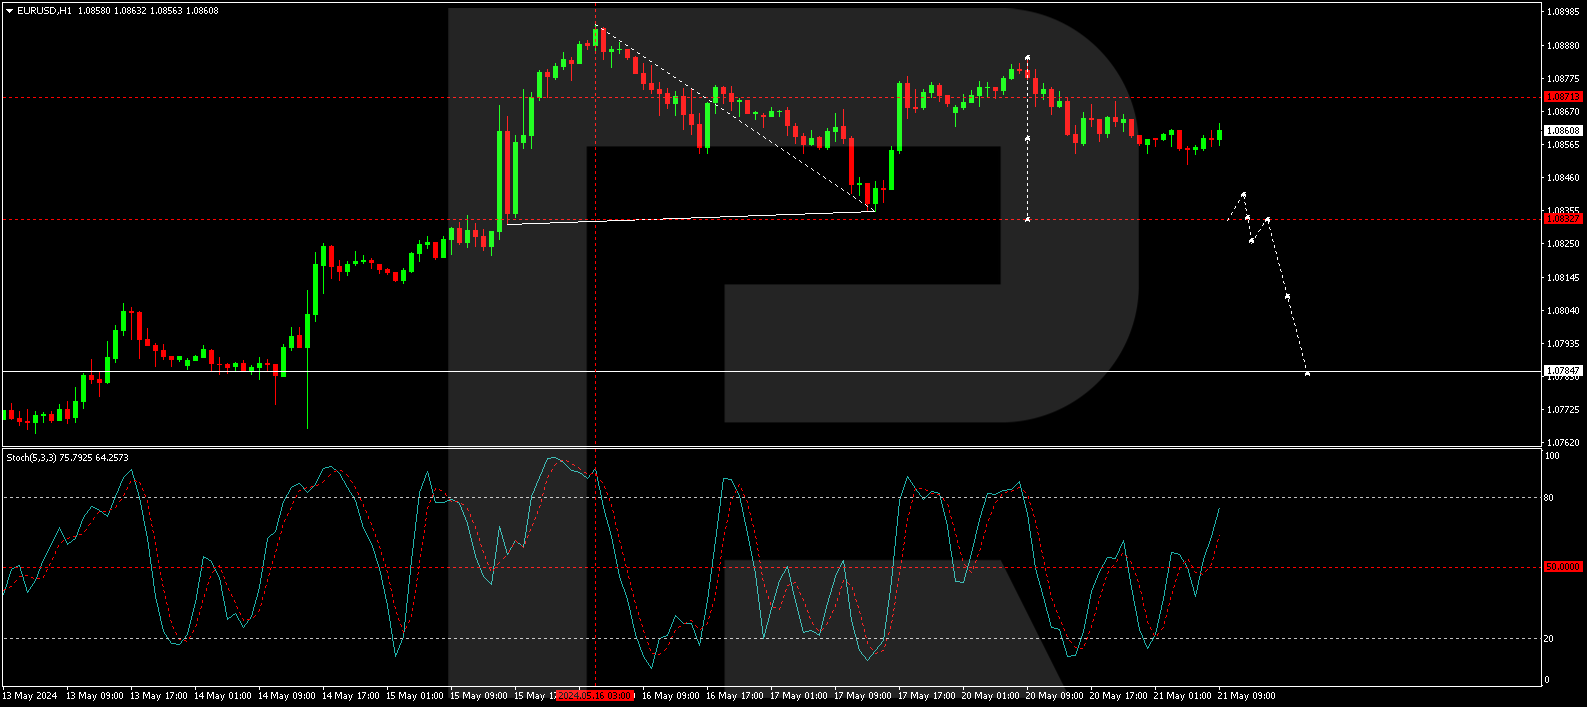
Yesterday, the ECB reported that Eurozone wages rose to 4.7% y/y in Q1 compared to 4.5% y/y in Q4, a record. The May S&P Eurozone Manufacturing PMI rose by 1.7 to a 15-month high of 47.4, beating expectations of 46.1. The May Services PMI rose by 0.6 to 52.3, beating expectations of 52.0 and the fastest pace of growth in a year. The latest data points to a recovery in the Eurozone economy.
GfK’s UK Consumer Confidence Indicator rose to 17 in May 2024 from 19 in April, the highest reading since December 2021 and better than prognoses of 18. Four of the survey’s five components measuring the state of the economy and personal finances improved in May, with only the index of large purchases showing a decline.
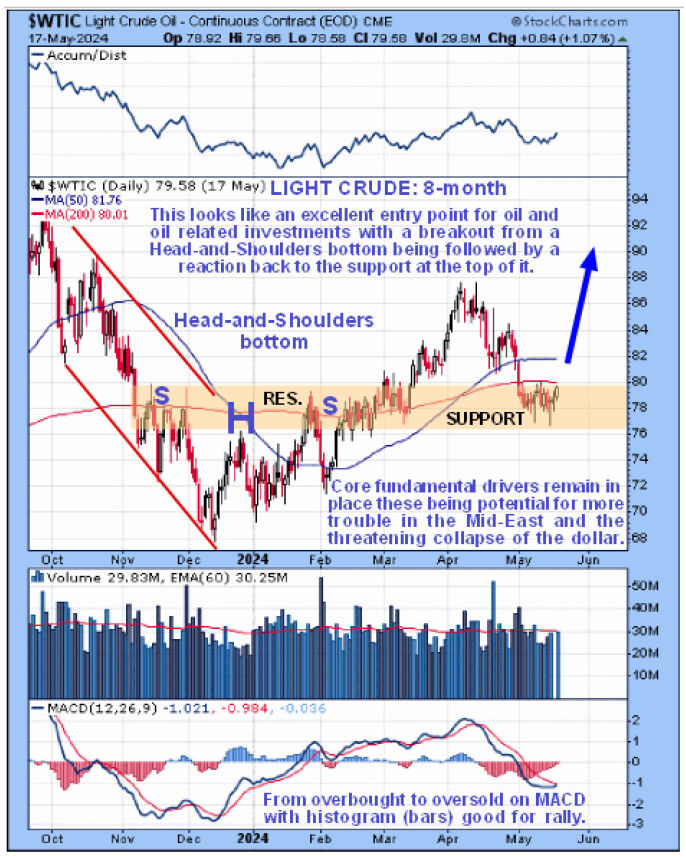
WTI crude oil prices stabilized near $77 per barrel on Friday, but this week’s losses are roughly 3% as stronger-than-expected US PMI data lowered bets on a Federal Reserve interest rate cut this year, dampening the outlook for the US economy and energy demand.
The US natural gas (XNG) prices fell more than 5% to below $2.7 on Thursday, slipping from a six-month peak due to higher daily production and rising storage inventories reported by the EIA. The US utilities added 78 billion cubic feet (bcf) of gas to storage last week, while the market had expected an increase of 84 bcf. The report also showed that gas inventories are 28.8% above the 5-year average.
Asian markets were mostly down on Thursday. Japan’s Nikkei 225 (JP225) was up 1.26%, China’s FTSE China A50 (CHA50) decreased by 0.78%, Hong Kong’s Hang Seng (HK50) lost 1.70% and Australia’s ASX 200 (AU200) was negative 0.46%.
A wave of negative sentiment hit China this week as the trade war with the US escalated. The People’s Liberation Army was also seen conducting military exercises near Taiwan, indicating heightened regional tensions. Hong Kong’s Hang Seng Index suffered huge losses due to a prolonged slump in heavy technology stocks. The index fell by 1.5% on Friday, adding to a 1.7% drop on Thursday. Shares of Alibaba Group (BABA) fell another 1% after falling 5.2% in the previous session after the company said it was issuing $5 billion in convertible bonds to spur growth. The tech giant’s losses drove down quotes of its peers Baidu Inc (BIDU) and Tencent Holdings Ltd, while investors booked profits in real estate stocks as they awaited more details on Beijing’s stimulus measures.
Japanese inflation fell for a second month but remained above the Bank of Japan’s (BoJ) target level. The yen’s recent depreciation raises concerns that cost-driven inflationary pressures could persist. Consumer prices excluding fresh food totaled 2.2% in April, down from a year ago. Despite the decline in inflation, economists note the risk of a rate hike soon as the yen remains near a 34-year low.
S&P 500 (US500) 5,267.84 −39.17 (−0.74%)
Dow Jones (US30) 39,065.26 −605.78 (−1.53%)
DAX (DE40) 18,691.32 +11.12 (+0.06%)
FTSE 100 (UK100) 8,339.23 −31.10 (−0.37%)
USD Index 105.04 +0.11 (+0.10%)
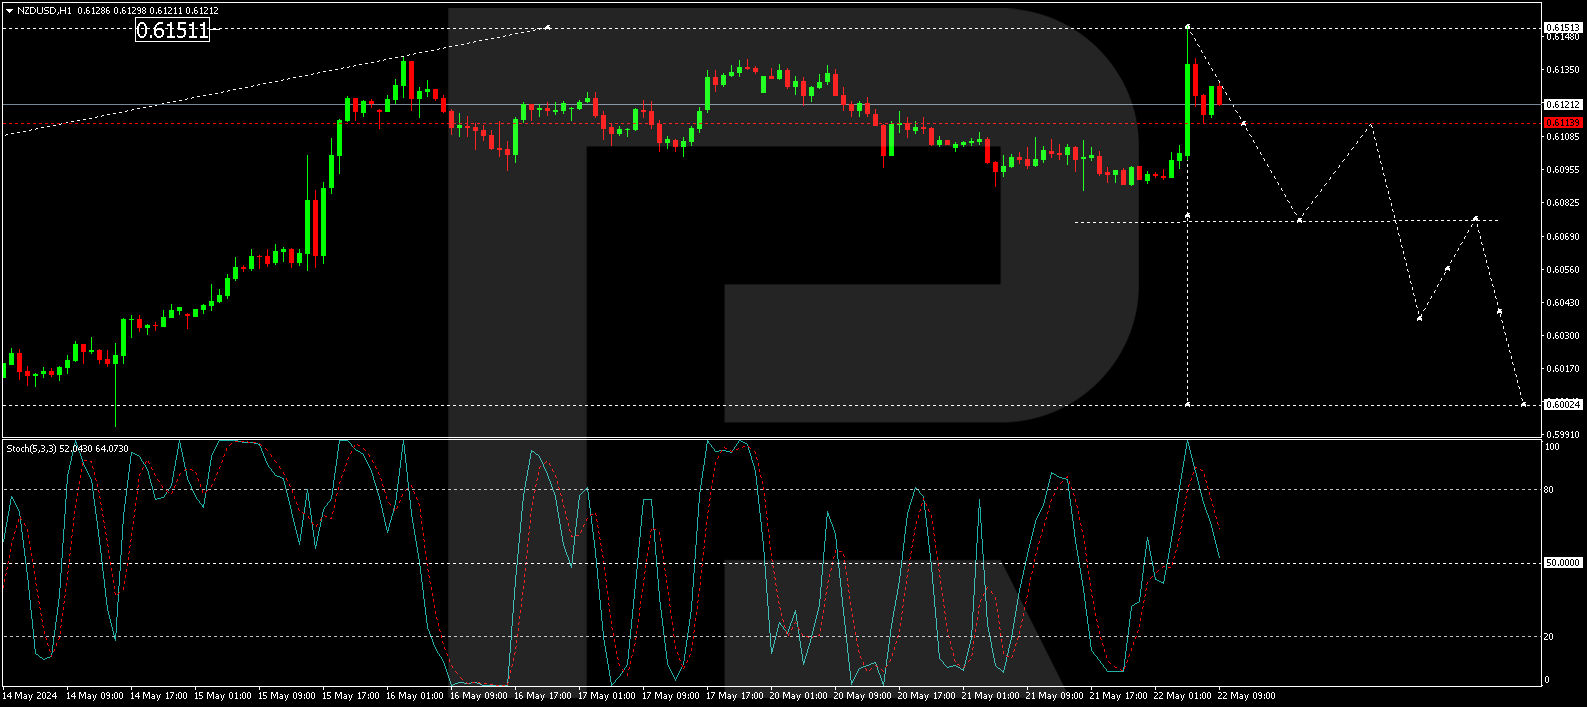
- – New Zealand Trade Balance (q/q) at 01:45 (GMT+3);
- – Japan National Core CPI (m/m) at 02:30 (GMT+3);
- – UK Retail Sales (m/m) at 09:00 (GMT+3);
- – German GDP (m/m) at 09:00 (GMT+3);
- – Switzerland Unemployment Rate (m/m) at 09:30 (GMT+3);
- – Switzerland SNB Chairman Thomas Jordan speaks at 10:45 (GMT+3);
- – US Core Durable Goods Orders (m/m) at 15:30 (GMT+3);
- – Canada Retail Sales (m/m) at 15:30 (GMT+3);
- – US Michigan Consumer Sentiment (m/m) at 17:00 (GMT+3).
By JustMarkets
This article reflects a personal opinion and should not be interpreted as an investment advice, and/or offer, and/or a persistent request for carrying out financial transactions, and/or a guarantee, and/or a forecast of future events.