
By InvestMacro
Here are the latest charts and statistics for the Commitment of Traders (COT) data published by the Commodities Futures Trading Commission (CFTC).
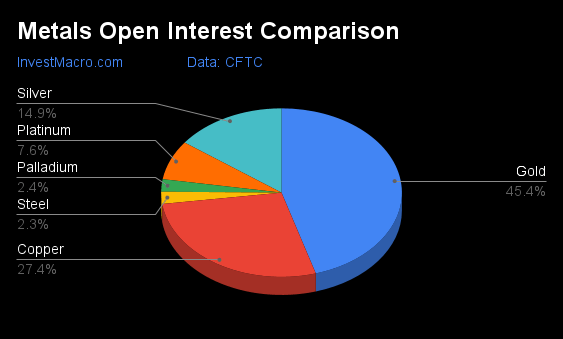
The latest COT data is updated through Tuesday May 14th and shows a quick view of how large traders (for-profit speculators and commercial entities) were positioned in the futures markets.
Weekly Speculator Changes led by Platinum & Silver
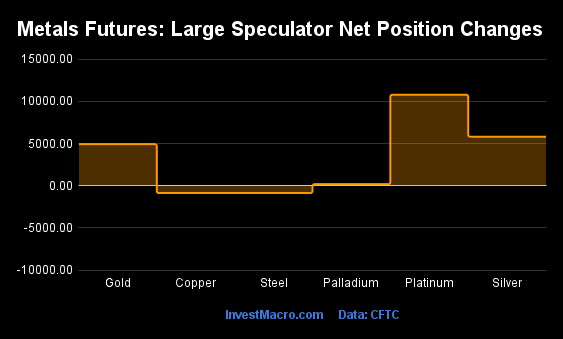
The COT metals markets speculator bets were higher this week as four out of the six metals markets we cover had higher positioning while the other two markets had lower speculator contracts.
Free Reports:
 Sign Up for Our Stock Market Newsletter – Get updated on News, Charts & Rankings of Public Companies when you join our Stocks Newsletter
 Get our Weekly Commitment of Traders Reports - See where the biggest traders (Hedge Funds and Commercial Hedgers) are positioned in the futures markets on a weekly basis.
Leading the gains for the metals was Platinum (10,787 contracts) with Silver (5,809 contracts), Gold (4,929 contracts) and Palladium (188 contracts) also showing positive weeks.
The markets with declines in speculator bets for the week were Copper (-868 contracts) with Steel (-865 contracts) also registering lower bets on the week.
Metals Net Speculators Leaderboard
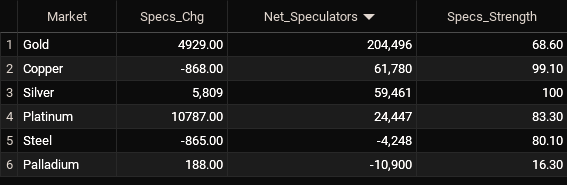
Legend: Weekly Speculators Change | Speculators Current Net Position | Speculators Strength Score compared to last 3-Years (0-100 range)
Strength Scores led by Silver & Copper
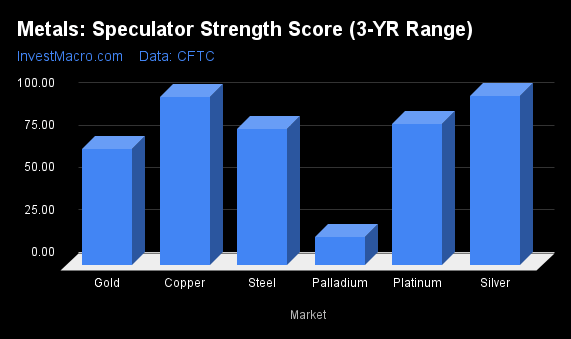
COT Strength Scores (a normalized measure of Speculator positions over a 3-Year range, from 0 to 100 where above 80 is Extreme-Bullish and below 20 is Extreme-Bearish) showed that Silver (100 percent) and Copper (99 percent) lead the metals markets this week. Gold (69 percent) comes in as the next highest in the weekly strength scores.
On the downside, Palladium (16 percent) comes in at the lowest strength level currently and is in Extreme-Bearish territory (below 20 percent).
Strength Statistics:
Gold (68.6 percent) vs Gold previous week (66.3 percent)
Silver (100.0 percent) vs Silver previous week (92.0 percent)
Copper (99.1 percent) vs Copper previous week (100.0 percent)
Platinum (83.3 percent) vs Platinum previous week (54.5 percent)
Palladium (16.3 percent) vs Palladium previous week (15.2 percent)
Steel (80.1 percent) vs Palladium previous week (83.4 percent)
Copper & Platinum top the 6-Week Strength Trends
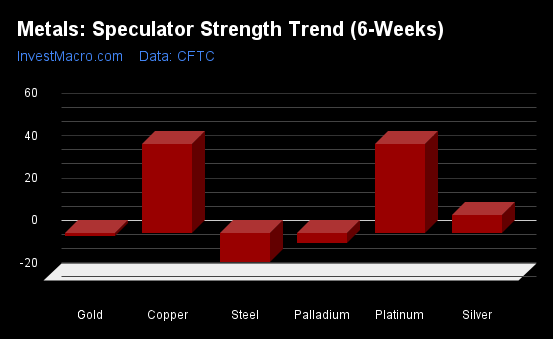
COT Strength Score Trends (or move index, calculates the 6-week changes in strength scores) showed that Copper (42 percent) and Platinum (42 percent) lead the past six weeks trends for metals.
Steel (-13 percent) and Palladium (-4 percent) lead the downside trend scores currently.
Move Statistics:
Gold (-1.2 percent) vs Gold previous week (0.1 percent)
Silver (8.7 percent) vs Silver previous week (3.9 percent)
Copper (42.2 percent) vs Copper previous week (40.2 percent)
Platinum (42.3 percent) vs Platinum previous week (17.3 percent)
Palladium (-4.4 percent) vs Palladium previous week (-7.4 percent)
Steel (-13.5 percent) vs Steel previous week (-6.1 percent)
Individual Markets:
Gold Comex Futures:
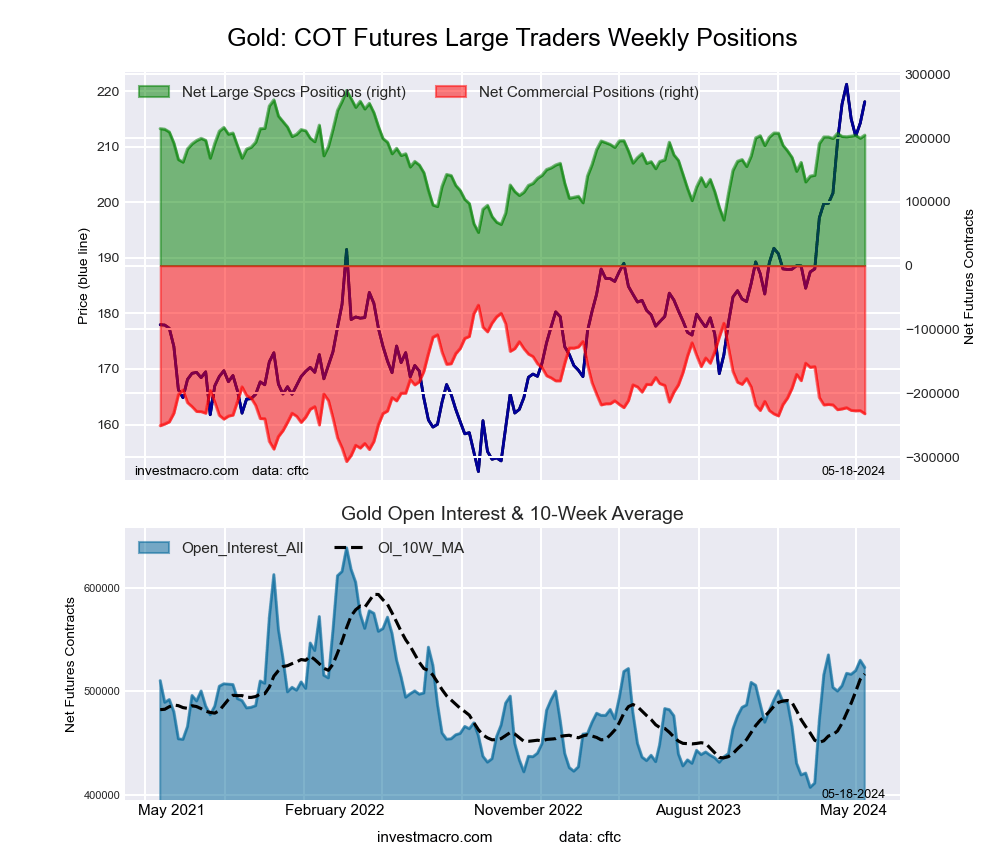 The Gold Comex Futures large speculator standing this week was a net position of 204,496 contracts in the data reported through Tuesday. This was a weekly rise of 4,929 contracts from the previous week which had a total of 199,567 net contracts.
This week’s current strength score (the trader positioning range over the past three years, measured from 0 to 100) shows the speculators are currently Bullish with a score of 68.6 percent. The commercials are Bearish with a score of 30.6 percent and the small traders (not shown in chart) are Bullish with a score of 62.8 percent.
Price Trend-Following Model: Strong Uptrend
Our weekly trend-following model classifies the current market price position as: Strong Uptrend. The current action for the model is considered to be: Hold – Maintain Long Position.
| Gold Futures Statistics | SPECULATORS | COMMERCIALS | SMALL TRADERS |
| – Percent of Open Interest Longs: | 53.1 | 25.5 | 10.1 |
| – Percent of Open Interest Shorts: | 14.0 | 69.9 | 4.8 |
| – Net Position: | 204,496 | -232,110 | 27,614 |
| – Gross Longs: | 277,642 | 133,583 | 52,633 |
| – Gross Shorts: | 73,146 | 365,693 | 25,019 |
| – Long to Short Ratio: | 3.8 to 1 | 0.4 to 1 | 2.1 to 1 |
| NET POSITION TREND: | |||
| – Strength Index Score (3 Year Range Pct): | 68.6 | 30.6 | 62.8 |
| – Strength Index Reading (3 Year Range): | Bullish | Bearish | Bullish |
| NET POSITION MOVEMENT INDEX: | |||
| – 6-Week Change in Strength Index: | -1.2 | -2.6 | 29.4 |
Silver Comex Futures:
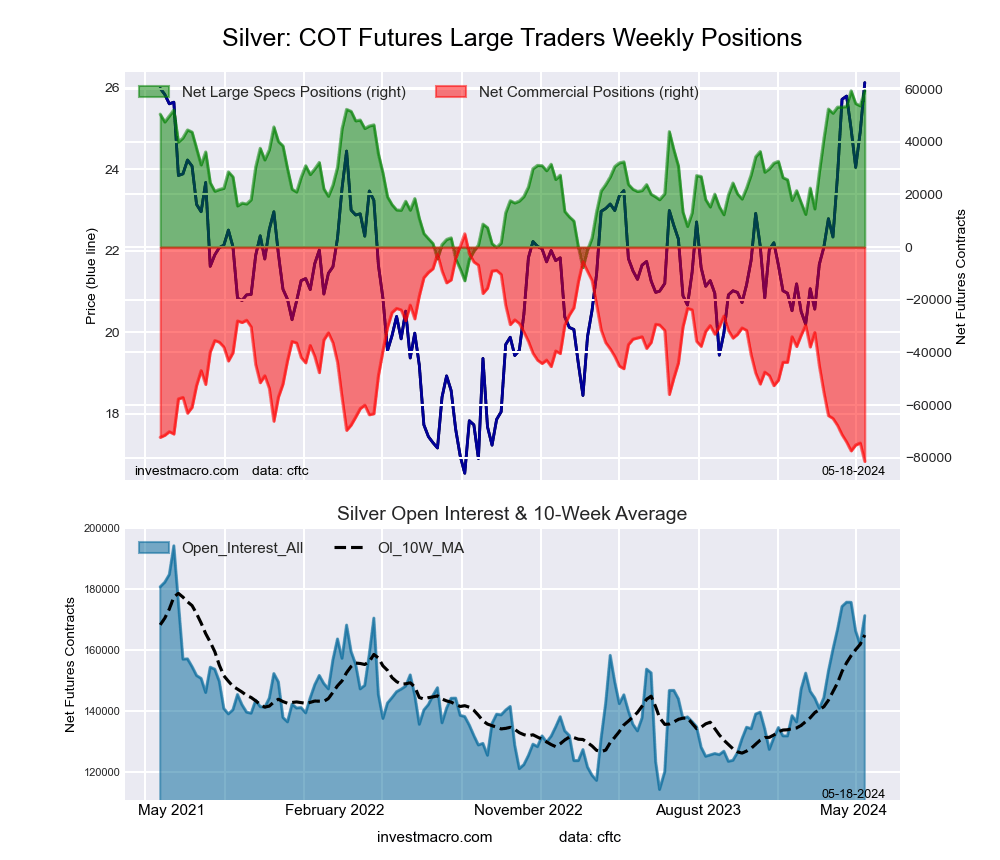 The Silver Comex Futures large speculator standing this week was a net position of 59,461 contracts in the data reported through Tuesday. This was a weekly boost of 5,809 contracts from the previous week which had a total of 53,652 net contracts.
This week’s current strength score (the trader positioning range over the past three years, measured from 0 to 100) shows the speculators are currently Bullish-Extreme with a score of 100.0 percent. The commercials are Bearish-Extreme with a score of 0.0 percent and the small traders (not shown in chart) are Bullish-Extreme with a score of 88.8 percent.
Price Trend-Following Model: Strong Uptrend
Our weekly trend-following model classifies the current market price position as: Strong Uptrend. The current action for the model is considered to be: Hold – Maintain Long Position.
| Silver Futures Statistics | SPECULATORS | COMMERCIALS | SMALL TRADERS |
| – Percent of Open Interest Longs: | 51.3 | 24.2 | 19.1 |
| – Percent of Open Interest Shorts: | 16.6 | 71.7 | 6.3 |
| – Net Position: | 59,461 | -81,422 | 21,961 |
| – Gross Longs: | 87,936 | 41,532 | 32,735 |
| – Gross Shorts: | 28,475 | 122,954 | 10,774 |
| – Long to Short Ratio: | 3.1 to 1 | 0.3 to 1 | 3.0 to 1 |
| NET POSITION TREND: | |||
| – Strength Index Score (3 Year Range Pct): | 100.0 | 0.0 | 88.8 |
| – Strength Index Reading (3 Year Range): | Bullish-Extreme | Bearish-Extreme | Bullish-Extreme |
| NET POSITION MOVEMENT INDEX: | |||
| – 6-Week Change in Strength Index: | 8.7 | -15.9 | 41.4 |
Copper Grade #1 Futures:
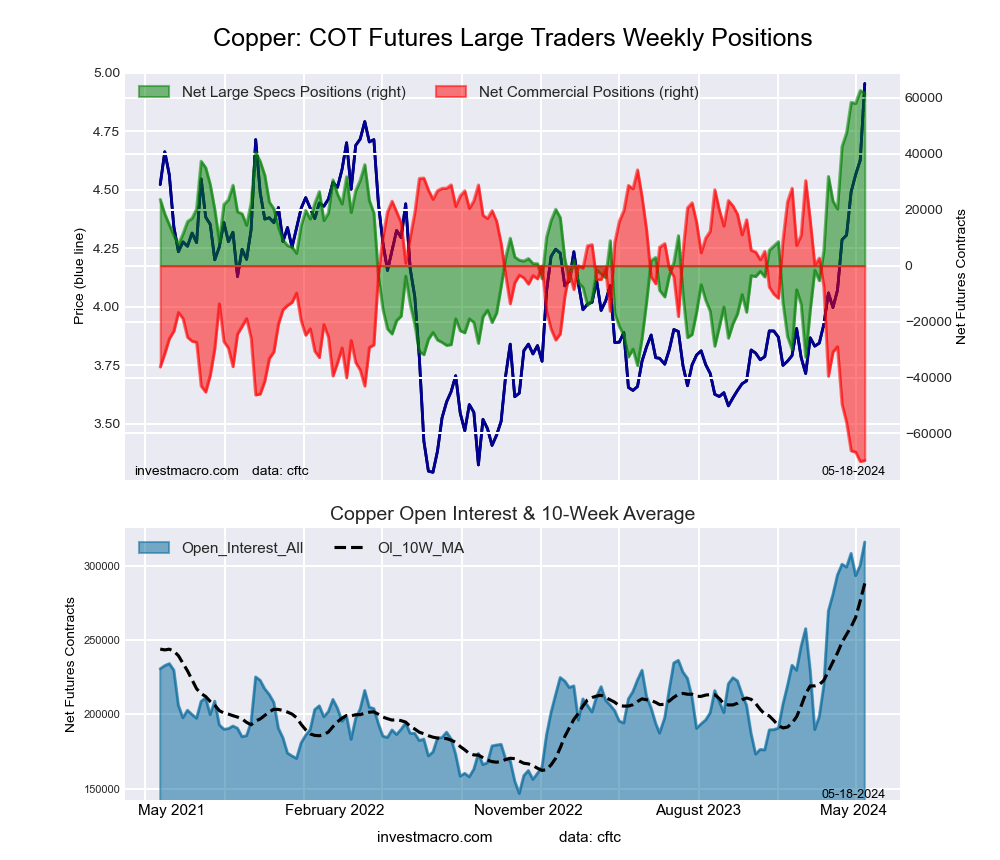 The Copper Grade #1 Futures large speculator standing this week was a net position of 61,780 contracts in the data reported through Tuesday. This was a weekly decrease of -868 contracts from the previous week which had a total of 62,648 net contracts.
This week’s current strength score (the trader positioning range over the past three years, measured from 0 to 100) shows the speculators are currently Bullish-Extreme with a score of 99.1 percent. The commercials are Bearish-Extreme with a score of 0.3 percent and the small traders (not shown in chart) are Bullish with a score of 68.2 percent.
Price Trend-Following Model: Strong Uptrend
Our weekly trend-following model classifies the current market price position as: Strong Uptrend. The current action for the model is considered to be: Hold – Maintain Long Position.
| Copper Futures Statistics | SPECULATORS | COMMERCIALS | SMALL TRADERS |
| – Percent of Open Interest Longs: | 51.8 | 22.5 | 8.0 |
| – Percent of Open Interest Shorts: | 32.2 | 44.5 | 5.5 |
| – Net Position: | 61,780 | -69,656 | 7,876 |
| – Gross Longs: | 163,662 | 71,026 | 25,246 |
| – Gross Shorts: | 101,882 | 140,682 | 17,370 |
| – Long to Short Ratio: | 1.6 to 1 | 0.5 to 1 | 1.5 to 1 |
| NET POSITION TREND: | |||
| – Strength Index Score (3 Year Range Pct): | 99.1 | 0.3 | 68.2 |
| – Strength Index Reading (3 Year Range): | Bullish-Extreme | Bearish-Extreme | Bullish |
| NET POSITION MOVEMENT INDEX: | |||
| – 6-Week Change in Strength Index: | 42.2 | -39.0 | -4.9 |
Platinum Futures:
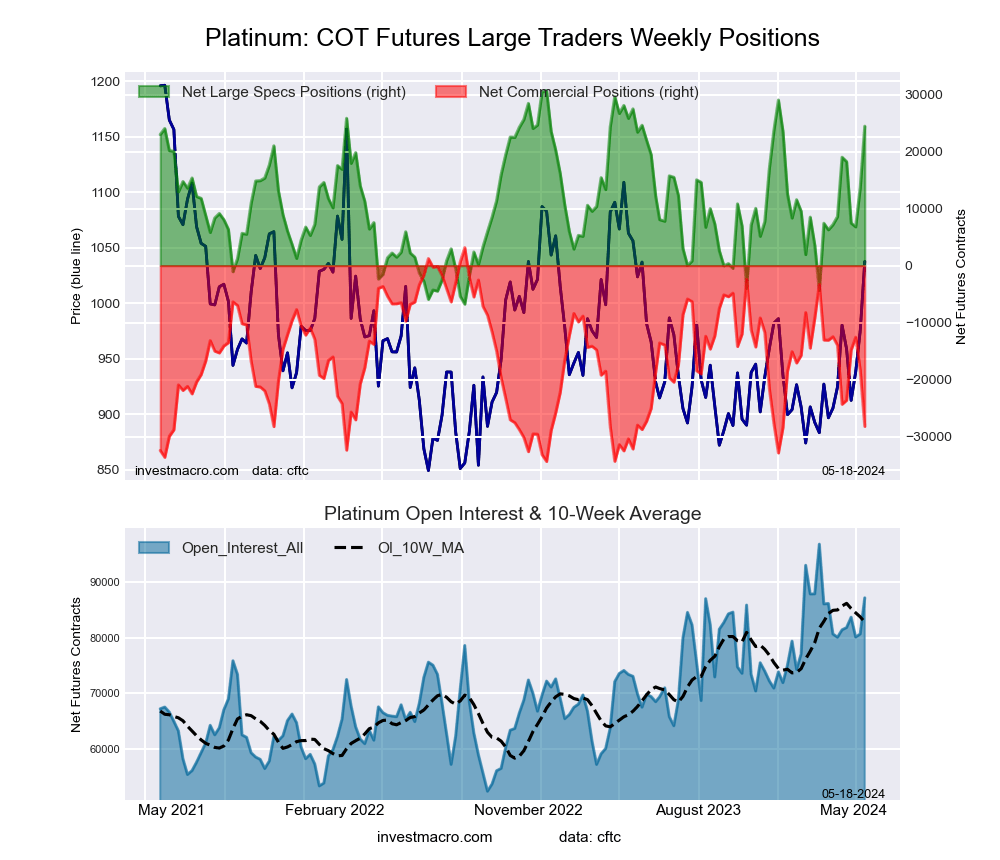 The Platinum Futures large speculator standing this week was a net position of 24,447 contracts in the data reported through Tuesday. This was a weekly advance of 10,787 contracts from the previous week which had a total of 13,660 net contracts.
This week’s current strength score (the trader positioning range over the past three years, measured from 0 to 100) shows the speculators are currently Bullish-Extreme with a score of 83.3 percent. The commercials are Bearish-Extreme with a score of 16.4 percent and the small traders (not shown in chart) are Bearish-Extreme with a score of 18.7 percent.
Price Trend-Following Model: Strong Uptrend
Our weekly trend-following model classifies the current market price position as: Strong Uptrend. The current action for the model is considered to be: Hold – Maintain Long Position.
| Platinum Futures Statistics | SPECULATORS | COMMERCIALS | SMALL TRADERS |
| – Percent of Open Interest Longs: | 61.2 | 19.7 | 10.5 |
| – Percent of Open Interest Shorts: | 33.1 | 52.1 | 6.2 |
| – Net Position: | 24,447 | -28,194 | 3,747 |
| – Gross Longs: | 53,314 | 17,181 | 9,115 |
| – Gross Shorts: | 28,867 | 45,375 | 5,368 |
| – Long to Short Ratio: | 1.8 to 1 | 0.4 to 1 | 1.7 to 1 |
| NET POSITION TREND: | |||
| – Strength Index Score (3 Year Range Pct): | 83.3 | 16.4 | 18.7 |
| – Strength Index Reading (3 Year Range): | Bullish-Extreme | Bearish-Extreme | Bearish-Extreme |
| NET POSITION MOVEMENT INDEX: | |||
| – 6-Week Change in Strength Index: | 42.3 | -37.9 | -22.2 |
Palladium Futures:
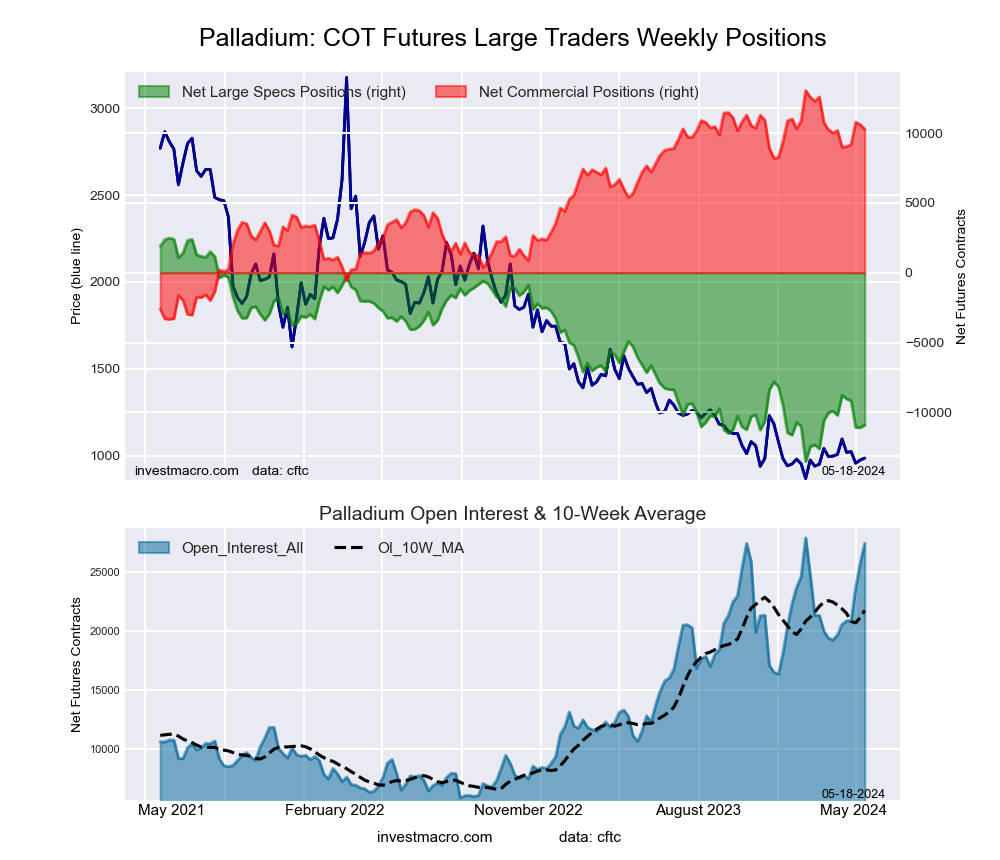 The Palladium Futures large speculator standing this week was a net position of -10,900 contracts in the data reported through Tuesday. This was a weekly gain of 188 contracts from the previous week which had a total of -11,088 net contracts.
This week’s current strength score (the trader positioning range over the past three years, measured from 0 to 100) shows the speculators are currently Bearish-Extreme with a score of 16.3 percent. The commercials are Bullish-Extreme with a score of 83.1 percent and the small traders (not shown in chart) are Bullish with a score of 79.2 percent.
Price Trend-Following Model: Uptrend
Our weekly trend-following model classifies the current market price position as: Uptrend. The current action for the model is considered to be: New Buy – Long Position.
| Palladium Futures Statistics | SPECULATORS | COMMERCIALS | SMALL TRADERS |
| – Percent of Open Interest Longs: | 22.3 | 47.6 | 8.3 |
| – Percent of Open Interest Shorts: | 62.1 | 10.1 | 6.0 |
| – Net Position: | -10,900 | 10,276 | 624 |
| – Gross Longs: | 6,110 | 13,034 | 2,271 |
| – Gross Shorts: | 17,010 | 2,758 | 1,647 |
| – Long to Short Ratio: | 0.4 to 1 | 4.7 to 1 | 1.4 to 1 |
| NET POSITION TREND: | |||
| – Strength Index Score (3 Year Range Pct): | 16.3 | 83.1 | 79.2 |
| – Strength Index Reading (3 Year Range): | Bearish-Extreme | Bullish-Extreme | Bullish |
| NET POSITION MOVEMENT INDEX: | |||
| – 6-Week Change in Strength Index: | -4.4 | 0.6 | 36.4 |
Steel Futures Futures:
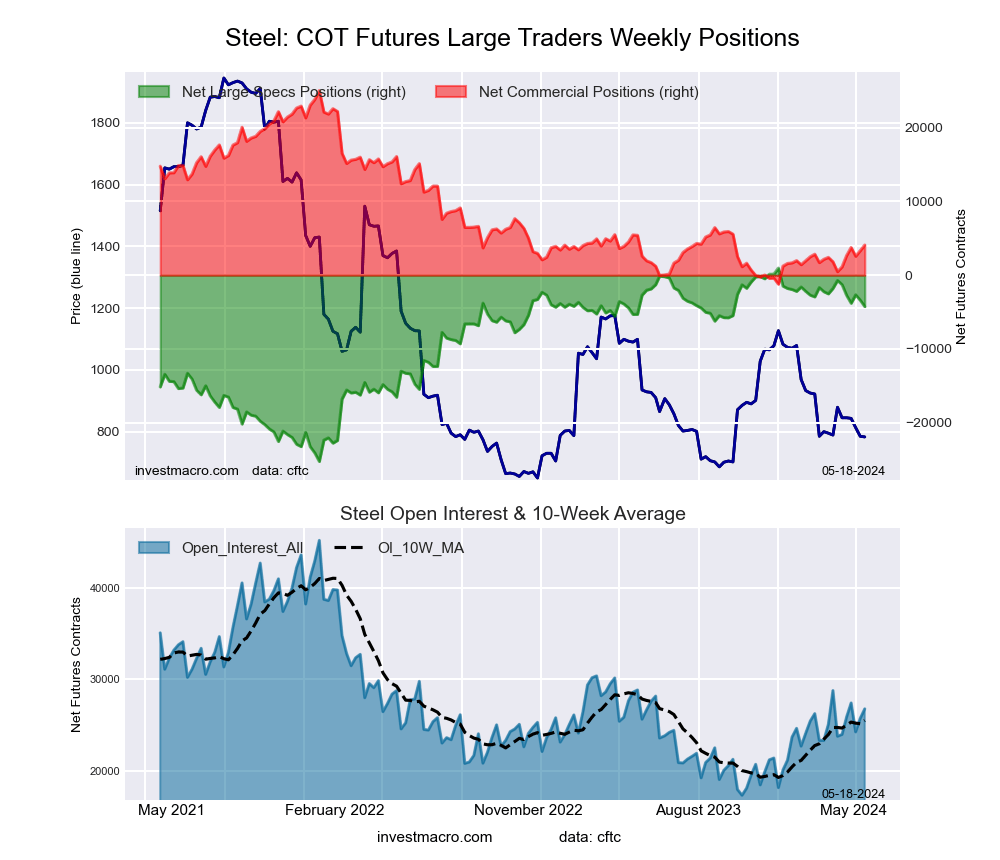 The Steel Futures large speculator standing this week was a net position of -4,248 contracts in the data reported through Tuesday. This was a weekly reduction of -865 contracts from the previous week which had a total of -3,383 net contracts.
This week’s current strength score (the trader positioning range over the past three years, measured from 0 to 100) shows the speculators are currently Bullish-Extreme with a score of 80.1 percent. The commercials are Bearish with a score of 20.2 percent and the small traders (not shown in chart) are Bearish with a score of 49.6 percent.
Price Trend-Following Model: Downtrend
Our weekly trend-following model classifies the current market price position as: Downtrend. The current action for the model is considered to be: Hold – Maintain Short Position.
| Steel Futures Statistics | SPECULATORS | COMMERCIALS | SMALL TRADERS |
| – Percent of Open Interest Longs: | 13.3 | 80.4 | 1.6 |
| – Percent of Open Interest Shorts: | 29.2 | 65.1 | 1.0 |
| – Net Position: | -4,248 | 4,091 | 157 |
| – Gross Longs: | 3,573 | 21,523 | 437 |
| – Gross Shorts: | 7,821 | 17,432 | 280 |
| – Long to Short Ratio: | 0.5 to 1 | 1.2 to 1 | 1.6 to 1 |
| NET POSITION TREND: | |||
| – Strength Index Score (3 Year Range Pct): | 80.1 | 20.2 | 49.6 |
| – Strength Index Reading (3 Year Range): | Bullish-Extreme | Bearish | Bearish |
| NET POSITION MOVEMENT INDEX: | |||
| – 6-Week Change in Strength Index: | -13.5 | 13.8 | -8.4 |
Article By InvestMacro – Receive our weekly COT Newsletter
*COT Report: The COT data, released weekly to the public each Friday, is updated through the most recent Tuesday (data is 3 days old) and shows a quick view of how large speculators or non-commercials (for-profit traders) were positioned in the futures markets.
The CFTC categorizes trader positions according to commercial hedgers (traders who use futures contracts for hedging as part of the business), non-commercials (large traders who speculate to realize trading profits) and nonreportable traders (usually small traders/speculators) as well as their open interest (contracts open in the market at time of reporting). See CFTC criteria here.

- COT Metals Charts: Weekly Speculator Bets led by Copper & Steel Jul 18, 2026
- COT Bonds Charts: Weekly Speculator Bets led by 2-Year, SOFR 3M & 5-Year Bonds Jul 18, 2026
- COT Energy Charts: Weekly Speculator Bets led by Brent Oil & Heating Oil Jul 18, 2026
- COT Soft Commodities Charts: Weekly Speculator Bets led by Wheat, Corn & Soybean Meal Jul 18, 2026
- The Bank of Canada kept its interest rate unchanged. Platinum prices reached a three‑week high Jul 16, 2026
- Stock indices rose after the release of US inflation data. China’s GDP slowed sharply Jul 15, 2026
- GBP/USD Awaits Political News: What Will Happen Next Jul 15, 2026
- USD/JPY Holds at Highs: Pressure Lingers on Yen Jul 14, 2026
- Oil prices jumped 4% amid a new wave of escalation between the US and Iran Jul 13, 2026
- EUR/USD: US Inflation Will Determine Everything Jul 13, 2026