
By InvestMacro
Here are the latest charts and statistics for the Commitment of Traders (COT) reports data published by the Commodities Futures Trading Commission (CFTC).
The latest COT data is updated through Tuesday January 3rd and shows a quick view of how large traders (for-profit speculators and commercial entities) were positioned in the futures markets.
Weekly Speculator Changes led by Corn & Soybeans
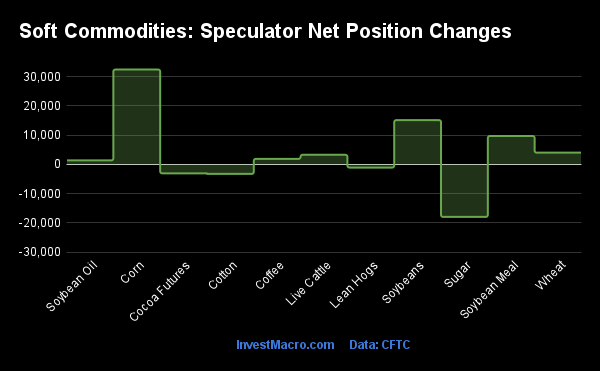
The COT soft commodities markets speculator bets were higher this week as seven out of the eleven softs markets we cover had higher positioning while the other four markets had lower speculator contracts.
Free Reports:
 Download Our Metatrader 4 Indicators – Put Our Free MetaTrader 4 Custom Indicators on your charts when you join our Weekly Newsletter
 Get our Weekly Commitment of Traders Reports - See where the biggest traders (Hedge Funds and Commercial Hedgers) are positioned in the futures markets on a weekly basis.
Leading the gains for the softs markets was Corn (32,399 contracts) with Soybeans (15,120 contracts), Soybean Meal (9,695 contracts), Wheat (3,998 contracts), Live Cattle (3,288 contracts), Coffee (1,892 contracts) and Soybean Oil (1,376 contracts) also showing positive weeks.
The markets with the declines in speculator bets this week were Sugar (-17,938 contracts), Cocoa (-3,065 contracts), Cotton (-3,250 contracts) and Lean Hogs (-1,087 contracts) also registering lower bets on the week.
| Jan-03-2023 | OI | OI-Index | Spec-Net | Spec-Index | Com-Net | COM-Index | Smalls-Net | Smalls-Index |
|---|---|---|---|---|---|---|---|---|
| WTI Crude | 1,459,936 | 6 | 227,607 | 4 | -249,040 | 97 | 21,433 | 35 |
| Gold | 449,393 | 7 | 141,666 | 30 | -159,974 | 70 | 18,308 | 26 |
| Silver | 131,990 | 9 | 30,934 | 48 | -44,211 | 53 | 13,277 | 37 |
| Copper | 164,594 | 13 | -4,675 | 33 | -163 | 67 | 4,838 | 53 |
| Palladium | 8,456 | 12 | -2,542 | 10 | 2,422 | 87 | 120 | 49 |
| Platinum | 69,687 | 38 | 30,503 | 50 | -33,157 | 54 | 2,654 | 4 |
| Natural Gas | 1,031,182 | 15 | -169,813 | 28 | 142,142 | 76 | 27,671 | 46 |
| Brent | 139,687 | 4 | -26,514 | 61 | 23,081 | 36 | 3,433 | 56 |
| Heating Oil | 252,205 | 17 | 16,613 | 67 | -34,031 | 35 | 17,418 | 59 |
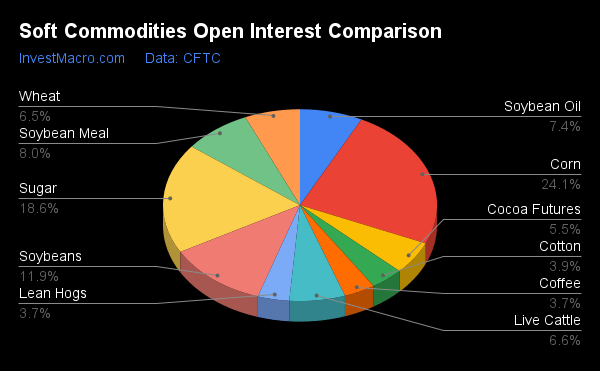
| Soybeans | 603,609 | 7 | 148,639 | 57 | -111,329 | 55 | -37,310 | 8 |
| Corn | 1,221,434 | 4 | 267,532 | 64 | -217,117 | 41 | -50,415 | 16 |
| Coffee | 187,767 | 3 | -812 | 18 | -641 | 83 | 1,453 | 20 |
| Sugar | 940,021 | 45 | 228,492 | 72 | -273,497 | 25 | 45,005 | 63 |
| Wheat | 331,577 | 19 | -32,291 | 7 | 37,636 | 94 | -5,345 | 83 |
Strength Scores led by Soybean Meal & Sugar
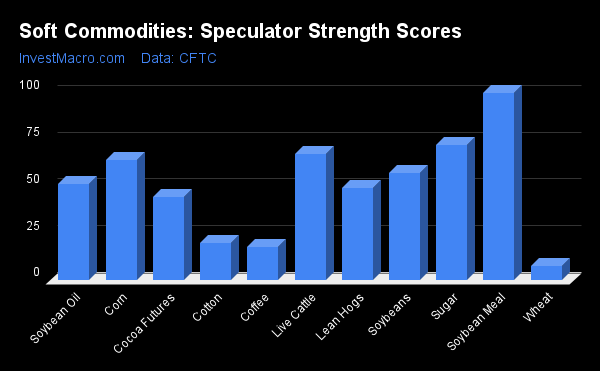
COT Strength Scores (a normalized measure of Speculator positions over a 3-Year range, from 0 to 100 where above 80 is Extreme-Bullish and below 20 is Extreme-Bearish) showed that Soybean Meal (100 percent) and Sugar (72 percent) lead the softs markets this week. Live Cattle (68 percent), Corn (64 percent) and Soybeans (57 percent) come in as the next highest in the weekly strength scores.
On the downside, Wheat (7 percent), Coffee (18 percent) and Cotton (19.8 percent) come in at the lowest strength levels currently and are in Extreme-Bearish territory (below 20 percent). The next lowest strength score was Cocoa (44 percent).
Strength Statistics:
Corn (64.2 percent) vs Corn previous week (60.1 percent)
Sugar (72.5 percent) vs Sugar previous week (78.7 percent)
Coffee (17.7 percent) vs Coffee previous week (15.5 percent)
Soybeans (57.3 percent) vs Soybeans previous week (52.5 percent)
Soybean Oil (51.5 percent) vs Soybean Oil previous week (50.6 percent)
Soybean Meal (100.0 percent) vs Soybean Meal previous week (95.3 percent)
Live Cattle (67.7 percent) vs Live Cattle previous week (63.6 percent)
Lean Hogs (49.3 percent) vs Lean Hogs previous week (37.4 percent)
Cotton (19.8 percent) vs Cotton previous week (22.3 percent)
Cocoa (44.4 percent) vs Cocoa previous week (47.4 percent)
Wheat (7.5 percent) vs Wheat previous week (2.9 percent)
Soybean Meal & Soybeans top the 6-Week Strength Trends
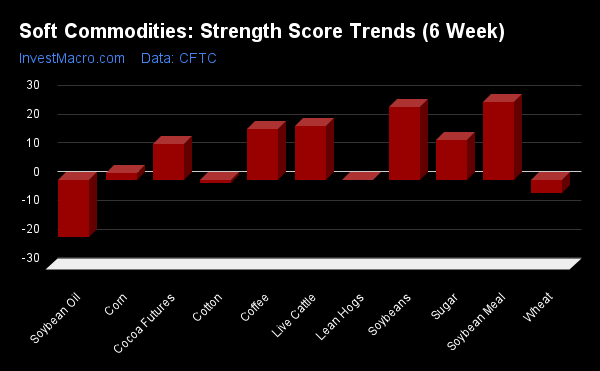
COT Strength Score Trends (or move index, calculates the 6-week changes in strength scores) showed that Soybean Meal (27 percent) and Soybeans (25 percent) lead the past six weeks trends for soft commodities. Live Cattle (19 percent), Coffee (18 percent) and Sugar (14 percent) are the next highest positive movers in the latest trends data.
Soybean Oil (-20 percent) leads the downside trend scores currently with Wheat (-5 percent) and Cotton (-1 percent) following next with lower trend scores.
Strength Trend Statistics:
Corn (2.4 percent) vs Corn previous week (-2.3 percent)
Sugar (13.9 percent) vs Sugar previous week (31.0 percent)
Coffee (17.7 percent) vs Coffee previous week (13.2 percent)
Soybeans (25.1 percent) vs Soybeans previous week (18.1 percent)
Soybean Oil (-19.8 percent) vs Soybean Oil previous week (-24.7 percent)
Soybean Meal (27.0 percent) vs Soybean Meal previous week (20.5 percent)
Live Cattle (18.8 percent) vs Live Cattle previous week (24.2 percent)
Lean Hogs (-0.1 percent) vs Lean Hogs previous week (-8.5 percent)
Cotton (-1.0 percent) vs Cotton previous week (-0.3 percent)
Cocoa (12.4 percent) vs Cocoa previous week (5.0 percent)
Wheat (-4.7 percent) vs Wheat previous week (-19.4 percent)
Individual Soft Commodities Markets:
CORN Futures:
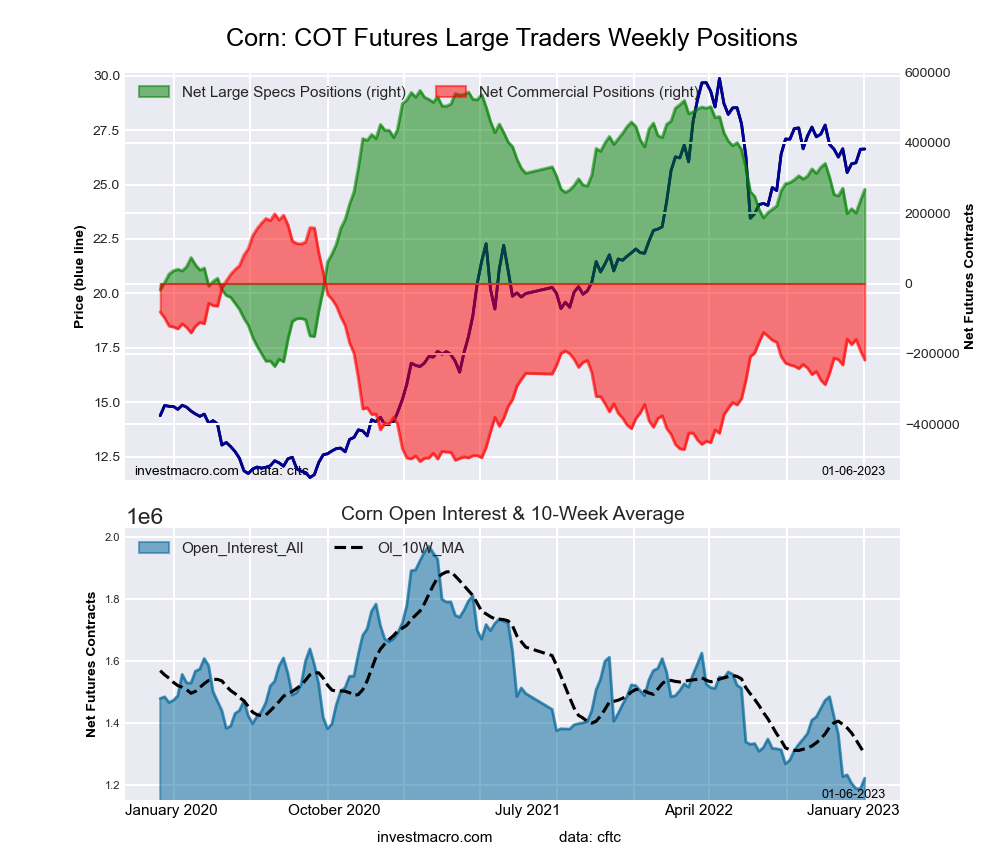 The CORN large speculator standing this week reached a net position of 267,532 contracts in the data reported through Tuesday. This was a weekly boost of 32,399 contracts from the previous week which had a total of 235,133 net contracts.
This week’s current strength score (the trader positioning range over the past three years, measured from 0 to 100) shows the speculators are currently Bullish with a score of 64.2 percent. The commercials are Bearish with a score of 41.0 percent and the small traders (not shown in chart) are Bearish-Extreme with a score of 15.9 percent.
| CORN Futures Statistics | SPECULATORS | COMMERCIALS | SMALL TRADERS |
| – Percent of Open Interest Longs: | 29.4 | 44.4 | 9.6 |
| – Percent of Open Interest Shorts: | 7.5 | 62.1 | 13.7 |
| – Net Position: | 267,532 | -217,117 | -50,415 |
| – Gross Longs: | 359,493 | 541,890 | 117,043 |
| – Gross Shorts: | 91,961 | 759,007 | 167,458 |
| – Long to Short Ratio: | 3.9 to 1 | 0.7 to 1 | 0.7 to 1 |
| NET POSITION TREND: | |||
| – Strength Index Score (3 Year Range Pct): | 64.2 | 41.0 | 15.9 |
| – Strength Index Reading (3 Year Range): | Bullish | Bearish | Bearish-Extreme |
| NET POSITION MOVEMENT INDEX: | |||
| – 6-Week Change in Strength Index: | 2.4 | -0.2 | -11.2 |
SUGAR Futures:
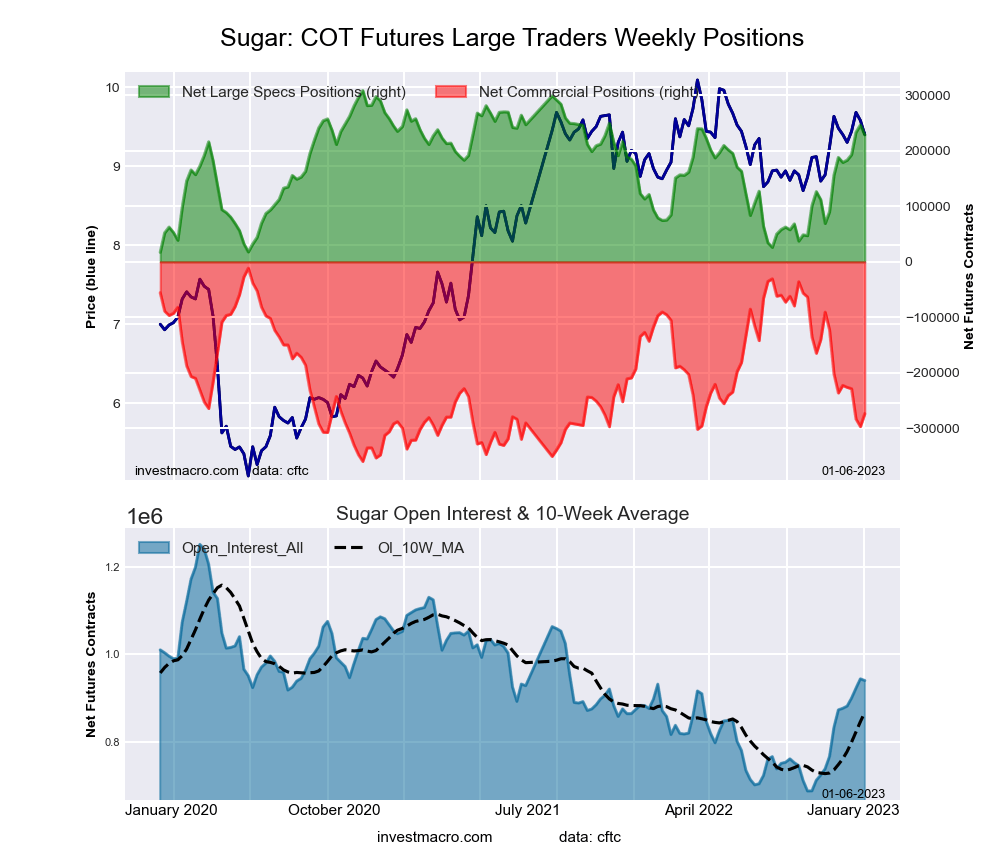 The SUGAR large speculator standing this week reached a net position of 228,492 contracts in the data reported through Tuesday. This was a weekly lowering of -17,938 contracts from the previous week which had a total of 246,430 net contracts.
This week’s current strength score (the trader positioning range over the past three years, measured from 0 to 100) shows the speculators are currently Bullish with a score of 72.5 percent. The commercials are Bearish with a score of 24.7 percent and the small traders (not shown in chart) are Bullish with a score of 63.5 percent.
| SUGAR Futures Statistics | SPECULATORS | COMMERCIALS | SMALL TRADERS |
| – Percent of Open Interest Longs: | 34.6 | 40.5 | 10.0 |
| – Percent of Open Interest Shorts: | 10.3 | 69.6 | 5.2 |
| – Net Position: | 228,492 | -273,497 | 45,005 |
| – Gross Longs: | 325,685 | 381,086 | 93,920 |
| – Gross Shorts: | 97,193 | 654,583 | 48,915 |
| – Long to Short Ratio: | 3.4 to 1 | 0.6 to 1 | 1.9 to 1 |
| NET POSITION TREND: | |||
| – Strength Index Score (3 Year Range Pct): | 72.5 | 24.7 | 63.5 |
| – Strength Index Reading (3 Year Range): | Bullish | Bearish | Bullish |
| NET POSITION MOVEMENT INDEX: | |||
| – 6-Week Change in Strength Index: | 13.9 | -10.7 | -3.9 |
COFFEE Futures:
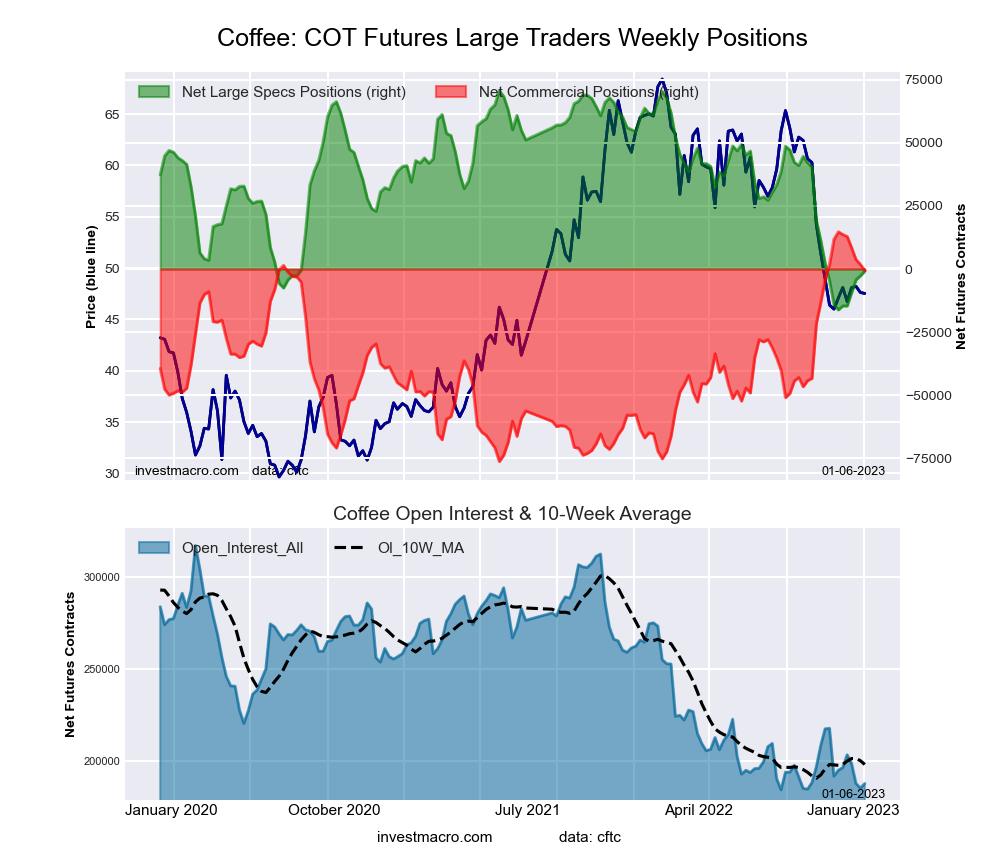 The COFFEE large speculator standing this week reached a net position of -812 contracts in the data reported through Tuesday. This was a weekly increase of 1,892 contracts from the previous week which had a total of -2,704 net contracts.
This week’s current strength score (the trader positioning range over the past three years, measured from 0 to 100) shows the speculators are currently Bearish-Extreme with a score of 17.7 percent. The commercials are Bullish-Extreme with a score of 83.1 percent and the small traders (not shown in chart) are Bearish-Extreme with a score of 19.6 percent.
| COFFEE Futures Statistics | SPECULATORS | COMMERCIALS | SMALL TRADERS |
| – Percent of Open Interest Longs: | 24.7 | 51.4 | 5.0 |
| – Percent of Open Interest Shorts: | 25.1 | 51.7 | 4.2 |
| – Net Position: | -812 | -641 | 1,453 |
| – Gross Longs: | 46,411 | 96,423 | 9,429 |
| – Gross Shorts: | 47,223 | 97,064 | 7,976 |
| – Long to Short Ratio: | 1.0 to 1 | 1.0 to 1 | 1.2 to 1 |
| NET POSITION TREND: | |||
| – Strength Index Score (3 Year Range Pct): | 17.7 | 83.1 | 19.6 |
| – Strength Index Reading (3 Year Range): | Bearish-Extreme | Bullish-Extreme | Bearish-Extreme |
| NET POSITION MOVEMENT INDEX: | |||
| – 6-Week Change in Strength Index: | 17.7 | -16.9 | 0.1 |
SOYBEANS Futures:
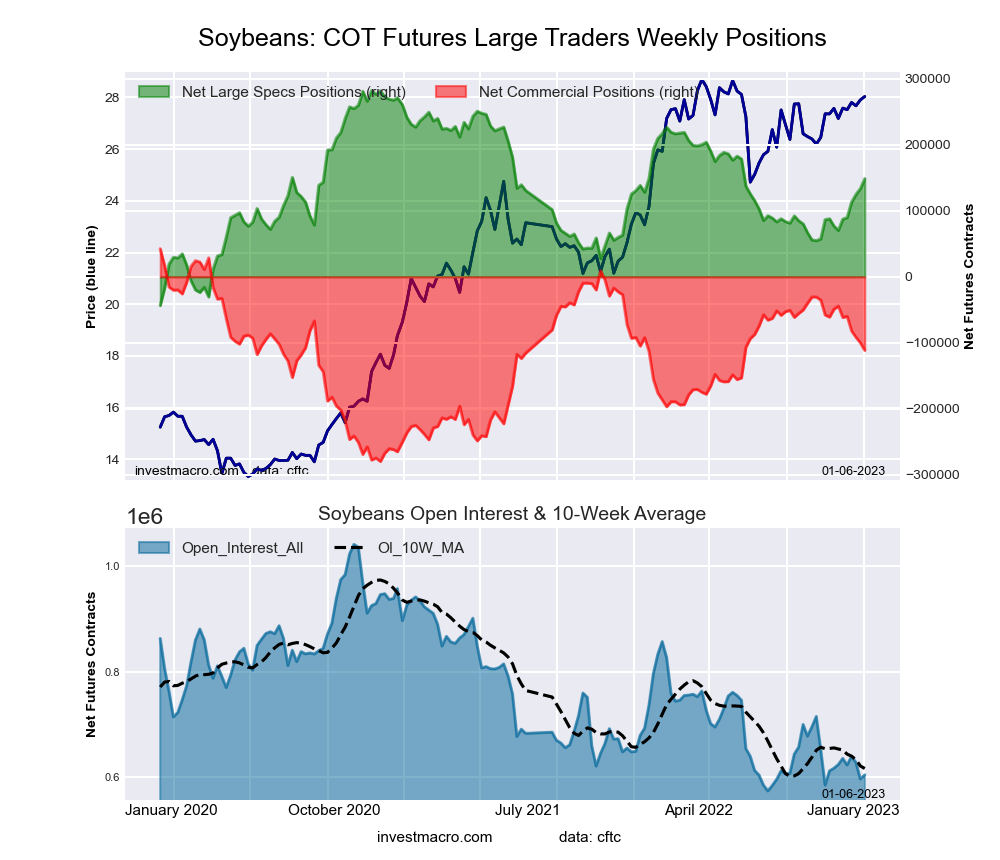 The SOYBEANS large speculator standing this week reached a net position of 148,639 contracts in the data reported through Tuesday. This was a weekly increase of 15,120 contracts from the previous week which had a total of 133,519 net contracts.
This week’s current strength score (the trader positioning range over the past three years, measured from 0 to 100) shows the speculators are currently Bullish with a score of 57.3 percent. The commercials are Bullish with a score of 54.6 percent and the small traders (not shown in chart) are Bearish-Extreme with a score of 7.9 percent.
| SOYBEANS Futures Statistics | SPECULATORS | COMMERCIALS | SMALL TRADERS |
| – Percent of Open Interest Longs: | 32.4 | 47.1 | 7.1 |
| – Percent of Open Interest Shorts: | 7.7 | 65.5 | 13.2 |
| – Net Position: | 148,639 | -111,329 | -37,310 |
| – Gross Longs: | 195,320 | 284,335 | 42,635 |
| – Gross Shorts: | 46,681 | 395,664 | 79,945 |
| – Long to Short Ratio: | 4.2 to 1 | 0.7 to 1 | 0.5 to 1 |
| NET POSITION TREND: | |||
| – Strength Index Score (3 Year Range Pct): | 57.3 | 54.6 | 7.9 |
| – Strength Index Reading (3 Year Range): | Bullish | Bullish | Bearish-Extreme |
| NET POSITION MOVEMENT INDEX: | |||
| – 6-Week Change in Strength Index: | 25.1 | -21.7 | -19.5 |
SOYBEAN OIL Futures:
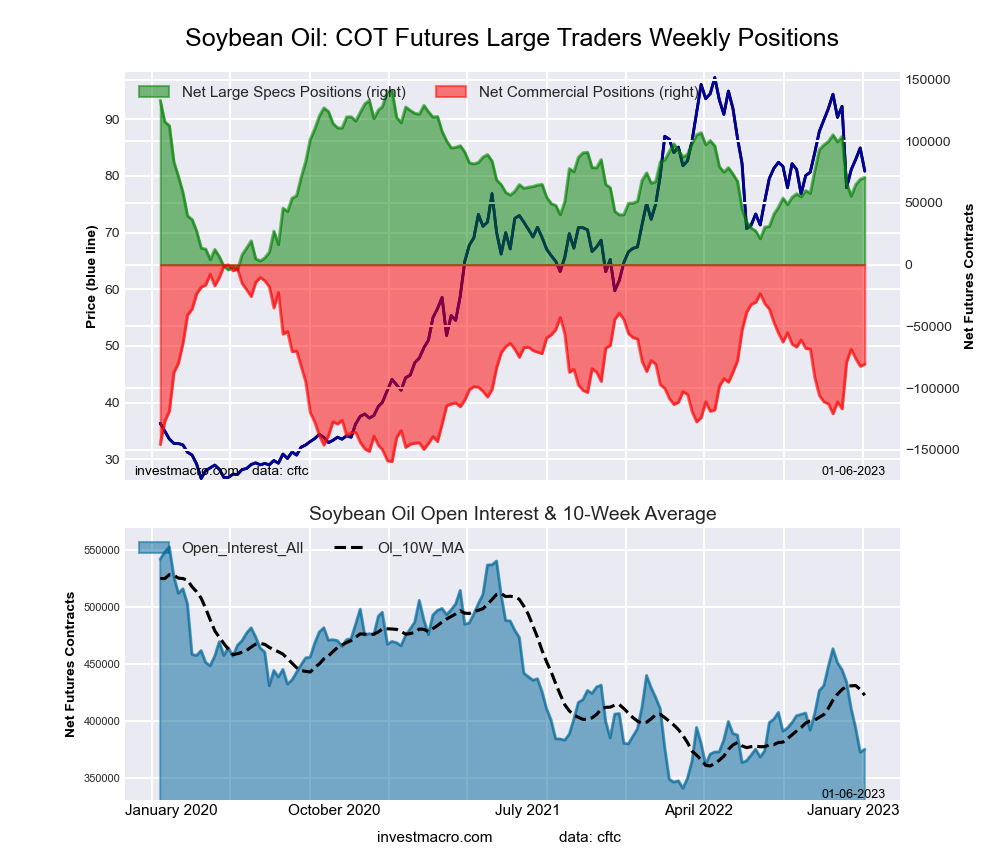 The SOYBEAN OIL large speculator standing this week reached a net position of 70,690 contracts in the data reported through Tuesday. This was a weekly increase of 1,376 contracts from the previous week which had a total of 69,314 net contracts.
This week’s current strength score (the trader positioning range over the past three years, measured from 0 to 100) shows the speculators are currently Bullish with a score of 51.5 percent. The commercials are Bearish with a score of 49.5 percent and the small traders (not shown in chart) are Bullish with a score of 50.8 percent.
| SOYBEAN OIL Futures Statistics | SPECULATORS | COMMERCIALS | SMALL TRADERS |
| – Percent of Open Interest Longs: | 26.4 | 47.7 | 8.7 |
| – Percent of Open Interest Shorts: | 7.6 | 69.2 | 6.0 |
| – Net Position: | 70,690 | -80,697 | 10,007 |
| – Gross Longs: | 99,018 | 178,653 | 32,575 |
| – Gross Shorts: | 28,328 | 259,350 | 22,568 |
| – Long to Short Ratio: | 3.5 to 1 | 0.7 to 1 | 1.4 to 1 |
| NET POSITION TREND: | |||
| – Strength Index Score (3 Year Range Pct): | 51.5 | 49.5 | 50.8 |
| – Strength Index Reading (3 Year Range): | Bullish | Bearish | Bullish |
| NET POSITION MOVEMENT INDEX: | |||
| – 6-Week Change in Strength Index: | -19.8 | 19.2 | -6.3 |
SOYBEAN MEAL Futures:
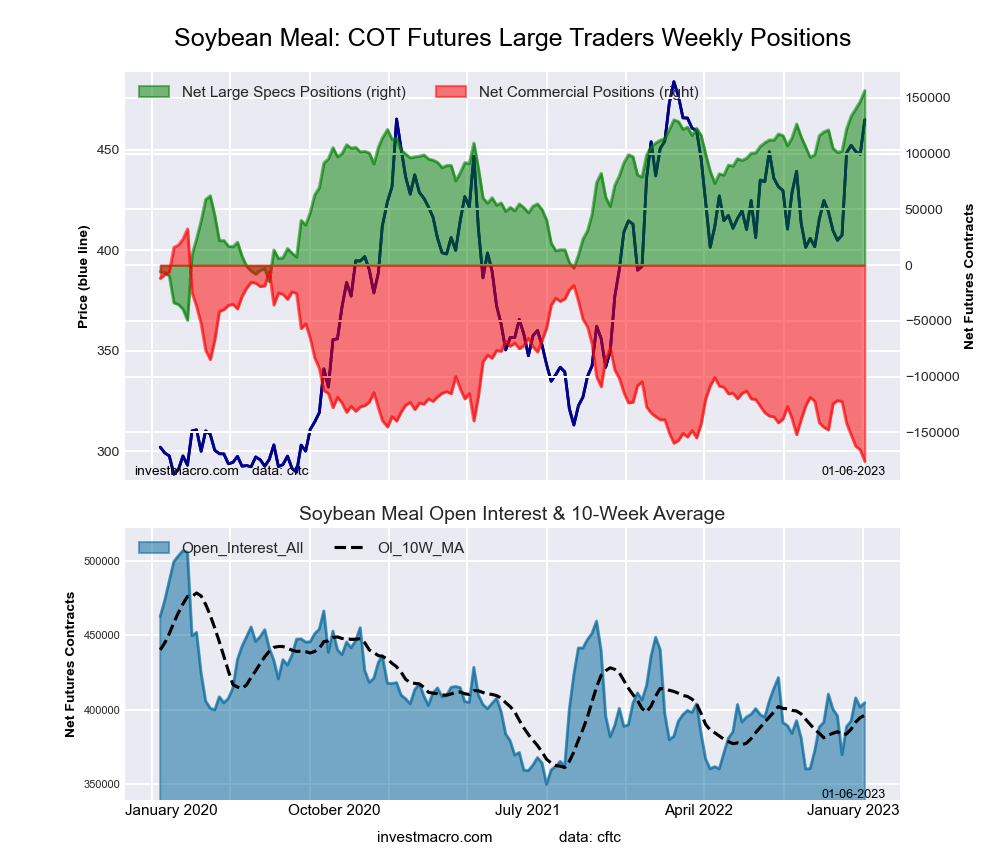 The SOYBEAN MEAL large speculator standing this week reached a net position of 156,568 contracts in the data reported through Tuesday. This was a weekly boost of 9,695 contracts from the previous week which had a total of 146,873 net contracts.
This week’s current strength score (the trader positioning range over the past three years, measured from 0 to 100) shows the speculators are currently Bullish-Extreme with a score of 100.0 percent. The commercials are Bearish-Extreme with a score of 0.0 percent and the small traders (not shown in chart) are Bearish with a score of 33.5 percent.
| SOYBEAN MEAL Futures Statistics | SPECULATORS | COMMERCIALS | SMALL TRADERS |
| – Percent of Open Interest Longs: | 42.1 | 34.9 | 10.4 |
| – Percent of Open Interest Shorts: | 3.4 | 78.4 | 5.6 |
| – Net Position: | 156,568 | -175,970 | 19,402 |
| – Gross Longs: | 170,218 | 141,313 | 42,222 |
| – Gross Shorts: | 13,650 | 317,283 | 22,820 |
| – Long to Short Ratio: | 12.5 to 1 | 0.4 to 1 | 1.9 to 1 |
| NET POSITION TREND: | |||
| – Strength Index Score (3 Year Range Pct): | 100.0 | 0.0 | 33.5 |
| – Strength Index Reading (3 Year Range): | Bullish-Extreme | Bearish-Extreme | Bearish |
| NET POSITION MOVEMENT INDEX: | |||
| – 6-Week Change in Strength Index: | 27.0 | -26.2 | -4.3 |
LIVE CATTLE Futures:
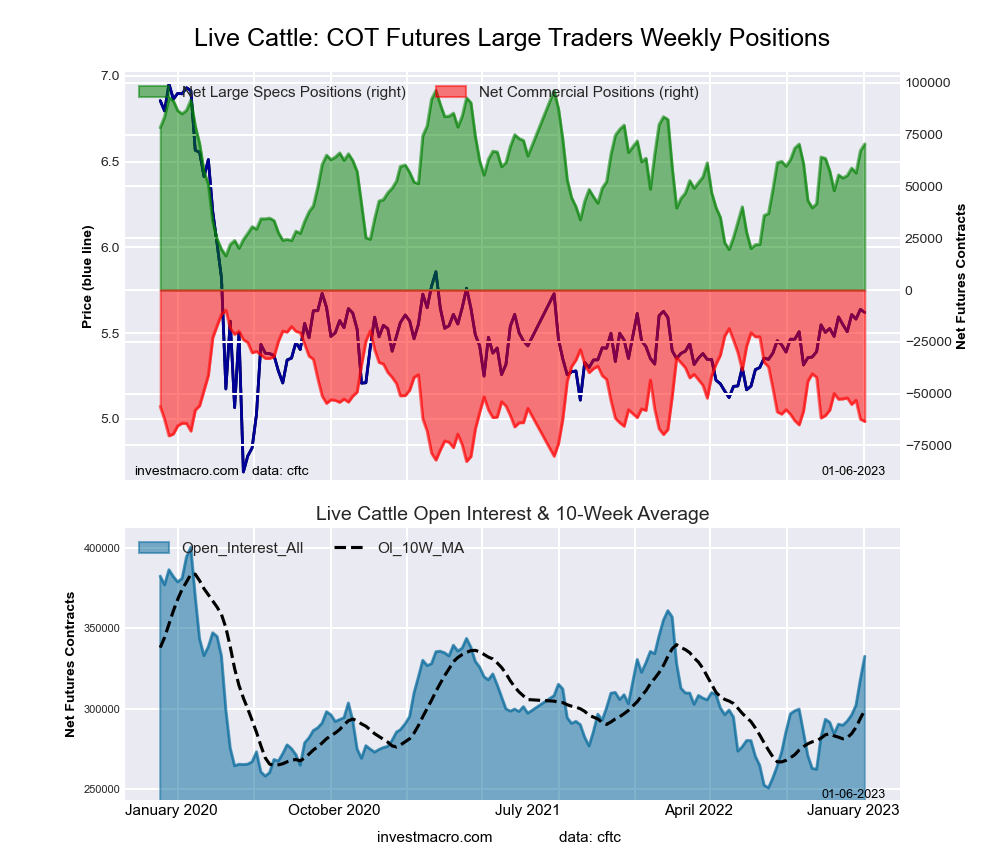 The LIVE CATTLE large speculator standing this week reached a net position of 70,489 contracts in the data reported through Tuesday. This was a weekly gain of 3,288 contracts from the previous week which had a total of 67,201 net contracts.
This week’s current strength score (the trader positioning range over the past three years, measured from 0 to 100) shows the speculators are currently Bullish with a score of 67.7 percent. The commercials are Bearish with a score of 26.5 percent and the small traders (not shown in chart) are Bullish with a score of 64.7 percent.
| LIVE CATTLE Futures Statistics | SPECULATORS | COMMERCIALS | SMALL TRADERS |
| – Percent of Open Interest Longs: | 38.8 | 29.3 | 9.1 |
| – Percent of Open Interest Shorts: | 17.6 | 48.3 | 11.3 |
| – Net Position: | 70,489 | -63,397 | -7,092 |
| – Gross Longs: | 129,128 | 97,353 | 30,372 |
| – Gross Shorts: | 58,639 | 160,750 | 37,464 |
| – Long to Short Ratio: | 2.2 to 1 | 0.6 to 1 | 0.8 to 1 |
| NET POSITION TREND: | |||
| – Strength Index Score (3 Year Range Pct): | 67.7 | 26.5 | 64.7 |
| – Strength Index Reading (3 Year Range): | Bullish | Bearish | Bullish |
| NET POSITION MOVEMENT INDEX: | |||
| – 6-Week Change in Strength Index: | 18.8 | -14.7 | -16.6 |
LEAN HOGS Futures:
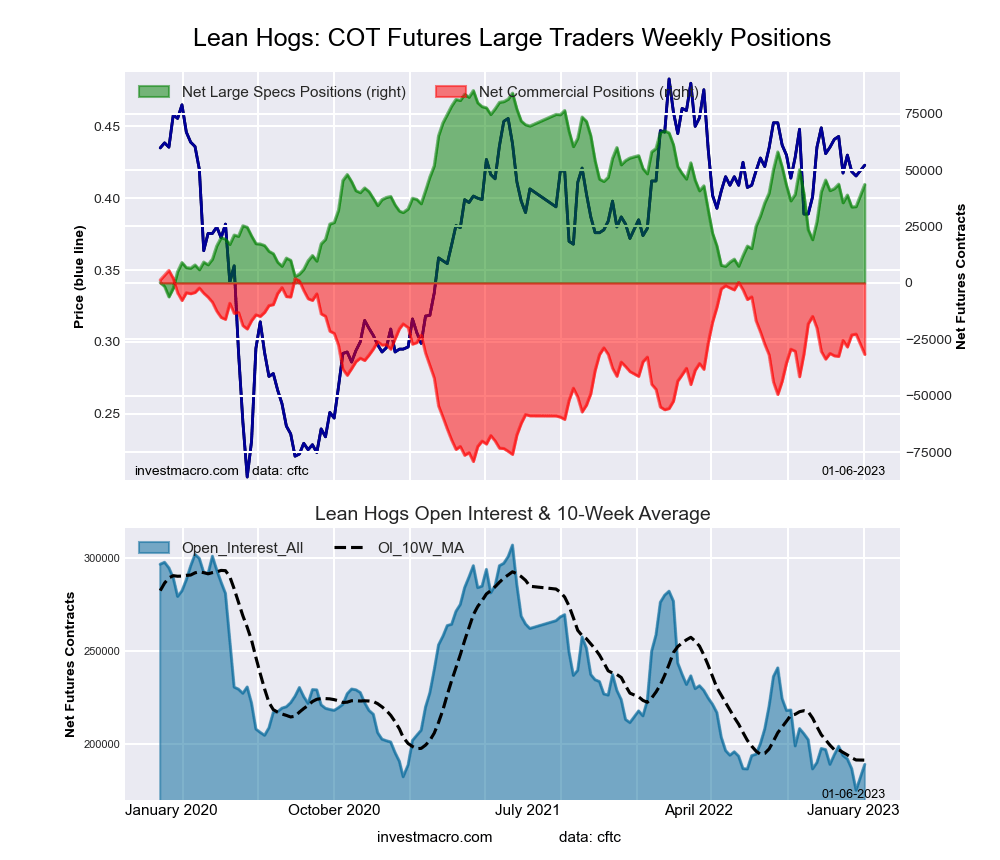 The LEAN HOGS large speculator standing this week reached a net position of 43,626 contracts in the data reported through Tuesday. This was a weekly decrease of -1,087 contracts from the previous week which had a total of 33,795 net contracts.
This week’s current strength score (the trader positioning range over the past three years, measured from 0 to 100) shows the speculators are currently Bearish with a score of 49.3 percent. The commercials are Bullish with a score of 58.6 percent and the small traders (not shown in chart) are Bearish with a score of 39.3 percent.
| LEAN HOGS Futures Statistics | SPECULATORS | COMMERCIALS | SMALL TRADERS |
| – Percent of Open Interest Longs: | 39.1 | 36.2 | 7.7 |
| – Percent of Open Interest Shorts: | 16.0 | 52.9 | 14.0 |
| – Net Position: | 43,626 | -31,671 | -11,955 |
| – Gross Longs: | 73,833 | 68,295 | 14,524 |
| – Gross Shorts: | 30,207 | 99,966 | 26,479 |
| – Long to Short Ratio: | 2.4 to 1 | 0.7 to 1 | 0.5 to 1 |
| NET POSITION TREND: | |||
| – Strength Index Score (3 Year Range Pct): | 49.3 | 58.6 | 39.3 |
| – Strength Index Reading (3 Year Range): | Bearish | Bullish | Bearish |
| NET POSITION MOVEMENT INDEX: | |||
| – 6-Week Change in Strength Index: | -0.1 | 1.1 | -4.5 |
COTTON Futures:
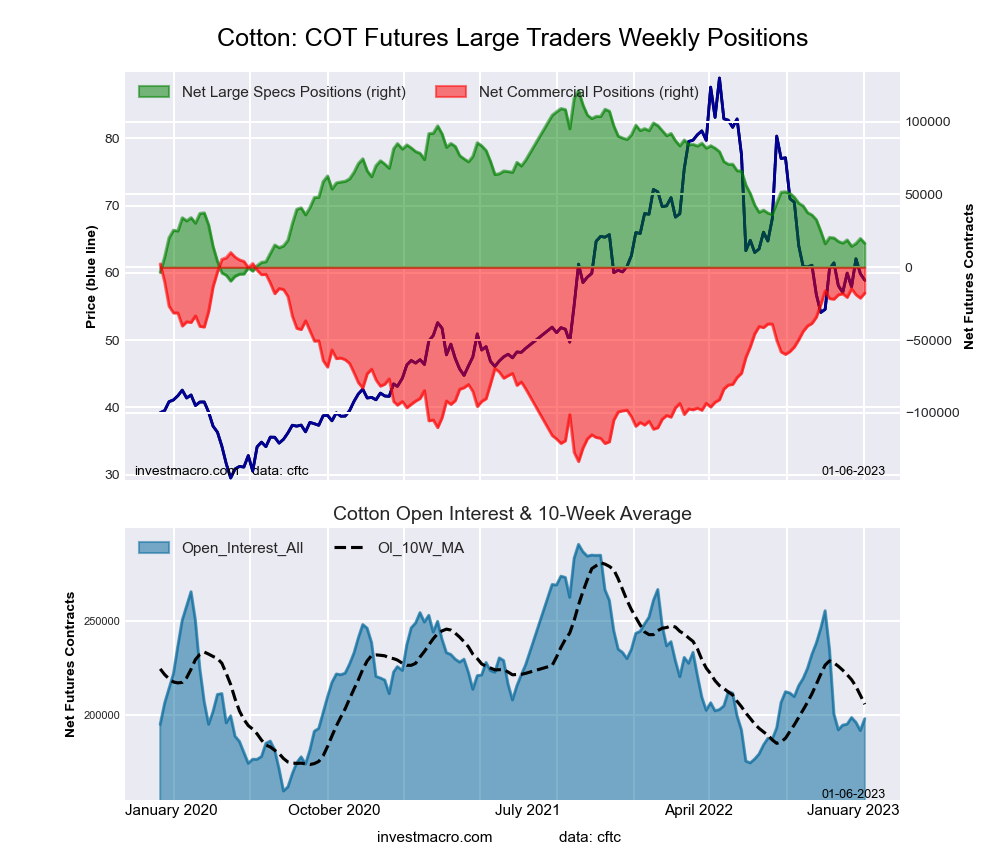 The COTTON large speculator standing this week reached a net position of 16,459 contracts in the data reported through Tuesday. This was a weekly decline of -3,250 contracts from the previous week which had a total of 19,709 net contracts.
This week’s current strength score (the trader positioning range over the past three years, measured from 0 to 100) shows the speculators are currently Bearish-Extreme with a score of 19.8 percent. The commercials are Bullish-Extreme with a score of 80.6 percent and the small traders (not shown in chart) are Bearish-Extreme with a score of 18.2 percent.
| COTTON Futures Statistics | SPECULATORS | COMMERCIALS | SMALL TRADERS |
| – Percent of Open Interest Longs: | 29.9 | 50.2 | 6.7 |
| – Percent of Open Interest Shorts: | 21.6 | 59.1 | 6.0 |
| – Net Position: | 16,459 | -17,685 | 1,226 |
| – Gross Longs: | 59,178 | 99,292 | 13,198 |
| – Gross Shorts: | 42,719 | 116,977 | 11,972 |
| – Long to Short Ratio: | 1.4 to 1 | 0.8 to 1 | 1.1 to 1 |
| NET POSITION TREND: | |||
| – Strength Index Score (3 Year Range Pct): | 19.8 | 80.6 | 18.2 |
| – Strength Index Reading (3 Year Range): | Bearish-Extreme | Bullish-Extreme | Bearish-Extreme |
| NET POSITION MOVEMENT INDEX: | |||
| – 6-Week Change in Strength Index: | -1.0 | 0.8 | 0.3 |
COCOA Futures:
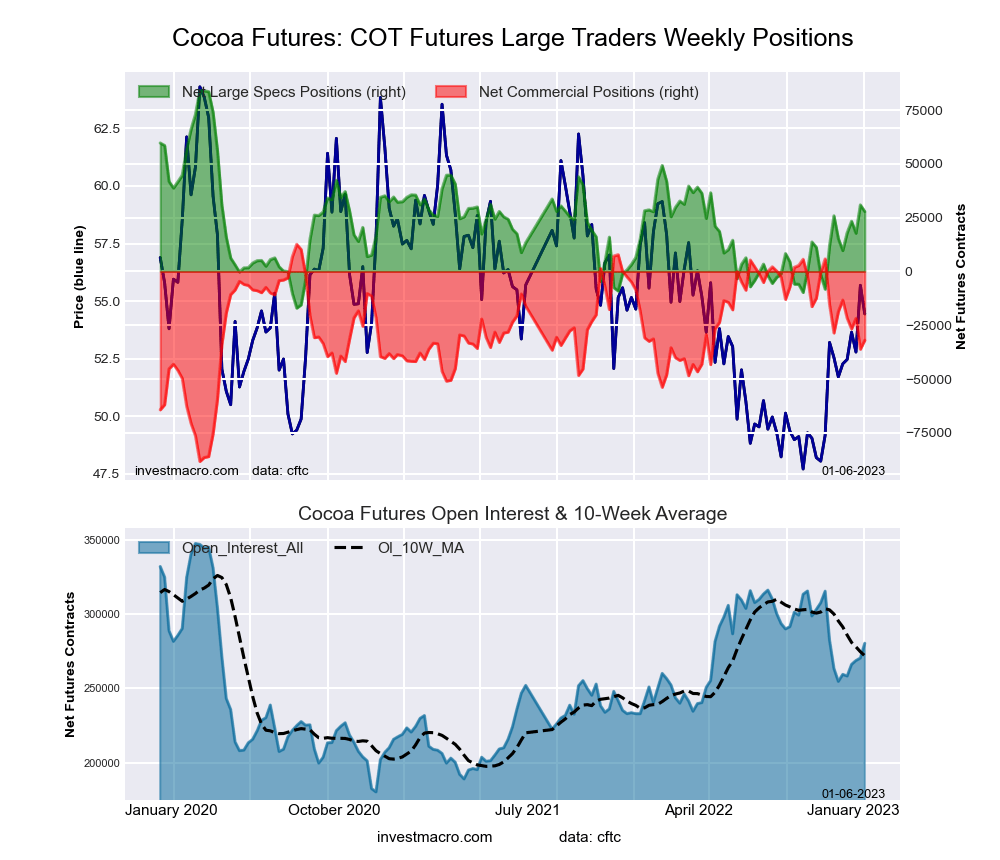 The COCOA large speculator standing this week reached a net position of 27,838 contracts in the data reported through Tuesday. This was a weekly decrease of -3,065 contracts from the previous week which had a total of 30,903 net contracts.
This week’s current strength score (the trader positioning range over the past three years, measured from 0 to 100) shows the speculators are currently Bearish with a score of 44.4 percent. The commercials are Bullish with a score of 55.8 percent and the small traders (not shown in chart) are Bearish with a score of 38.0 percent.
| COCOA Futures Statistics | SPECULATORS | COMMERCIALS | SMALL TRADERS |
| – Percent of Open Interest Longs: | 31.4 | 43.5 | 4.6 |
| – Percent of Open Interest Shorts: | 21.5 | 54.9 | 3.2 |
| – Net Position: | 27,838 | -31,978 | 4,140 |
| – Gross Longs: | 87,974 | 121,844 | 12,987 |
| – Gross Shorts: | 60,136 | 153,822 | 8,847 |
| – Long to Short Ratio: | 1.5 to 1 | 0.8 to 1 | 1.5 to 1 |
| NET POSITION TREND: | |||
| – Strength Index Score (3 Year Range Pct): | 44.4 | 55.8 | 38.0 |
| – Strength Index Reading (3 Year Range): | Bearish | Bullish | Bearish |
| NET POSITION MOVEMENT INDEX: | |||
| – 6-Week Change in Strength Index: | 12.4 | -13.1 | 7.1 |
WHEAT Futures:
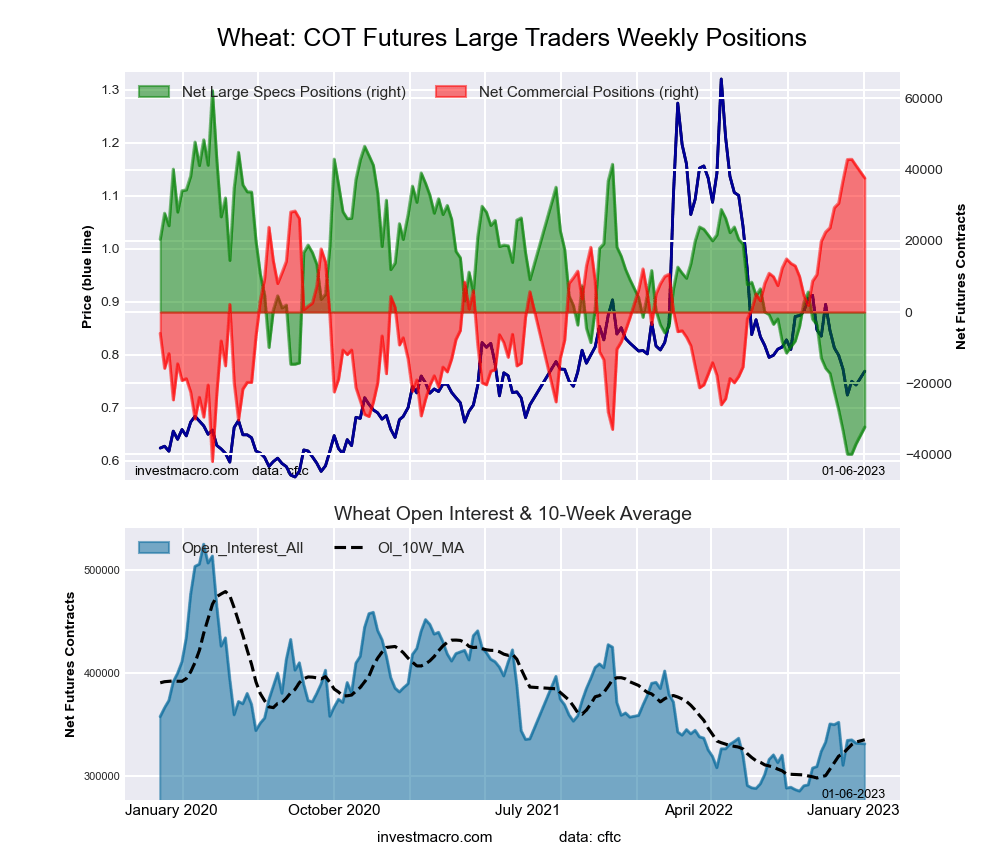 The WHEAT large speculator standing this week reached a net position of -32,291 contracts in the data reported through Tuesday. This was a weekly gain of 3,998 contracts from the previous week which had a total of -36,984 net contracts.
This week’s current strength score (the trader positioning range over the past three years, measured from 0 to 100) shows the speculators are currently Bearish-Extreme with a score of 7.5 percent. The commercials are Bullish-Extreme with a score of 93.8 percent and the small traders (not shown in chart) are Bullish-Extreme with a score of 82.7 percent.
| WHEAT Futures Statistics | SPECULATORS | COMMERCIALS | SMALL TRADERS |
| – Percent of Open Interest Longs: | 25.5 | 42.8 | 9.2 |
| – Percent of Open Interest Shorts: | 35.3 | 31.5 | 10.8 |
| – Net Position: | -32,291 | 37,636 | -5,345 |
| – Gross Longs: | 84,689 | 141,962 | 30,370 |
| – Gross Shorts: | 116,980 | 104,326 | 35,715 |
| – Long to Short Ratio: | 0.7 to 1 | 1.4 to 1 | 0.9 to 1 |
| NET POSITION TREND: | |||
| – Strength Index Score (3 Year Range Pct): | 7.5 | 93.8 | 82.7 |
| – Strength Index Reading (3 Year Range): | Bearish-Extreme | Bullish-Extreme | Bullish-Extreme |
| NET POSITION MOVEMENT INDEX: | |||
| – 6-Week Change in Strength Index: | -4.7 | 8.3 | -11.8 |
Article By InvestMacro – Receive our weekly COT Newsletter
*COT Report: The COT data, released weekly to the public each Friday, is updated through the most recent Tuesday (data is 3 days old) and shows a quick view of how large speculators or non-commercials (for-profit traders) were positioned in the futures markets.
The CFTC categorizes trader positions according to commercial hedgers (traders who use futures contracts for hedging as part of the business), non-commercials (large traders who speculate to realize trading profits) and nonreportable traders (usually small traders/speculators) as well as their open interest (contracts open in the market at time of reporting). See CFTC criteria here.

- Geopolitical and macroeconomic conditions continue to pressure market sentiment Jul 20, 2026
- USD/JPY Poised to Continue Gains as Expensive Oil and Lack of Support Weigh on Yen Jul 20, 2026
- COT Metals Charts: Weekly Speculator Bets led by Copper & Steel Jul 18, 2026
- COT Bonds Charts: Weekly Speculator Bets led by 2-Year, SOFR 3M & 5-Year Bonds Jul 18, 2026
- COT Energy Charts: Weekly Speculator Bets led by Brent Oil & Heating Oil Jul 18, 2026
- COT Soft Commodities Charts: Weekly Speculator Bets led by Wheat, Corn & Soybean Meal Jul 18, 2026
- The Bank of Canada kept its interest rate unchanged. Platinum prices reached a three‑week high Jul 16, 2026
- Stock indices rose after the release of US inflation data. China’s GDP slowed sharply Jul 15, 2026
- GBP/USD Awaits Political News: What Will Happen Next Jul 15, 2026
- USD/JPY Holds at Highs: Pressure Lingers on Yen Jul 14, 2026