
By InvestMacro
Here are the latest charts and statistics for the Commitment of Traders (COT) reports data published by the Commodities Futures Trading Commission (CFTC).
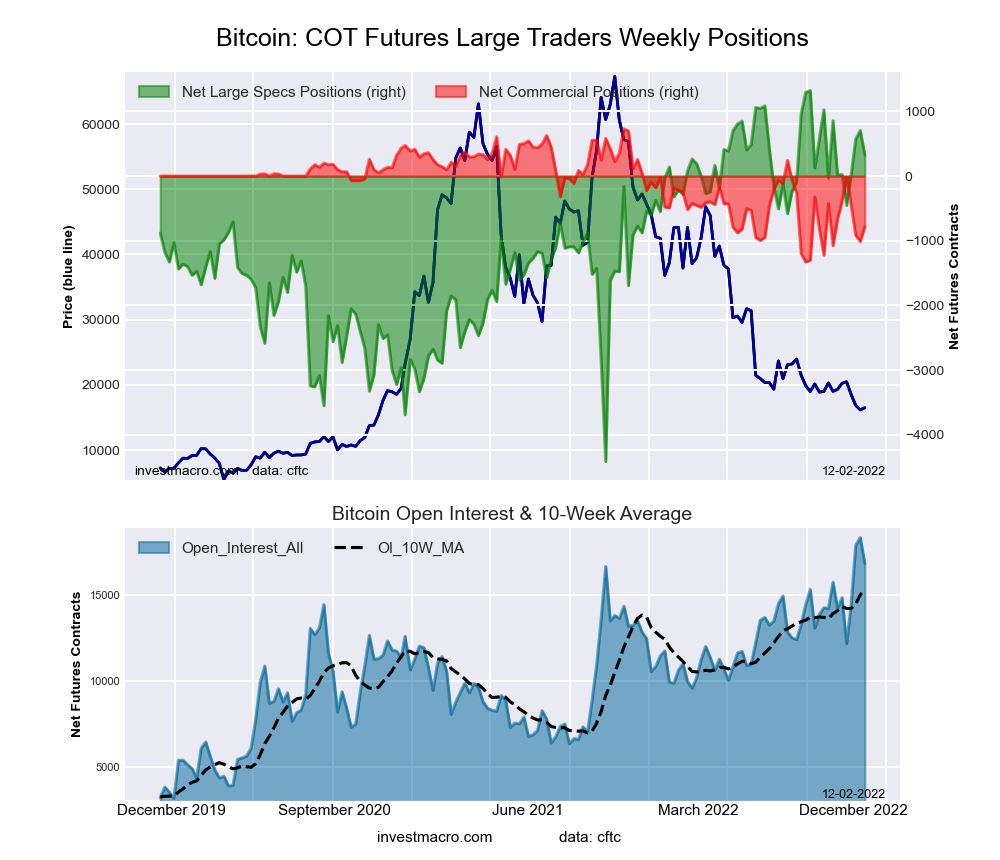
The latest COT data is updated through Tuesday December 6th and shows a quick view of how large traders (for-profit speculators and commercial hedgers) were positioned in the futures markets.
5-Year, 10-Year drops lead the Weekly Speculator Changes
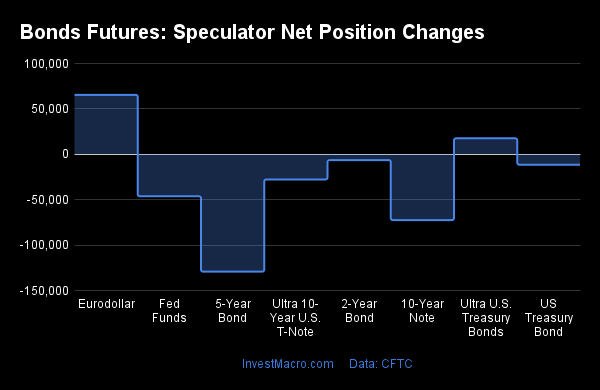
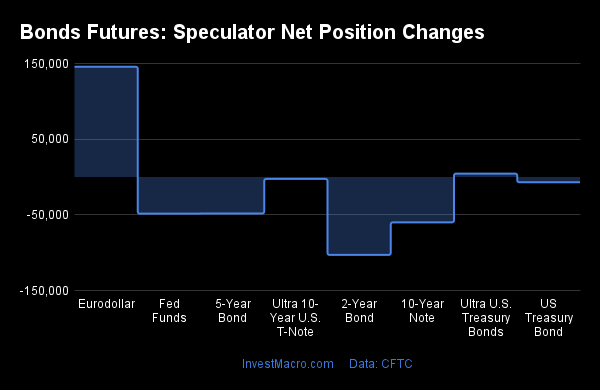
The COT bond market speculator bets were lower this week as just two out of the eight bond markets we cover had higher positioning this week while six markets had lower contracts.
Leading the weekly gains for the bond markets was the Eurodollar (65,490 contracts) with the Ultra US Bond (17,631 contracts) also showing a positive week.
The bond markets leading the weekly declines in speculator bets this week was the 5-Year Bond (-129,257 contracts) with the 10-Year Bond (-72,434 contracts), the Fed Funds (-46,249 contracts), the Ultra 10-Year (-27,703 contracts), the Long US Bond (-11,444 contracts) and the 2-Year Bond (-6,362 contracts) also registering lower bets on the week.
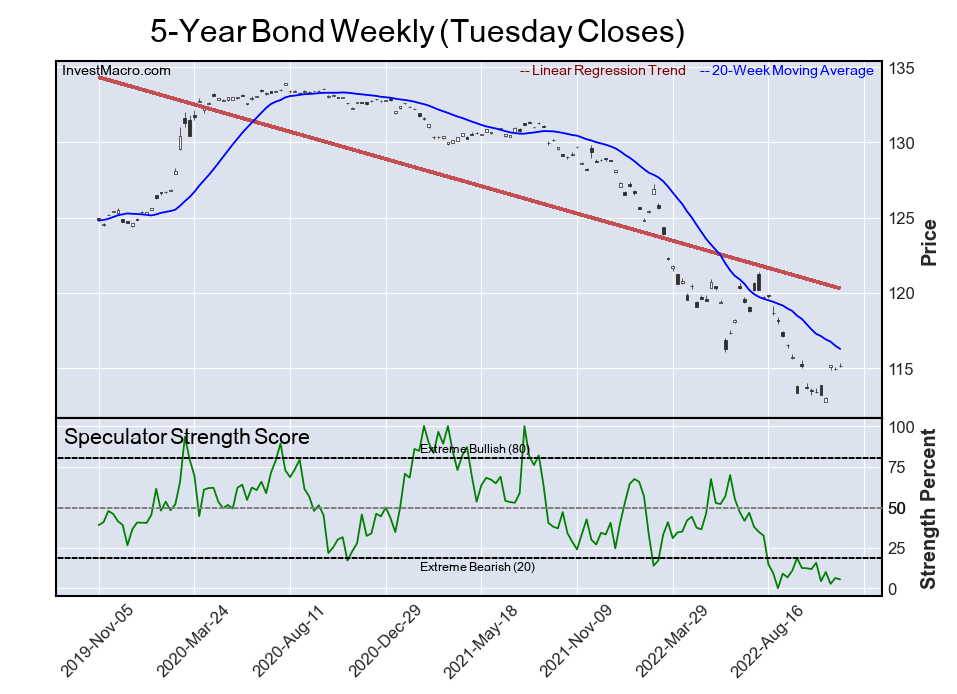
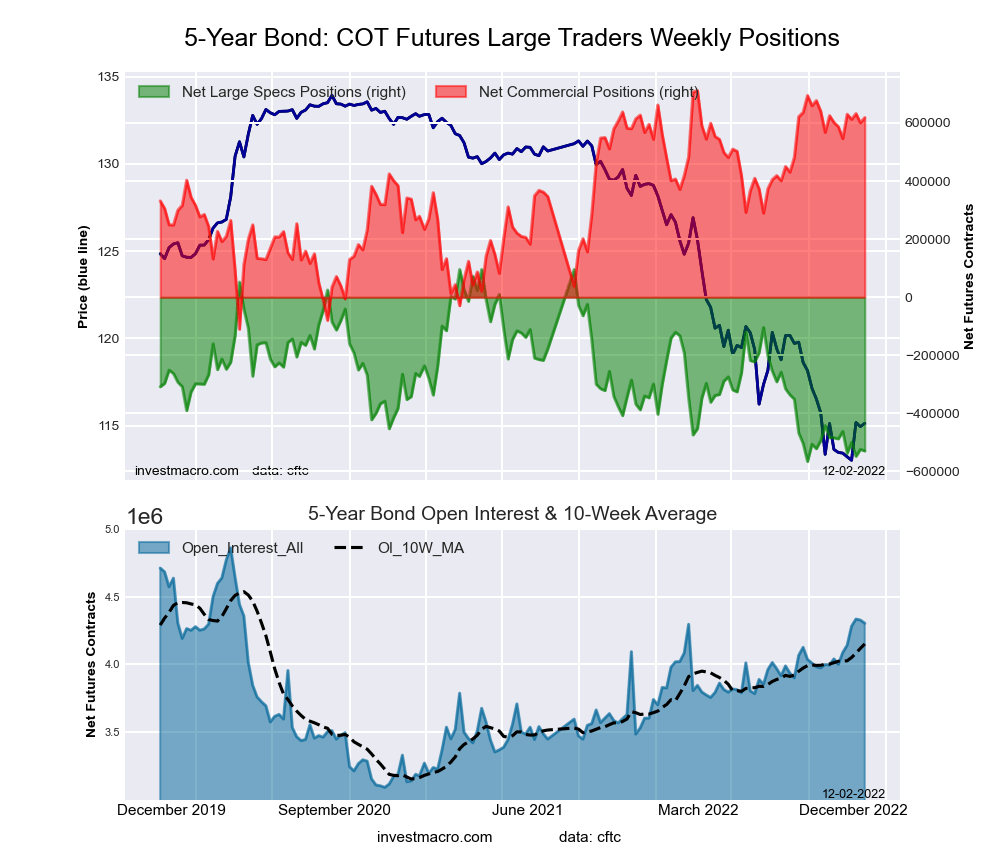
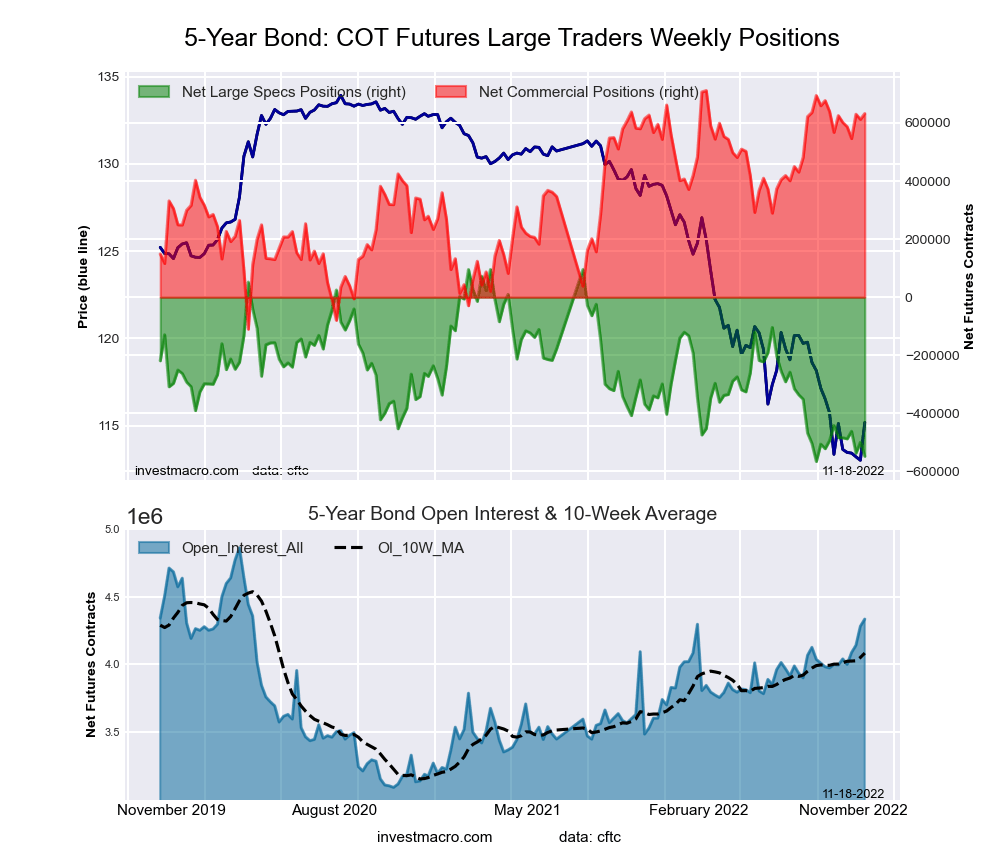
Highlighting the COT bonds data this week is the further decrease in speculator positions for the 5-Year Bonds market. The large speculator position in 5-Year Bonds futures fell this week by the largest one-week amount (-129,257 contracts) since February and have now dropped for the third time out of the past four weeks (a total decline of -159,151 contracts over last 4-week period). This weakness in speculator bets for the 5-Year Bond has brought the overall level to its most bearish point of the past 215 weeks. The last time the 5-Year Bond bets were this bearish was October 23rd of 2018 with a total of -773,639 contracts at that time. Despite the speculator weakness, the 5-Year Bond future prices have come off their November lows and touched their highest level since September this week.
| Dec-06-2022 | OI | OI-Index | Spec-Net | Spec-Index | Com-Net | COM-Index | Smalls-Net | Smalls-Index |
|---|---|---|---|---|---|---|---|---|
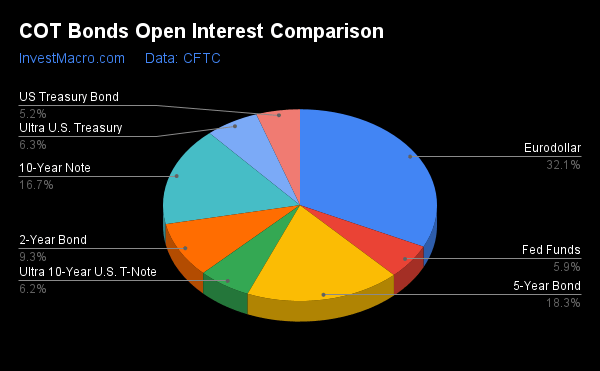
| Eurodollar | 7,263,670 | 0 | -1,643,862 | 23 | 1,944,031 | 76 | -300,169 | 38 |
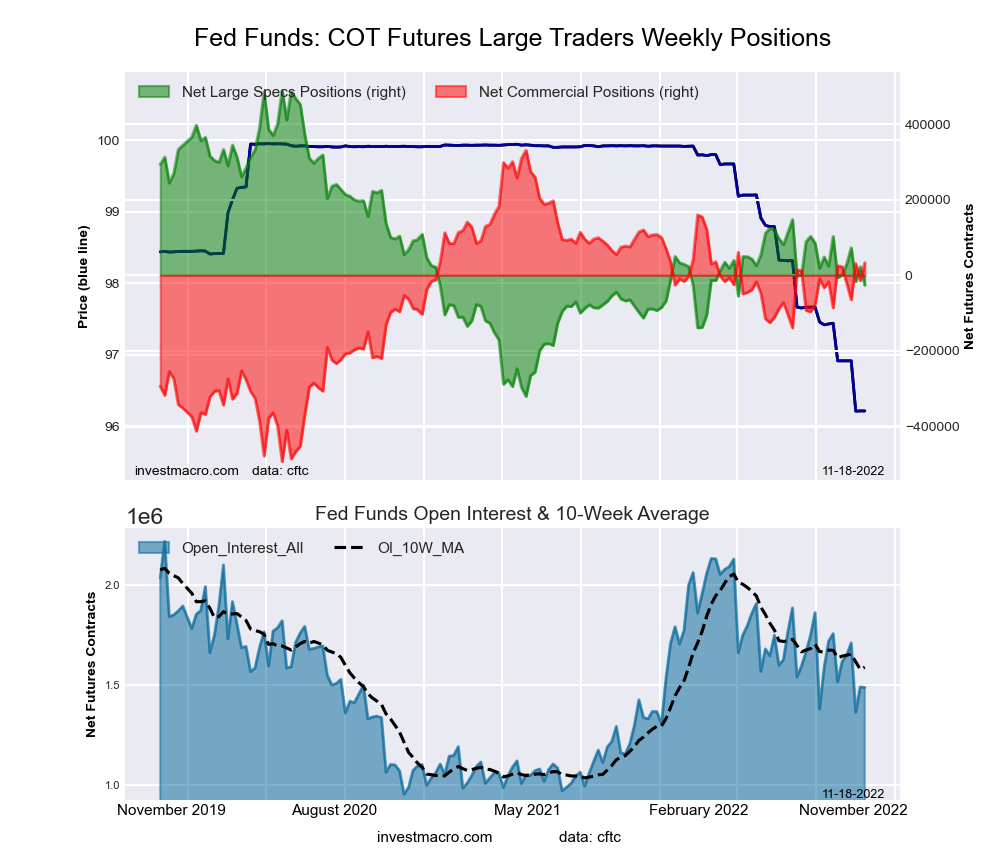
| FedFunds | 1,323,028 | 31 | -78,867 | 30 | 87,745 | 71 | -8,878 | 37 |
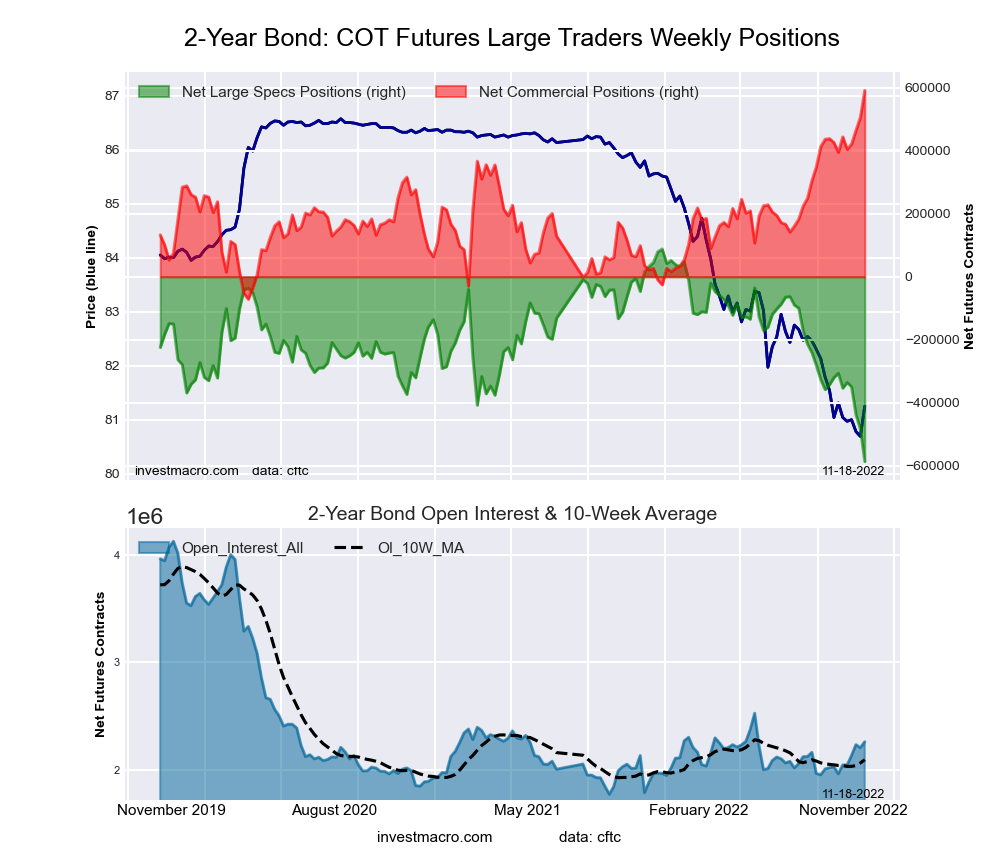
| 2-Year | 2,109,988 | 15 | -534,540 | 8 | 529,893 | 91 | 4,647 | 54 |
| Long T-Bond | 1,170,663 | 37 | -115,361 | 47 | 90,700 | 43 | 24,661 | 72 |
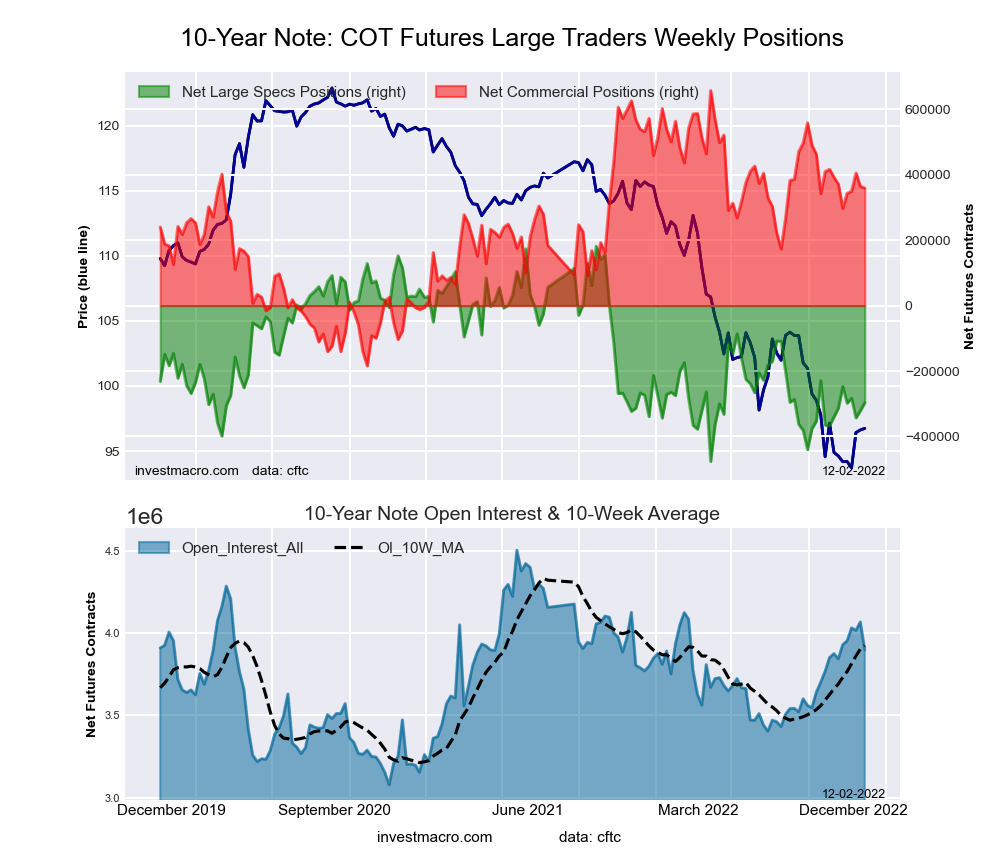
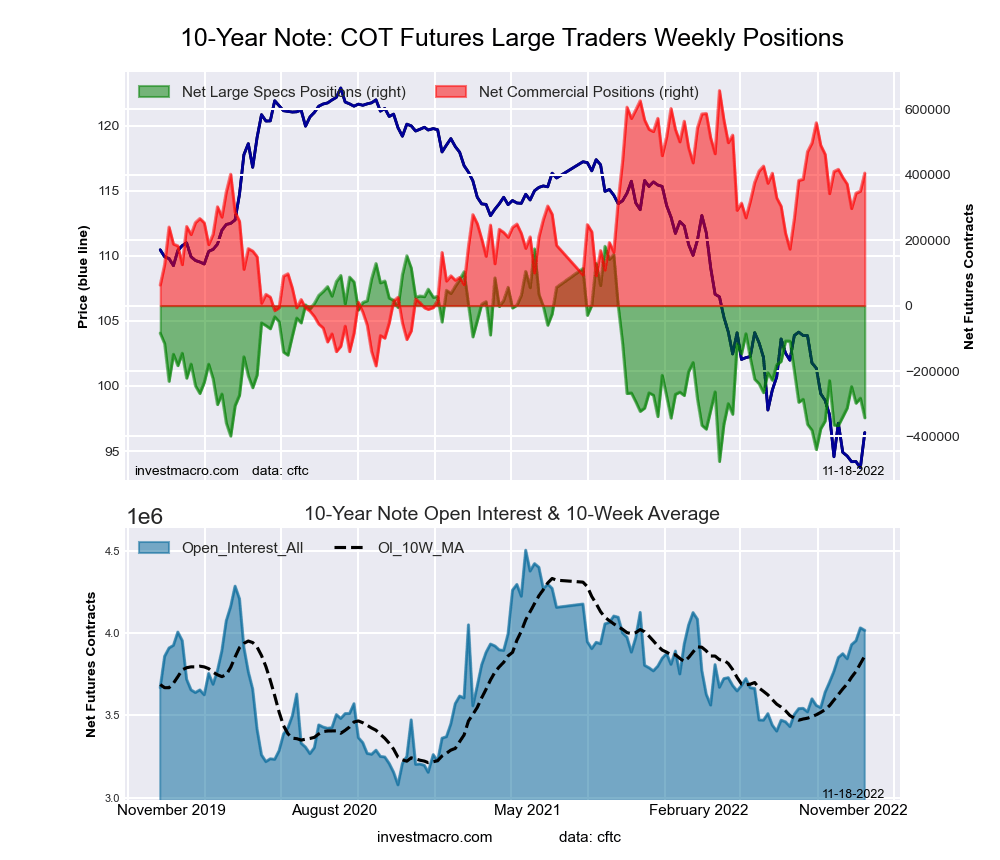
| 10-Year | 3,775,431 | 49 | -369,206 | 16 | 483,149 | 79 | -113,943 | 53 |
| 5-Year | 4,130,322 | 59 | -658,606 | 0 | 770,224 | 100 | -111,618 | 50 |
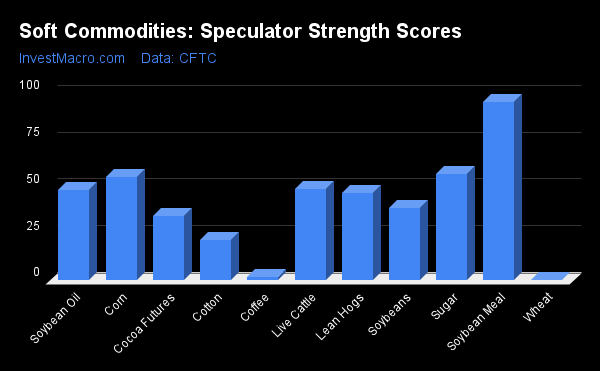
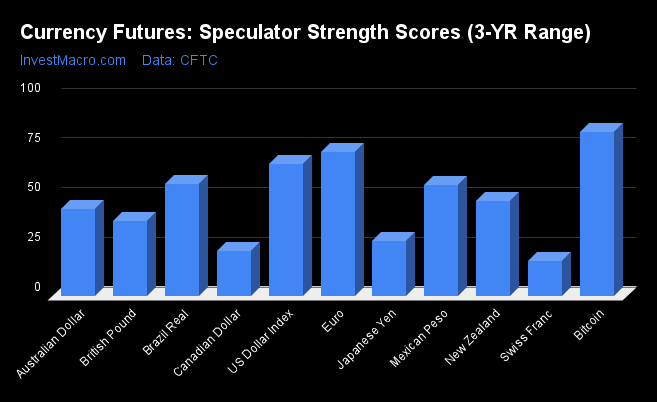
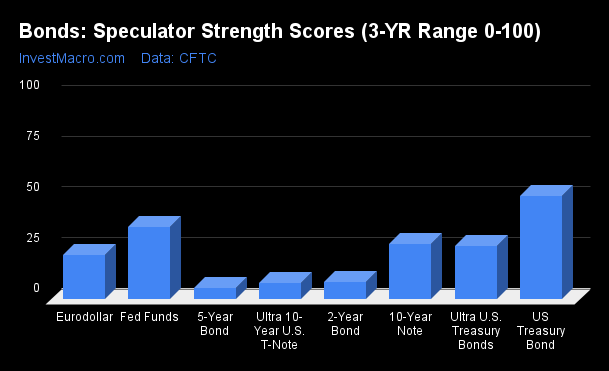
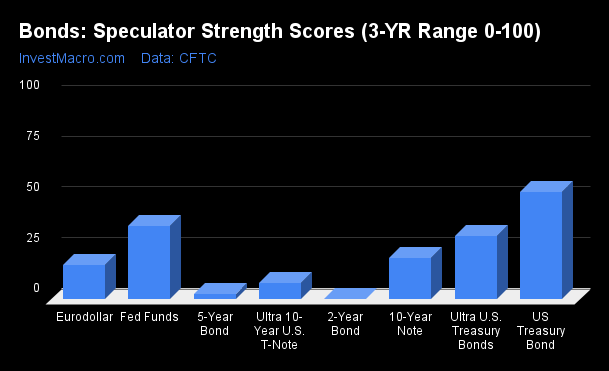
Strength Scores led by US Treasury Bond
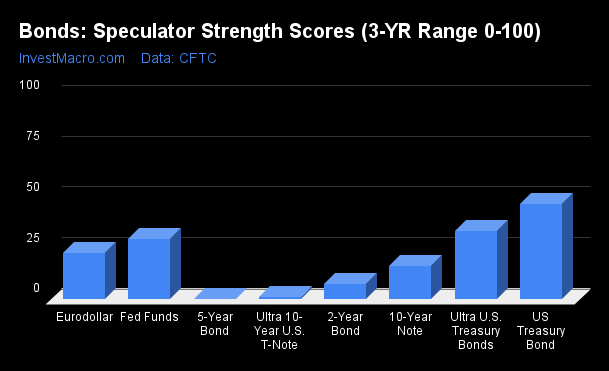
Strength Scores (a normalized measure of Speculator positions over a 3-Year range, from 0 to 100 where above 80 is extreme bullish and below 20 is extreme bearish) show that the US Treasury Bond (47.0 percent) leads the bonds category.
On the downside, the 5-Year Bond (0.0 percent), the Ultra 10-Year Bond (1.0 percent), the 2-Year Bond (7.7 percent) and the 10-Year Bond (16.3 percent) come in at the lowest strength levels currently and are all in Extreme-Bearish levels (below 20 percent).
Strength Statistics:
Fed Funds (29.9 percent) vs Fed Funds previous week (35.6 percent)
2-Year Bond (7.7 percent) vs 2-Year Bond previous week (8.6 percent)
5-Year Bond (0.0 percent) vs 5-Year Bond previous week (17.1 percent)
10-Year Bond (16.3 percent) vs 10-Year Bond previous week (27.3 percent)
Ultra 10-Year Bond (1.0 percent) vs Ultra 10-Year Bond previous week (8.2 percent)
US Treasury Bond (47.0 percent) vs US Treasury Bond previous week (50.8 percent)
Ultra US Treasury Bond (33.5 percent) vs Ultra US Treasury Bond previous week (26.3 percent)
Eurodollar (22.9 percent) vs Eurodollar previous week (21.7 percent)
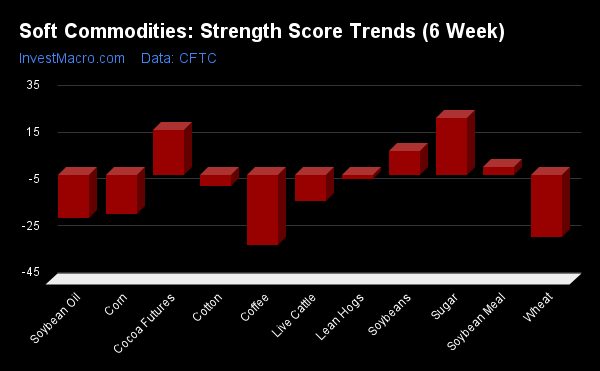
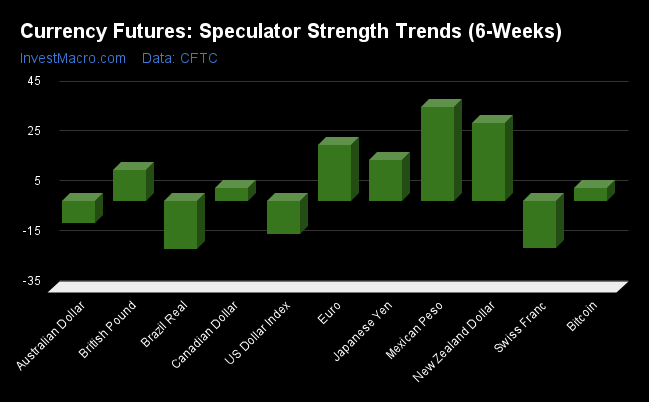
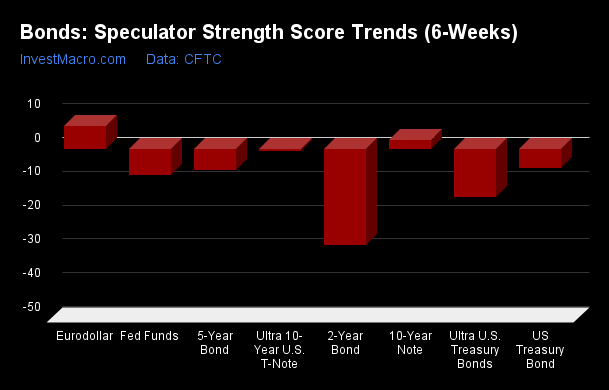
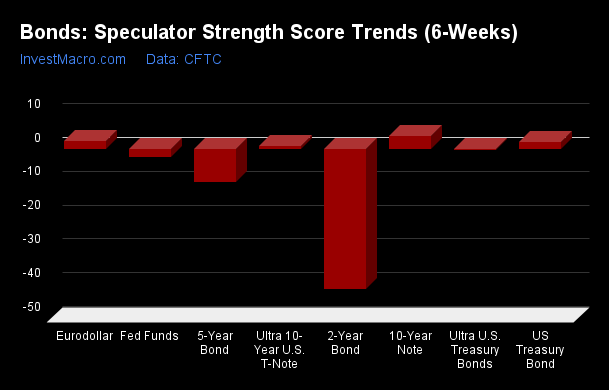
Eurodollar tops Strength Trends
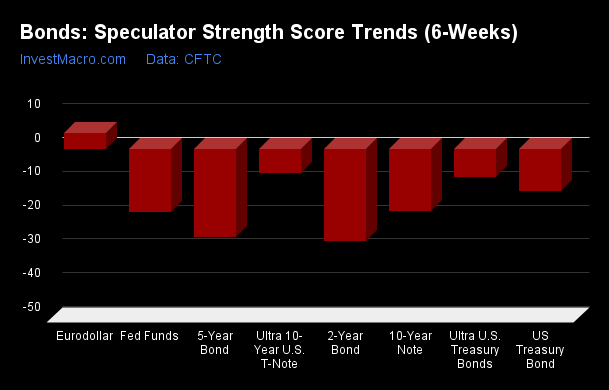
Strength Score Trends (or move index, calculates the 6-week changes in strength scores) showed that the Eurodollar (4.7 percent) leads the past six weeks trends for bonds this week and is the only positive mover in the latest trends data.
The 2-Year Bond (-27.4 percent), the 5-Year Bond (-26.1 percent), the Fed Funds (-18.7 percent) and the 10-Year Bond (-18.5 percent) lead the downside trend scores this week.
Strength Trend Statistics:
Fed Funds (-18.7 percent) vs Fed Funds previous week (-7.7 percent)
2-Year Bond (-27.4 percent) vs 2-Year Bond previous week (-28.6 percent)
5-Year Bond (-26.1 percent) vs 5-Year Bond previous week (-5.5 percent)
10-Year Bond (-18.5 percent) vs 10-Year Bond previous week (2.5 percent)
Ultra 10-Year Bond (-7.2 percent) vs Ultra 10-Year Bond previous week (-0.7 percent)
US Treasury Bond (-12.6 percent) vs US Treasury Bond previous week (-5.7 percent)
Ultra US Treasury Bond (-8.5 percent) vs Ultra US Treasury Bond previous week (-14.2 percent)
Eurodollar (4.7 percent) vs Eurodollar previous week (6.8 percent)
Individual Bond Markets:
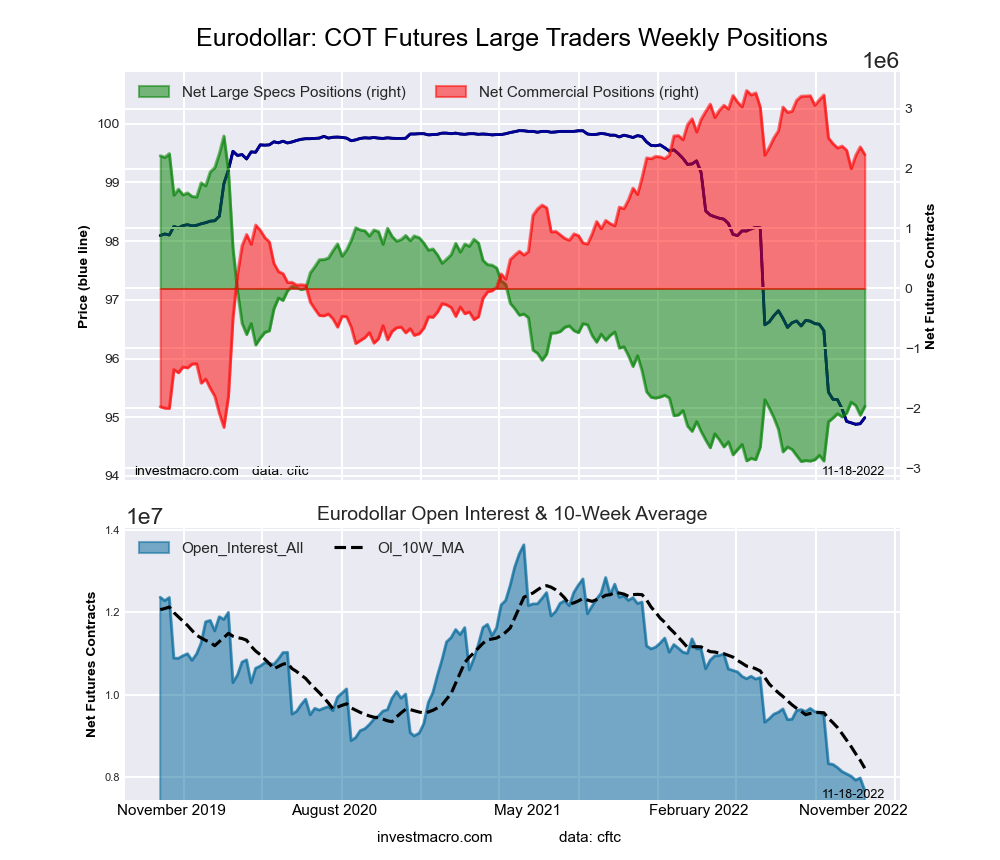
3-Month Eurodollars Futures:
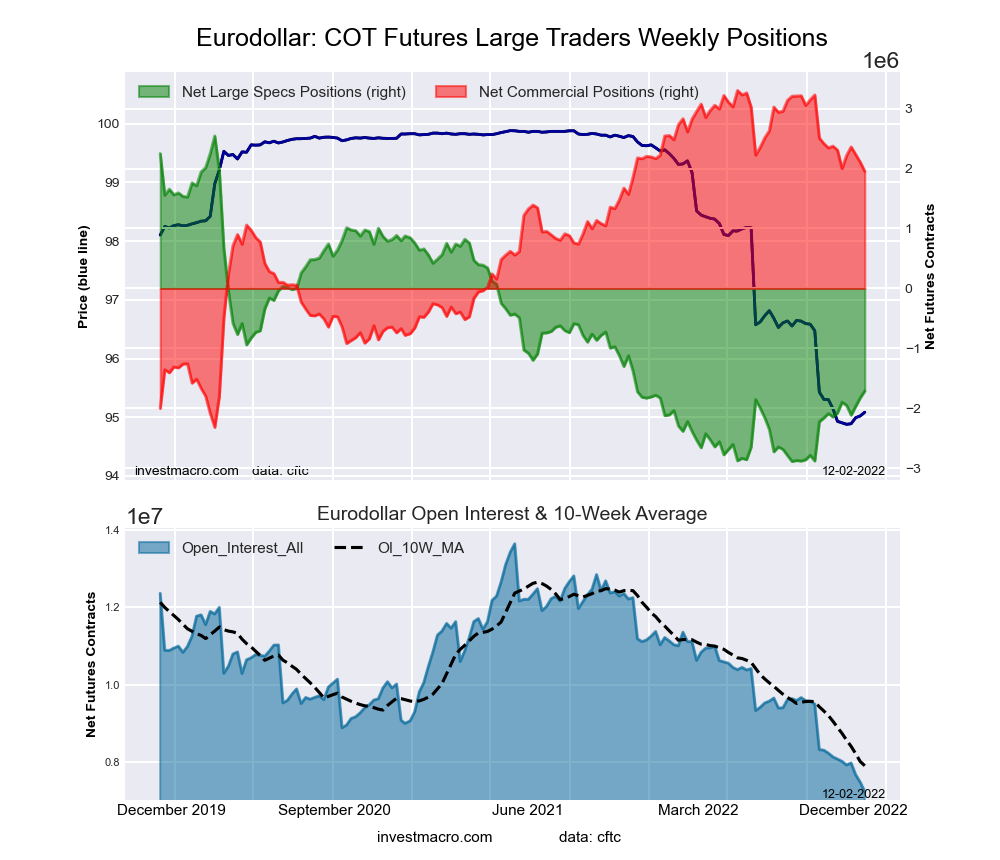
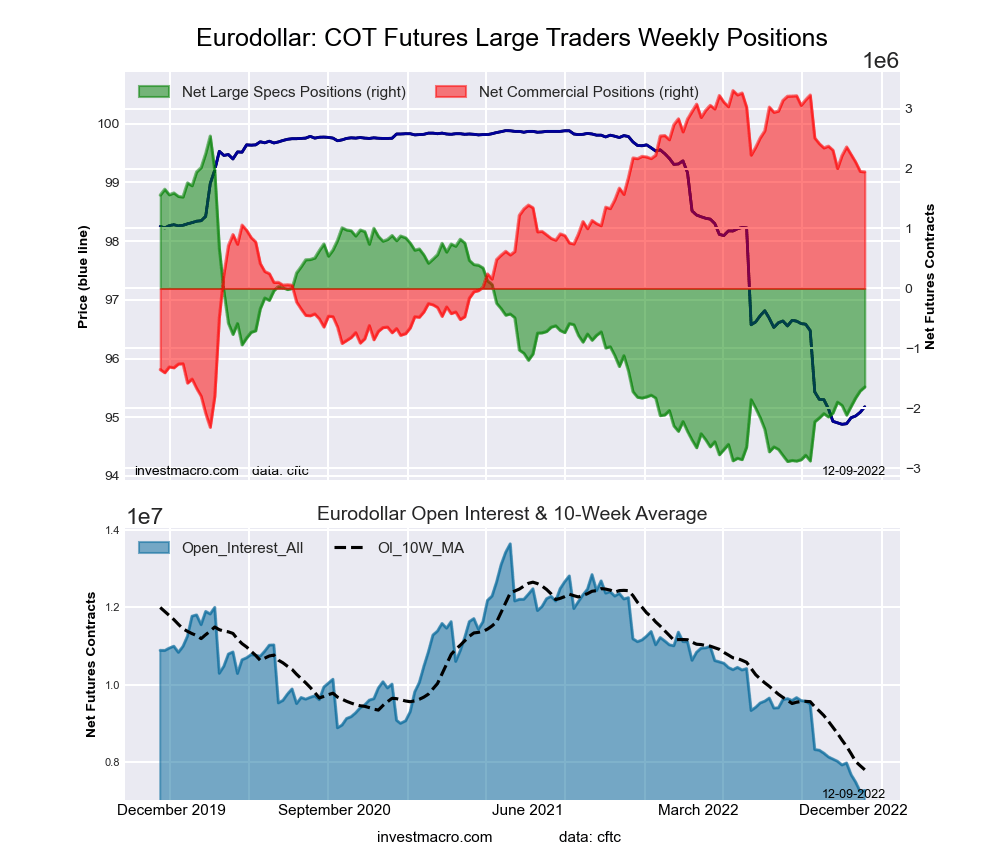 The 3-Month Eurodollars large speculator standing this week recorded a net position of -1,643,862 contracts in the data reported through Tuesday. This was a weekly rise of 65,490 contracts from the previous week which had a total of -1,709,352 net contracts.
This week’s current strength score (the trader positioning range over the past three years, measured from 0 to 100) shows the speculators are currently Bearish with a score of 22.9 percent. The commercials are Bullish with a score of 75.8 percent and the small traders (not shown in chart) are Bearish with a score of 38.4 percent.
| 3-Month Eurodollars Statistics | SPECULATORS | COMMERCIALS | SMALL TRADERS |
| – Percent of Open Interest Longs: | 7.6 | 69.4 | 4.9 |
| – Percent of Open Interest Shorts: | 30.2 | 42.6 | 9.0 |
| – Net Position: | -1,643,862 | 1,944,031 | -300,169 |
| – Gross Longs: | 548,998 | 5,041,684 | 353,408 |
| – Gross Shorts: | 2,192,860 | 3,097,653 | 653,577 |
| – Long to Short Ratio: | 0.3 to 1 | 1.6 to 1 | 0.5 to 1 |
| NET POSITION TREND: | |||
| – Strength Index Score (3 Year Range Pct): | 22.9 | 75.8 | 38.4 |
| – Strength Index Reading (3 Year Range): | Bearish | Bullish | Bearish |
| NET POSITION MOVEMENT INDEX: | |||
| – 6-Week Change in Strength Index: | 4.7 | -1.0 | -43.2 |
30-Day Federal Funds Futures:
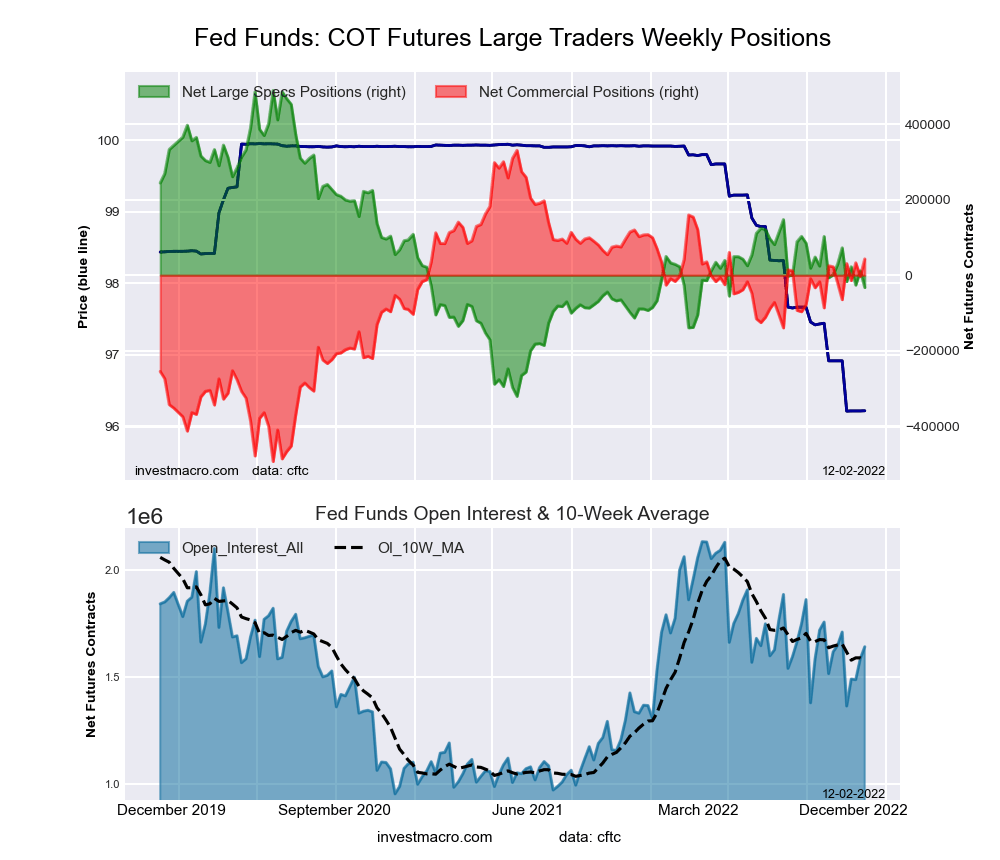
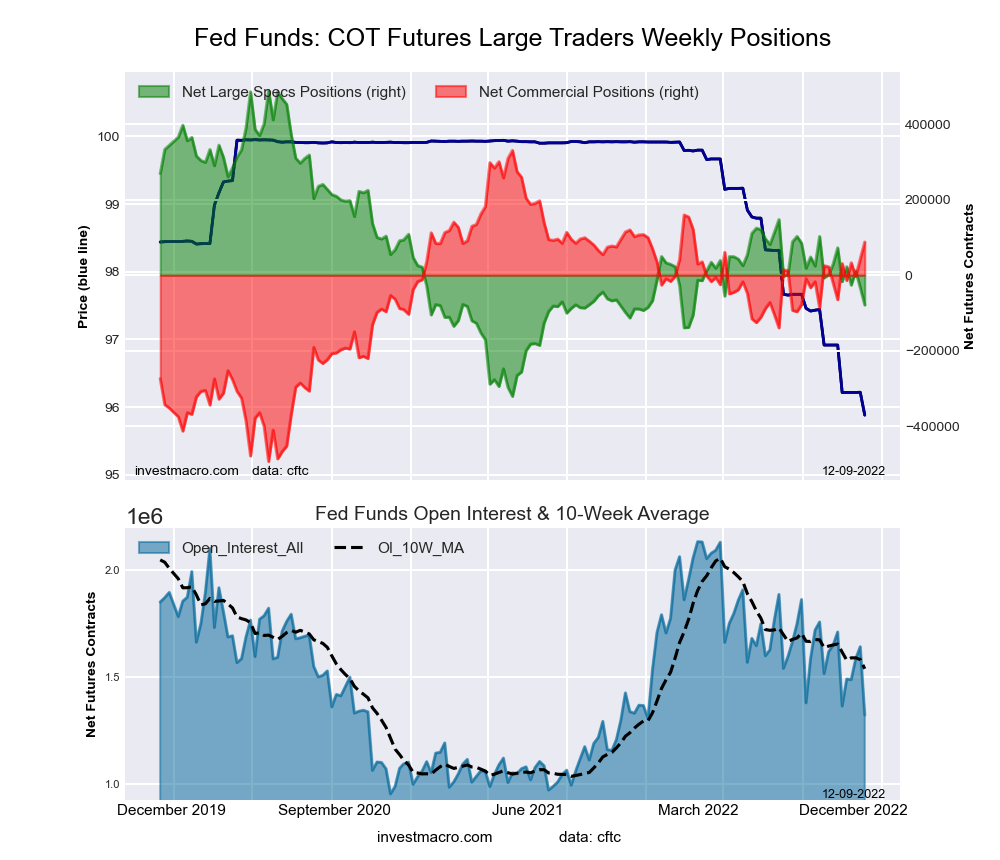 The 30-Day Federal Funds large speculator standing this week recorded a net position of -78,867 contracts in the data reported through Tuesday. This was a weekly reduction of -46,249 contracts from the previous week which had a total of -32,618 net contracts.
This week’s current strength score (the trader positioning range over the past three years, measured from 0 to 100) shows the speculators are currently Bearish with a score of 29.9 percent. The commercials are Bullish with a score of 70.5 percent and the small traders (not shown in chart) are Bearish with a score of 37.0 percent.
| 30-Day Federal Funds Statistics | SPECULATORS | COMMERCIALS | SMALL TRADERS |
| – Percent of Open Interest Longs: | 8.7 | 78.6 | 2.3 |
| – Percent of Open Interest Shorts: | 14.6 | 71.9 | 2.9 |
| – Net Position: | -78,867 | 87,745 | -8,878 |
| – Gross Longs: | 114,699 | 1,039,303 | 30,010 |
| – Gross Shorts: | 193,566 | 951,558 | 38,888 |
| – Long to Short Ratio: | 0.6 to 1 | 1.1 to 1 | 0.8 to 1 |
| NET POSITION TREND: | |||
| – Strength Index Score (3 Year Range Pct): | 29.9 | 70.5 | 37.0 |
| – Strength Index Reading (3 Year Range): | Bearish | Bullish | Bearish |
| NET POSITION MOVEMENT INDEX: | |||
| – 6-Week Change in Strength Index: | -18.7 | 18.5 | -3.5 |
2-Year Treasury Note Futures:
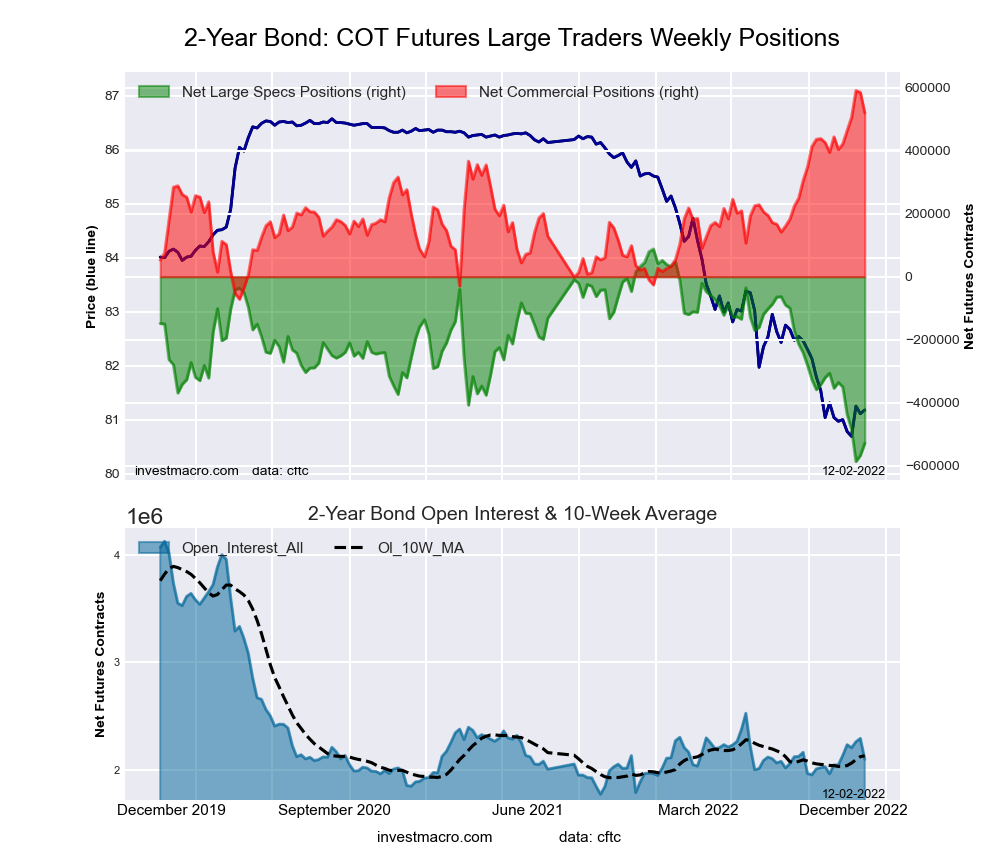
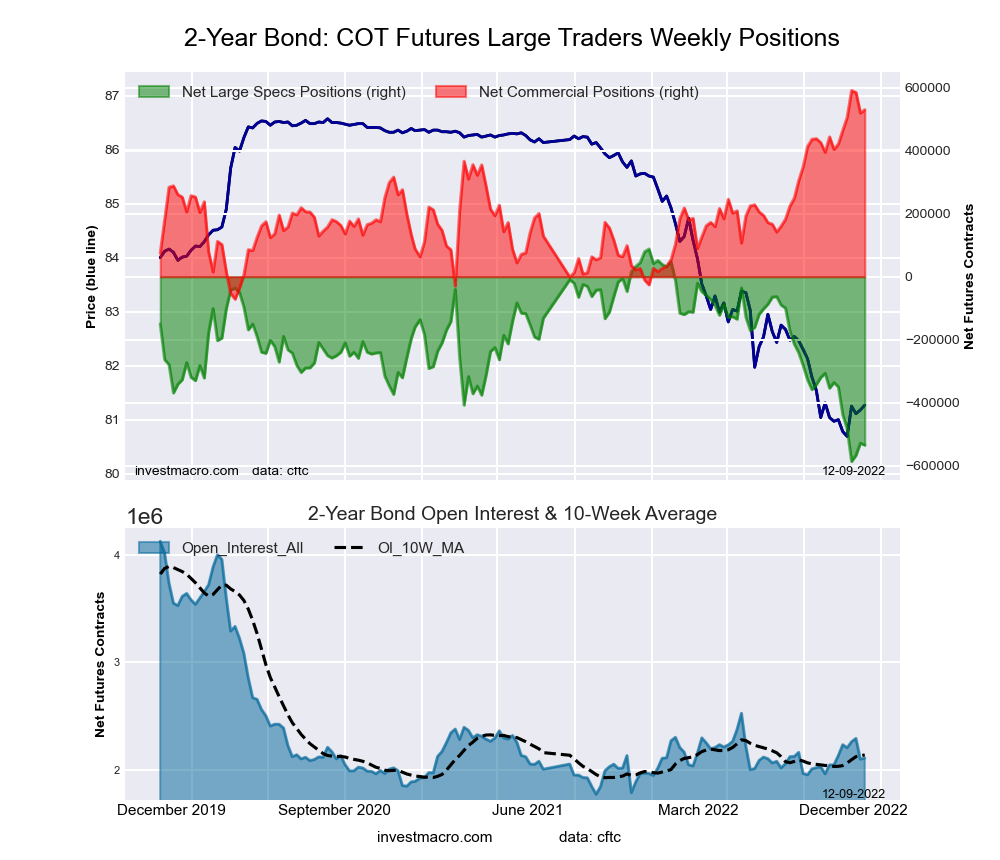 The 2-Year Treasury Note large speculator standing this week recorded a net position of -534,540 contracts in the data reported through Tuesday. This was a weekly reduction of -6,362 contracts from the previous week which had a total of -528,178 net contracts.
This week’s current strength score (the trader positioning range over the past three years, measured from 0 to 100) shows the speculators are currently Bearish-Extreme with a score of 7.7 percent. The commercials are Bullish-Extreme with a score of 90.8 percent and the small traders (not shown in chart) are Bullish with a score of 54.1 percent.
| 2-Year Treasury Note Statistics | SPECULATORS | COMMERCIALS | SMALL TRADERS |
| – Percent of Open Interest Longs: | 8.1 | 82.0 | 8.3 |
| – Percent of Open Interest Shorts: | 33.5 | 56.9 | 8.1 |
| – Net Position: | -534,540 | 529,893 | 4,647 |
| – Gross Longs: | 171,760 | 1,730,674 | 174,708 |
| – Gross Shorts: | 706,300 | 1,200,781 | 170,061 |
| – Long to Short Ratio: | 0.2 to 1 | 1.4 to 1 | 1.0 to 1 |
| NET POSITION TREND: | |||
| – Strength Index Score (3 Year Range Pct): | 7.7 | 90.8 | 54.1 |
| – Strength Index Reading (3 Year Range): | Bearish-Extreme | Bullish-Extreme | Bullish |
| NET POSITION MOVEMENT INDEX: | |||
| – 6-Week Change in Strength Index: | -27.4 | 16.4 | 34.1 |
5-Year Treasury Note Futures:
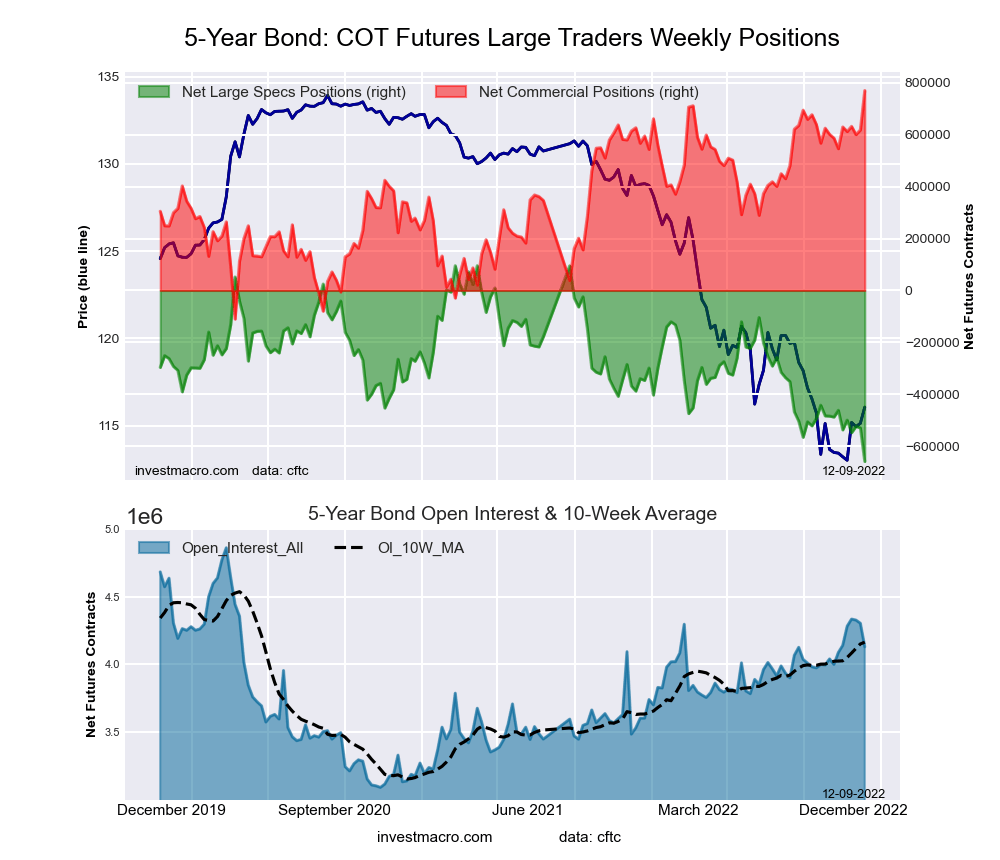 The 5-Year Treasury Note large speculator standing this week recorded a net position of -658,606 contracts in the data reported through Tuesday. This was a weekly decline of -129,257 contracts from the previous week which had a total of -529,349 net contracts.
This week’s current strength score (the trader positioning range over the past three years, measured from 0 to 100) shows the speculators are currently Bearish-Extreme with a score of 0.0 percent. The commercials are Bullish-Extreme with a score of 100.0 percent and the small traders (not shown in chart) are Bullish with a score of 50.4 percent.
| 5-Year Treasury Note Statistics | SPECULATORS | COMMERCIALS | SMALL TRADERS |
| – Percent of Open Interest Longs: | 5.5 | 85.6 | 7.3 |
| – Percent of Open Interest Shorts: | 21.5 | 67.0 | 10.1 |
| – Net Position: | -658,606 | 770,224 | -111,618 |
| – Gross Longs: | 229,001 | 3,537,413 | 303,580 |
| – Gross Shorts: | 887,607 | 2,767,189 | 415,198 |
| – Long to Short Ratio: | 0.3 to 1 | 1.3 to 1 | 0.7 to 1 |
| NET POSITION TREND: | |||
| – Strength Index Score (3 Year Range Pct): | 0.0 | 100.0 | 50.4 |
| – Strength Index Reading (3 Year Range): | Bearish-Extreme | Bullish-Extreme | Bullish |
| NET POSITION MOVEMENT INDEX: | |||
| – 6-Week Change in Strength Index: | -26.1 | 25.5 | -7.5 |
10-Year Treasury Note Futures:
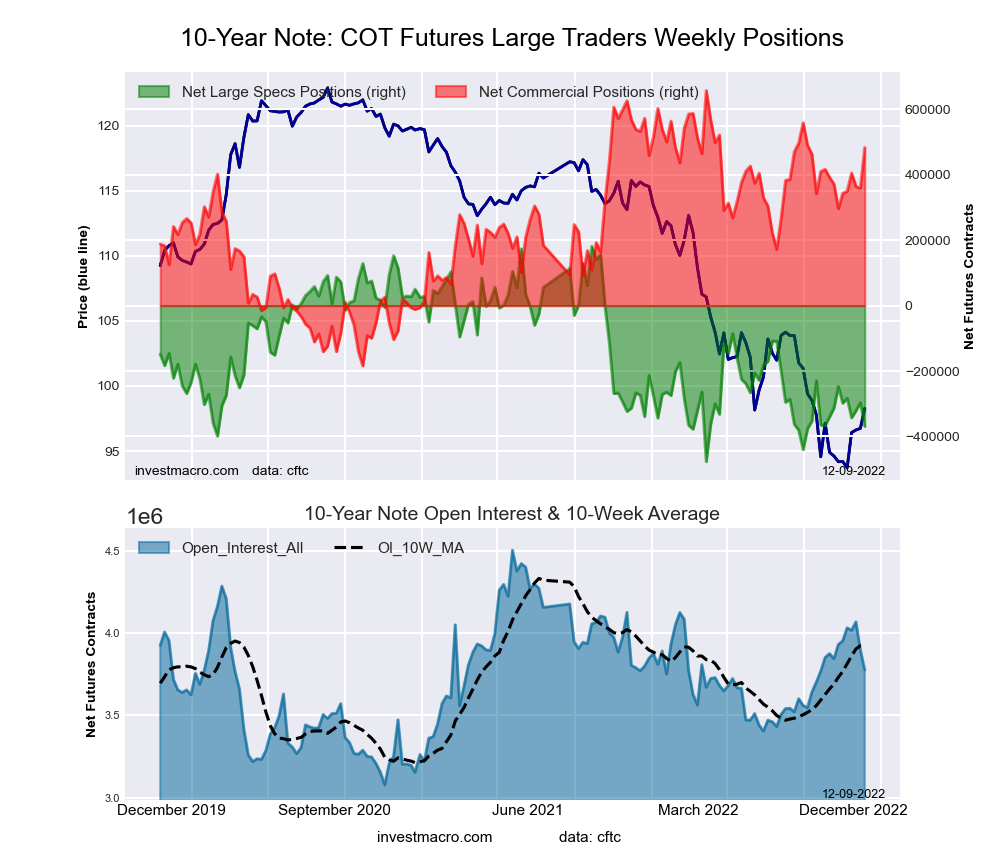 The 10-Year Treasury Note large speculator standing this week recorded a net position of -369,206 contracts in the data reported through Tuesday. This was a weekly decrease of -72,434 contracts from the previous week which had a total of -296,772 net contracts.
This week’s current strength score (the trader positioning range over the past three years, measured from 0 to 100) shows the speculators are currently Bearish-Extreme with a score of 16.3 percent. The commercials are Bullish with a score of 79.3 percent and the small traders (not shown in chart) are Bullish with a score of 53.0 percent.
| 10-Year Treasury Note Statistics | SPECULATORS | COMMERCIALS | SMALL TRADERS |
| – Percent of Open Interest Longs: | 11.2 | 77.2 | 8.9 |
| – Percent of Open Interest Shorts: | 21.0 | 64.4 | 11.9 |
| – Net Position: | -369,206 | 483,149 | -113,943 |
| – Gross Longs: | 423,994 | 2,914,741 | 336,179 |
| – Gross Shorts: | 793,200 | 2,431,592 | 450,122 |
| – Long to Short Ratio: | 0.5 to 1 | 1.2 to 1 | 0.7 to 1 |
| NET POSITION TREND: | |||
| – Strength Index Score (3 Year Range Pct): | 16.3 | 79.3 | 53.0 |
| – Strength Index Reading (3 Year Range): | Bearish-Extreme | Bullish | Bullish |
| NET POSITION MOVEMENT INDEX: | |||
| – 6-Week Change in Strength Index: | -18.5 | 22.1 | -15.4 |
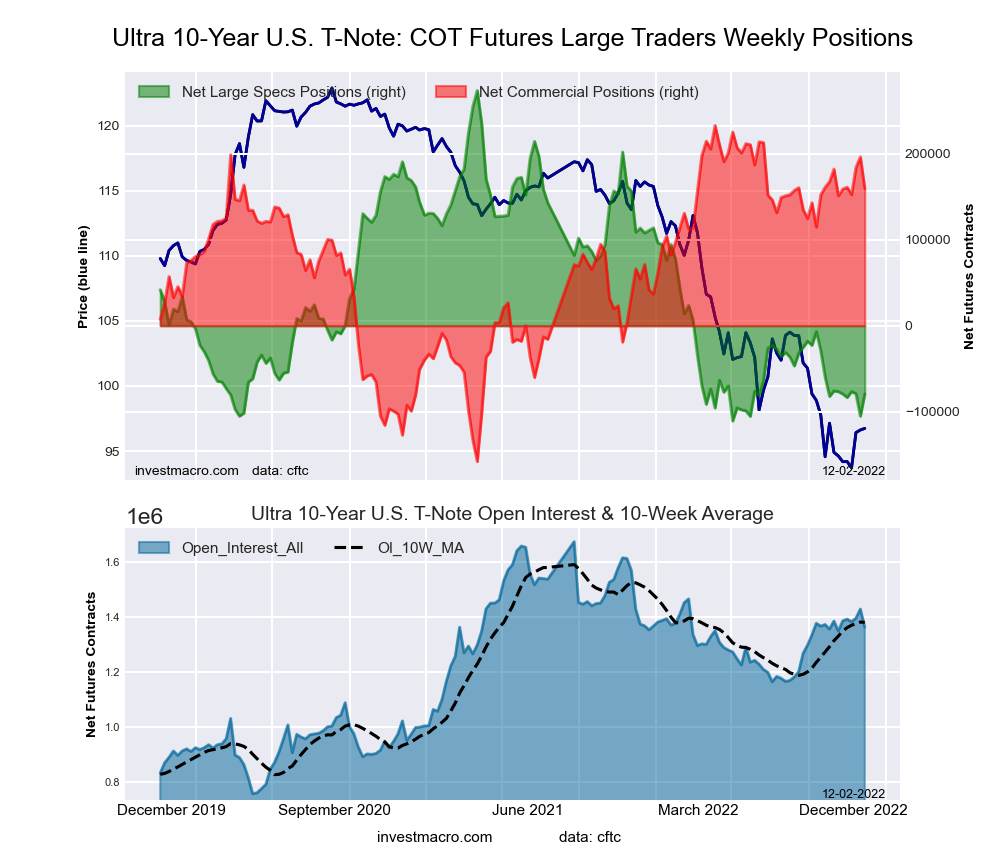
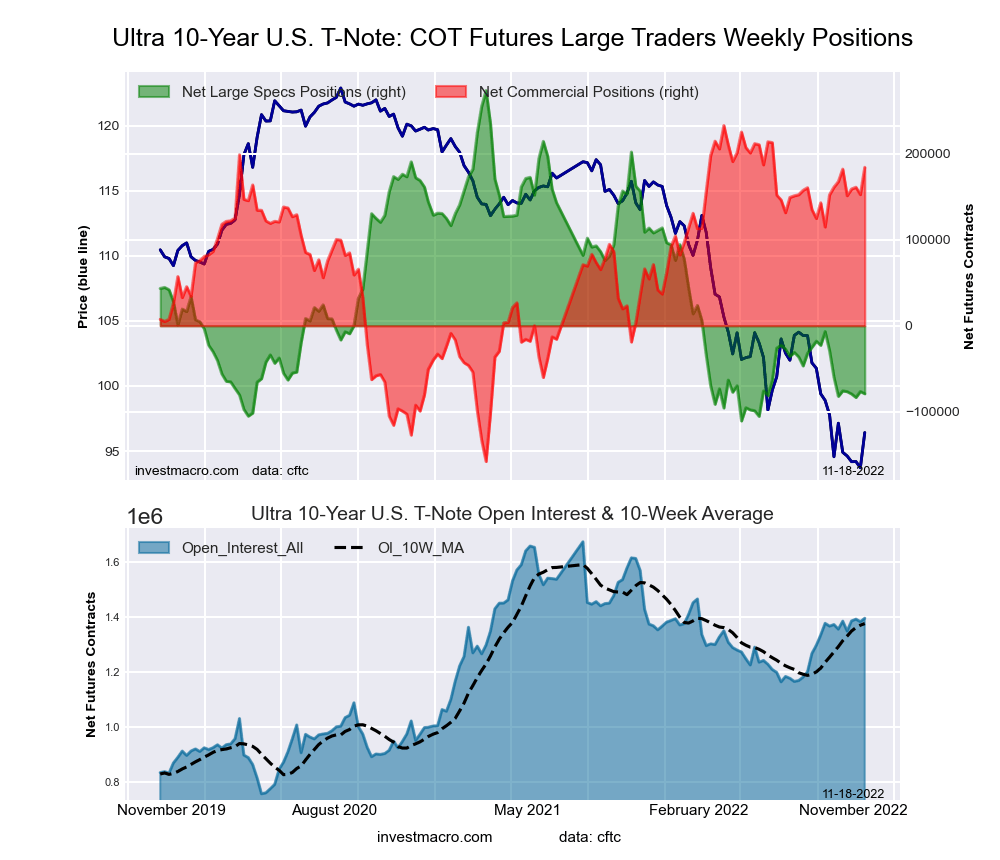
Ultra 10-Year Notes Futures:
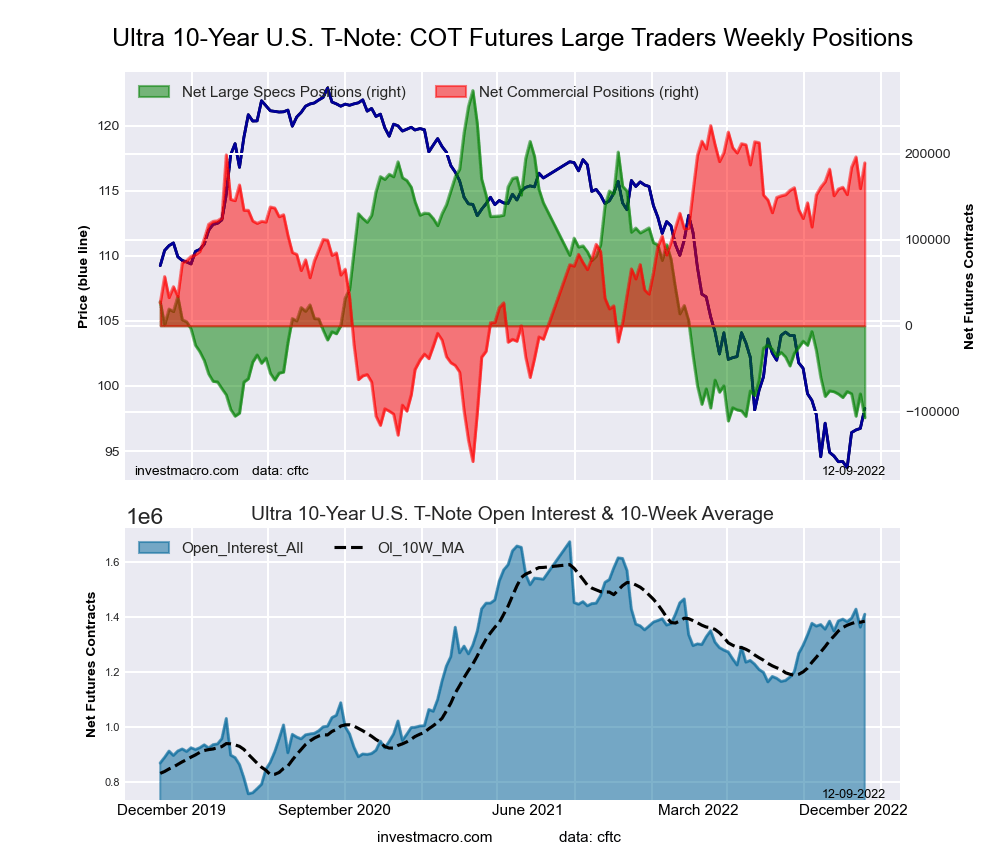 The Ultra 10-Year Notes large speculator standing this week recorded a net position of -106,952 contracts in the data reported through Tuesday. This was a weekly lowering of -27,703 contracts from the previous week which had a total of -79,249 net contracts.
This week’s current strength score (the trader positioning range over the past three years, measured from 0 to 100) shows the speculators are currently Bearish-Extreme with a score of 1.0 percent. The commercials are Bullish-Extreme with a score of 88.9 percent and the small traders (not shown in chart) are Bullish with a score of 72.2 percent.
| Ultra 10-Year Notes Statistics | SPECULATORS | COMMERCIALS | SMALL TRADERS |
| – Percent of Open Interest Longs: | 10.1 | 77.9 | 11.4 |
| – Percent of Open Interest Shorts: | 17.7 | 64.5 | 17.2 |
| – Net Position: | -106,952 | 189,505 | -82,553 |
| – Gross Longs: | 142,263 | 1,099,122 | 160,187 |
| – Gross Shorts: | 249,215 | 909,617 | 242,740 |
| – Long to Short Ratio: | 0.6 to 1 | 1.2 to 1 | 0.7 to 1 |
| NET POSITION TREND: | |||
| – Strength Index Score (3 Year Range Pct): | 1.0 | 88.9 | 72.2 |
| – Strength Index Reading (3 Year Range): | Bearish-Extreme | Bullish-Extreme | Bullish |
| NET POSITION MOVEMENT INDEX: | |||
| – 6-Week Change in Strength Index: | -7.2 | 7.8 | -1.9 |
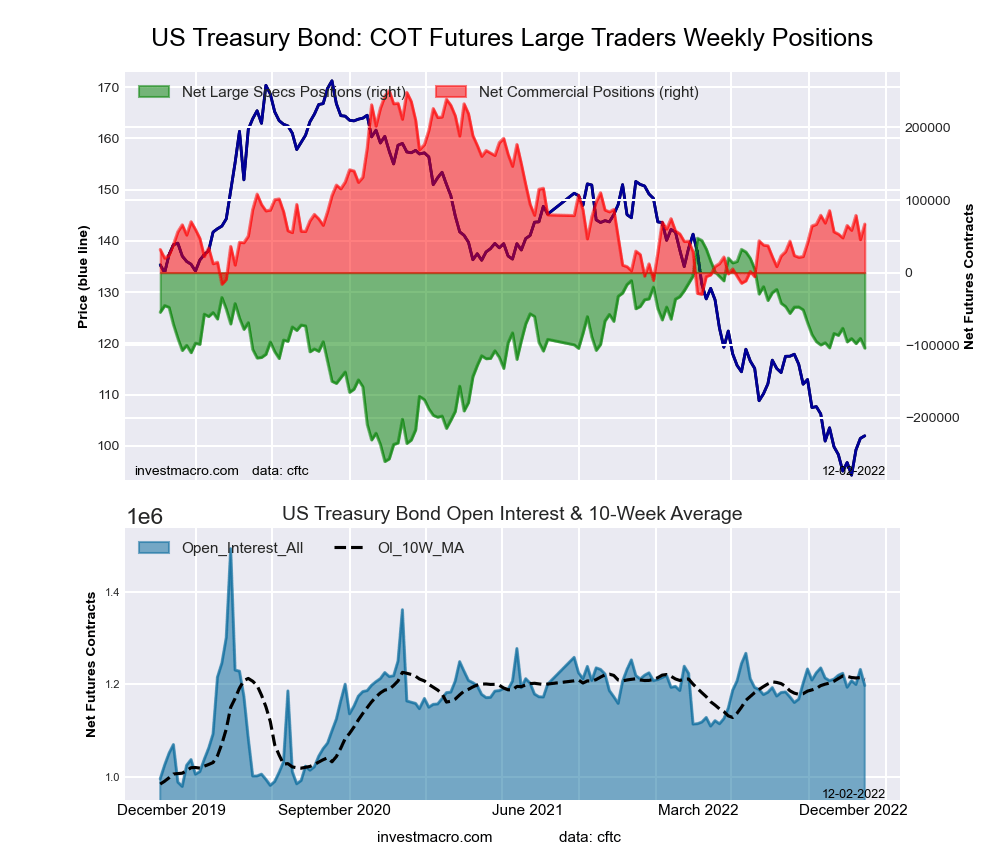
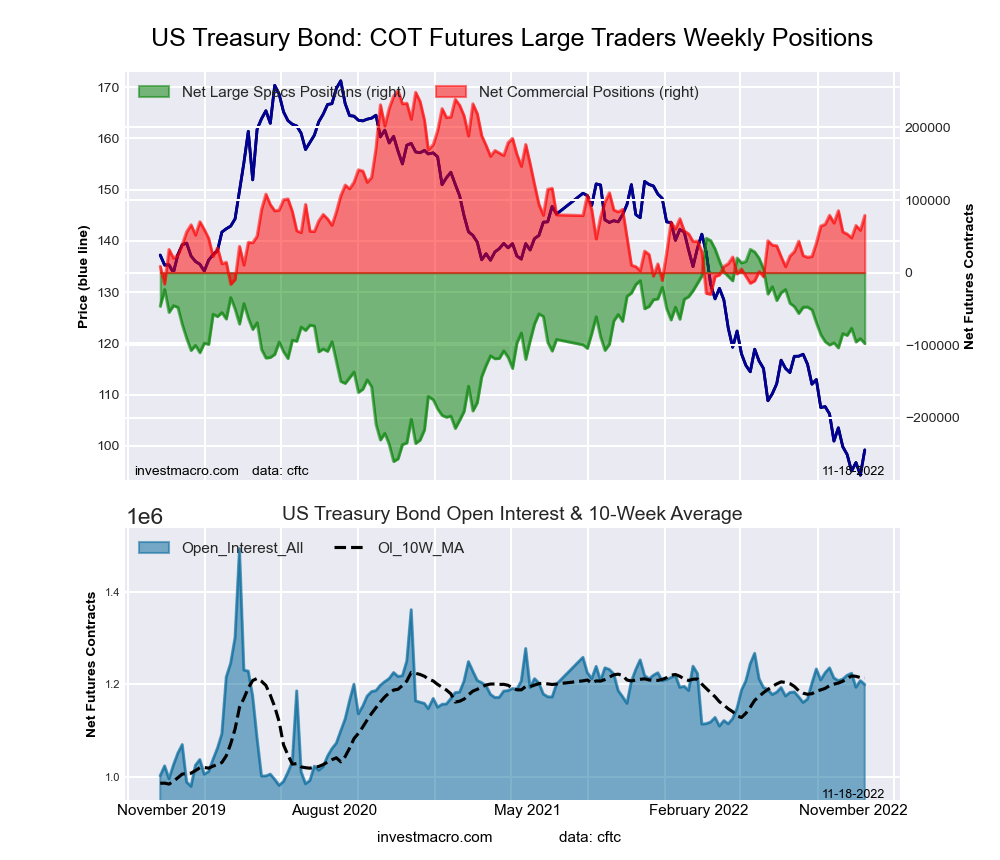
US Treasury Bonds Futures:
 The US Treasury Bonds large speculator standing this week recorded a net position of -115,361 contracts in the data reported through Tuesday. This was a weekly decrease of -11,444 contracts from the previous week which had a total of -103,917 net contracts.
This week’s current strength score (the trader positioning range over the past three years, measured from 0 to 100) shows the speculators are currently Bearish with a score of 47.0 percent. The commercials are Bearish with a score of 42.9 percent and the small traders (not shown in chart) are Bullish with a score of 72.2 percent.
| US Treasury Bonds Statistics | SPECULATORS | COMMERCIALS | SMALL TRADERS |
| – Percent of Open Interest Longs: | 4.7 | 79.5 | 14.8 |
| – Percent of Open Interest Shorts: | 14.6 | 71.7 | 12.7 |
| – Net Position: | -115,361 | 90,700 | 24,661 |
| – Gross Longs: | 55,349 | 930,571 | 173,282 |
| – Gross Shorts: | 170,710 | 839,871 | 148,621 |
| – Long to Short Ratio: | 0.3 to 1 | 1.1 to 1 | 1.2 to 1 |
| NET POSITION TREND: | |||
| – Strength Index Score (3 Year Range Pct): | 47.0 | 42.9 | 72.2 |
| – Strength Index Reading (3 Year Range): | Bearish | Bearish | Bullish |
| NET POSITION MOVEMENT INDEX: | |||
| – 6-Week Change in Strength Index: | -12.6 | 15.3 | -3.2 |
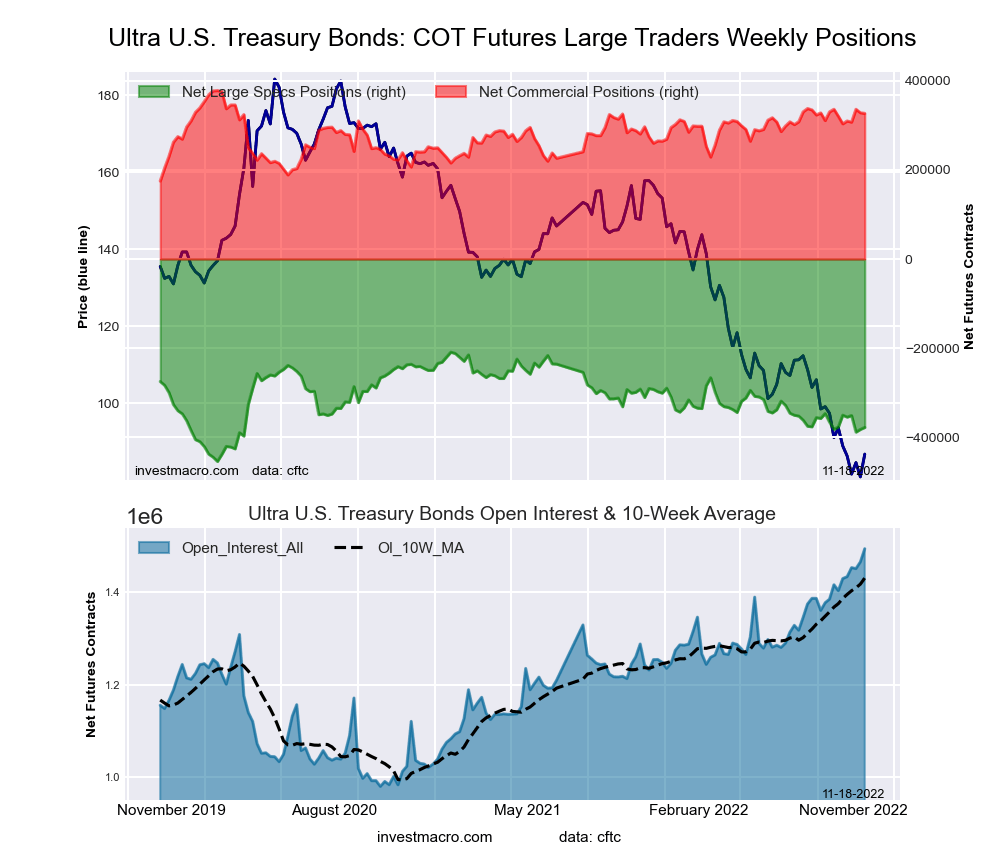
Ultra US Treasury Bonds Futures:
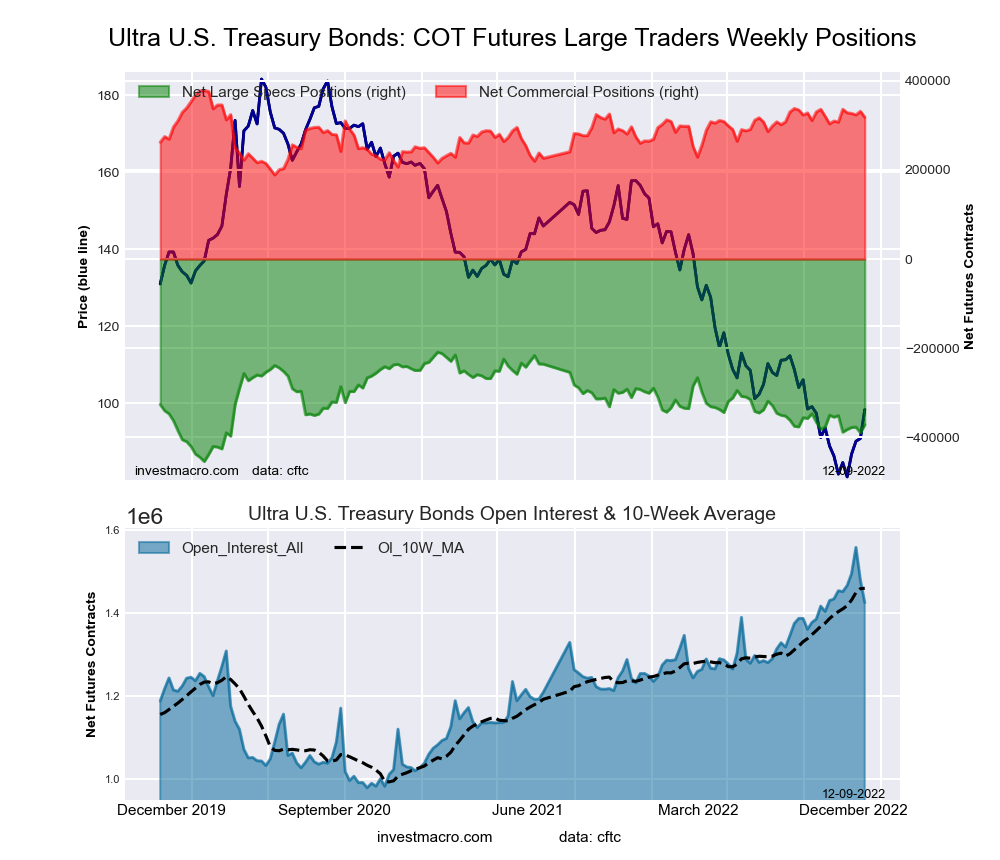 The Ultra US Treasury Bonds large speculator standing this week recorded a net position of -371,773 contracts in the data reported through Tuesday. This was a weekly lift of 17,631 contracts from the previous week which had a total of -389,404 net contracts.
This week’s current strength score (the trader positioning range over the past three years, measured from 0 to 100) shows the speculators are currently Bearish with a score of 33.5 percent. The commercials are Bullish with a score of 68.3 percent and the small traders (not shown in chart) are Bullish with a score of 76.0 percent.
| Ultra US Treasury Bonds Statistics | SPECULATORS | COMMERCIALS | SMALL TRADERS |
| – Percent of Open Interest Longs: | 3.9 | 83.8 | 11.8 |
| – Percent of Open Interest Shorts: | 30.0 | 61.5 | 8.0 |
| – Net Position: | -371,773 | 317,929 | 53,844 |
| – Gross Longs: | 56,272 | 1,193,551 | 168,437 |
| – Gross Shorts: | 428,045 | 875,622 | 114,593 |
| – Long to Short Ratio: | 0.1 to 1 | 1.4 to 1 | 1.5 to 1 |
| NET POSITION TREND: | |||
| – Strength Index Score (3 Year Range Pct): | 33.5 | 68.3 | 76.0 |
| – Strength Index Reading (3 Year Range): | Bearish | Bullish | Bullish |
| NET POSITION MOVEMENT INDEX: | |||
| – 6-Week Change in Strength Index: | -8.5 | 5.8 | 8.0 |
Article By InvestMacro – Receive our weekly COT Newsletter
*COT Report: The COT data, released weekly to the public each Friday, is updated through the most recent Tuesday (data is 3 days old) and shows a quick view of how large speculators or non-commercials (for-profit traders) were positioned in the futures markets.
The CFTC categorizes trader positions according to commercial hedgers (traders who use futures contracts for hedging as part of the business), non-commercials (large traders who speculate to realize trading profits) and nonreportable traders (usually small traders/speculators) as well as their open interest (contracts open in the market at time of reporting). See CFTC criteria here.


