
By InvestMacro
Here are the latest charts and statistics for the Commitment of Traders (COT) reports data published by the Commodities Futures Trading Commission (CFTC).
The latest COT data is updated through Tuesday December 6th and shows a quick view of how large traders (for-profit speculators and commercial entities) were positioned in the futures markets.
Weekly Speculator Changes
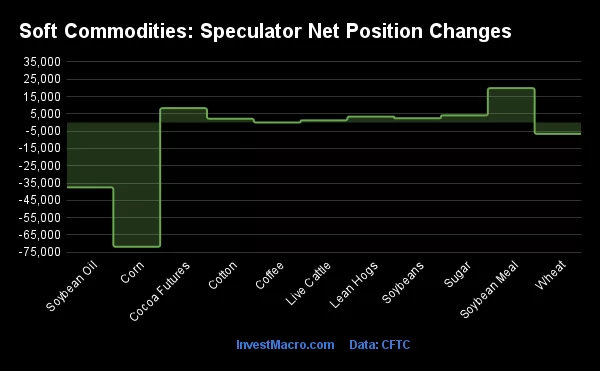
The COT soft commodities speculator bets were overall higher this week as seven out of the eleven soft commodities markets we cover had higher positioning this week while the other four markets had decreases in contracts.
Free Reports:
 Sign Up for Our Stock Market Newsletter – Get updated on News, Charts & Rankings of Public Companies when you join our Stocks Newsletter
 Get our Weekly Commitment of Traders Reports - See where the biggest traders (Hedge Funds and Commercial Hedgers) are positioned in the futures markets on a weekly basis.
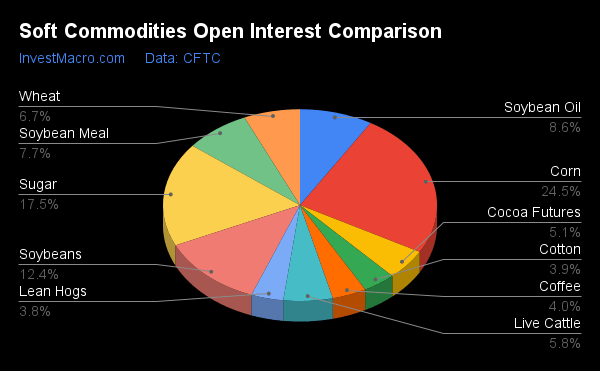
Leading the gains for soft commodities markets was Soybean Meal (19,835 contracts) with Cocoa (8,266 contracts), Sugar (4,089 contracts), Lean Hogs (3,409 contracts), Soybeans (2,453 contracts), Cotton (2,140 contracts) and Live Cattle (1,229 contracts) also showing positive weeks.
The softs market leading the declines in speculator bets this week was Corn (-71,867 contracts) with Soybean Oil (-37,543 contracts), Wheat (-6,592 contracts) and Coffee (-6 contracts) also registering lower bets on the week.
Highlighting the COT soft commodities data this week is the recent drop in Corn‘s speculator positioning. The large speculator bets for Corn decreased sharply this week and by the largest one-week amount since 2018 with a -71,867 contract decline. Overall, Corn bets have now fallen by -142,413 net speculator contracts in just the past five weeks, going from a total of +340,788 contracts on November 1st to a total of +198,375 contracts this week. This week’s total is the least bullish level in the past nineteen weeks, dating back to July 26th.
Corn futures prices have been in retreat since peaking in April of this year as the front-month futures price settled on Friday at just over 644’0. This is down almost 20 percent from the April peak, however, Corn does remain in an uptrend on the weekly charts.
| Dec-06-2022 | OI | OI-Index | Spec-Net | Spec-Index | Com-Net | COM-Index | Smalls-Net | Smalls-Index |
|---|---|---|---|---|---|---|---|---|
| WTI Crude | 1,436,728 | 3 | 231,720 | 6 | -259,553 | 94 | 27,833 | 45 |
| Gold | 422,100 | 0 | 115,125 | 21 | -130,079 | 79 | 14,954 | 17 |
| Silver | 122,558 | 1 | 19,208 | 35 | -32,262 | 65 | 13,054 | 33 |
| Copper | 158,762 | 9 | 1,679 | 38 | -4,354 | 64 | 2,675 | 41 |
| Palladium | 7,785 | 9 | -1,372 | 16 | 1,226 | 81 | 146 | 50 |
| Platinum | 68,821 | 37 | 25,636 | 44 | -30,148 | 58 | 4,512 | 29 |
| Natural Gas | 1,010,479 | 11 | -164,037 | 29 | 135,606 | 74 | 28,431 | 48 |
| Brent | 144,147 | 7 | -28,118 | 64 | 23,746 | 33 | 4,372 | 68 |
| Heating Oil | 257,158 | 19 | 22,828 | 76 | -39,506 | 29 | 16,678 | 56 |
| Soybeans | 622,200 | 11 | 89,661 | 38 | -59,882 | 71 | -29,779 | 21 |
| Corn | 1,232,307 | 1 | 198,375 | 55 | -157,536 | 49 | -40,839 | 20 |
| Coffee | 203,296 | 14 | -14,642 | 2 | 12,907 | 98 | 1,735 | 24 |
| Sugar | 881,388 | 34 | 183,124 | 57 | -226,066 | 38 | 42,942 | 61 |
| Wheat | 334,760 | 21 | -39,897 | 0 | 42,820 | 100 | -2,923 | 95 |
Soybean Meal tops Strength Scores
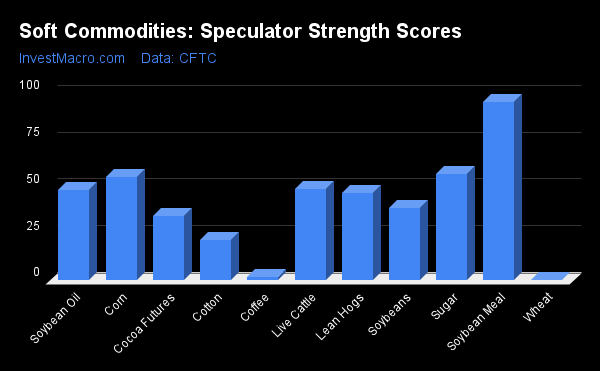
Strength Scores (a normalized measure of Speculator positions over a 3-Year range, from 0 to 100 where above 80 is extreme bullish and below 20 is extreme bearish) showed that Soybean Meal (95.5 percent) leads the soft commodity markets and is in a bullish extreme position (above 80 percent). Sugar (56.9 percent) and Corn (55.4 percent) come in as the next highest soft commodity markets in strength scores.
On the downside, Wheat (0.0 percent) and Coffee (1.8 percent) come in at the lowest strength level currently and are in an Extreme-Bearish position (below 20 percent).
Strength Statistics:
Corn (55.4 percent) vs Corn previous week (64.6 percent)
Sugar (56.9 percent) vs Sugar previous week (55.5 percent)
Coffee (1.8 percent) vs Coffee previous week (1.8 percent)
Soybeans (38.5 percent) vs Soybeans previous week (37.7 percent)
Soybean Oil (48.5 percent) vs Soybean Oil previous week (74.3 percent)
Soybean Meal (95.5 percent) vs Soybean Meal previous week (84.5 percent)
Live Cattle (48.7 percent) vs Live Cattle previous week (47.1 percent)
Lean Hogs (46.9 percent) vs Lean Hogs previous week (43.1 percent)
Cotton (21.5 percent) vs Cotton previous week (19.9 percent)
Cocoa (34.6 percent) vs Cocoa previous week (26.4 percent)
Wheat (0.0 percent) vs Wheat previous week (6.5 percent)
Sugar leads the 6-Week Strength Trends
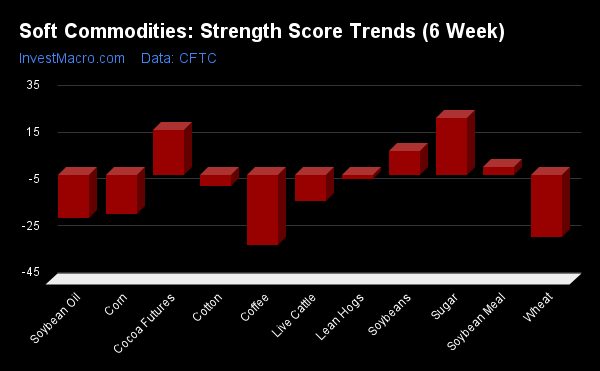
Strength Score Trends (or move index, calculates the 6-week changes in strength scores) show that Sugar (24.5 percent) leads the past six weeks trends for soft commodity markets this week. Cocoa (19.3 percent), Soybeans (10.3 percent) and Soybean Meal (3.4 percent) fill out the other positive movers in the latest trends data.
Coffee (-29.9 percent) and Wheat (-26.4 percent) lead the downside trend scores this week. The next markets with lower trend scores were Corn (-16.8 percent), Live Cattle (-11.1 percent) and Cotton (-4.6 percent).
Strength Trend Statistics:
Corn (-16.8 percent) vs Corn previous week (-5.4 percent)
Sugar (24.5 percent) vs Sugar previous week (18.1 percent)
Coffee (-29.9 percent) vs Coffee previous week (-38.9 percent)
Soybeans (10.3 percent) vs Soybeans previous week (10.4 percent)
Soybean Oil (-18.5 percent) vs Soybean Oil previous week (18.9 percent)
Soybean Meal (3.4 percent) vs Soybean Meal previous week (1.8 percent)
Live Cattle (-11.1 percent) vs Live Cattle previous week (15.5 percent)
Lean Hogs (-1.7 percent) vs Lean Hogs previous week (9.6 percent)
Cotton (-4.6 percent) vs Cotton previous week (-12.2 percent)
Cocoa (19.3 percent) vs Cocoa previous week (-1.5 percent)
Wheat (-26.4 percent) vs Wheat previous week (-29.2 percent)
Individual Soft Commodities Markets:
CORN Futures:
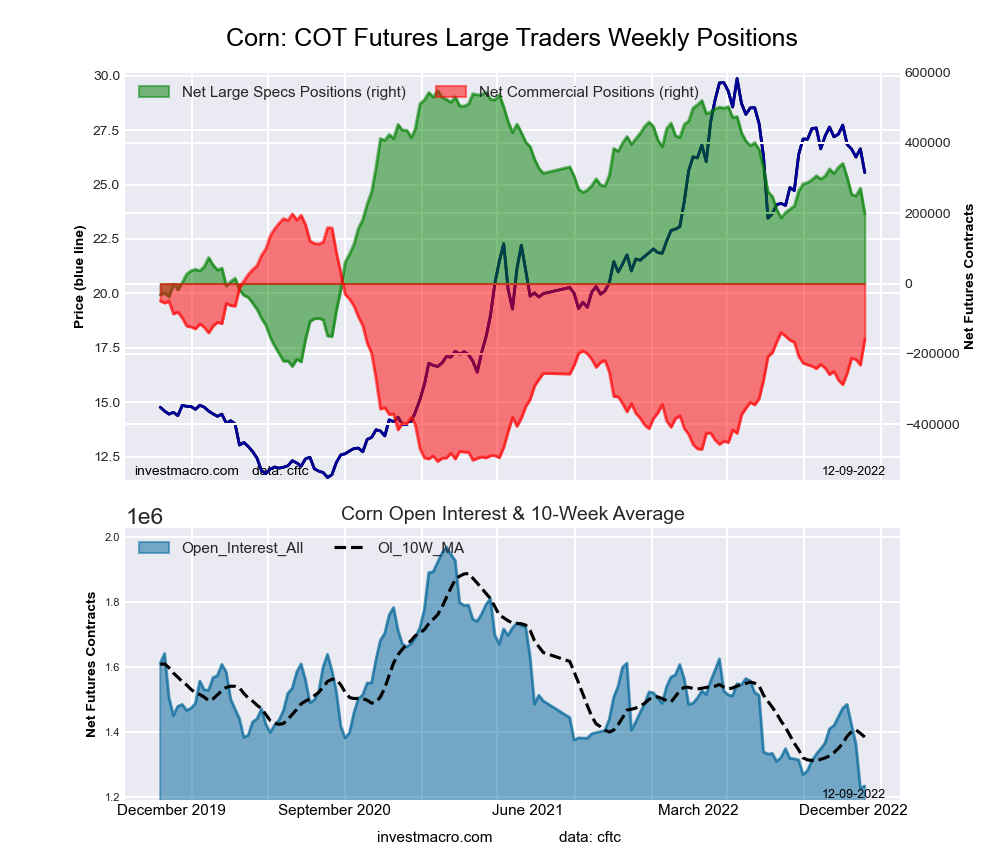 The CORN large speculator standing this week totaled a net position of 198,375 contracts in the data reported through Tuesday. This was a weekly fall of -71,867 contracts from the previous week which had a total of 270,242 net contracts.
This week’s current strength score (the trader positioning range over the past three years, measured from 0 to 100) shows the speculators are currently Bullish with a score of 55.4 percent. The commercials are Bearish with a score of 49.5 percent and the small traders (not shown in chart) are Bearish with a score of 20.0 percent.
| CORN Futures Statistics | SPECULATORS | COMMERCIALS | SMALL TRADERS |
| – Percent of Open Interest Longs: | 25.6 | 48.5 | 9.9 |
| – Percent of Open Interest Shorts: | 9.5 | 61.2 | 13.2 |
| – Net Position: | 198,375 | -157,536 | -40,839 |
| – Gross Longs: | 315,270 | 597,177 | 121,431 |
| – Gross Shorts: | 116,895 | 754,713 | 162,270 |
| – Long to Short Ratio: | 2.7 to 1 | 0.8 to 1 | 0.7 to 1 |
| NET POSITION TREND: | |||
| – Strength Index Score (3 Year Range Pct): | 55.4 | 49.5 | 20.0 |
| – Strength Index Reading (3 Year Range): | Bullish | Bearish | Bearish |
| NET POSITION MOVEMENT INDEX: | |||
| – 6-Week Change in Strength Index: | -16.8 | 16.5 | 9.0 |
SUGAR Futures:
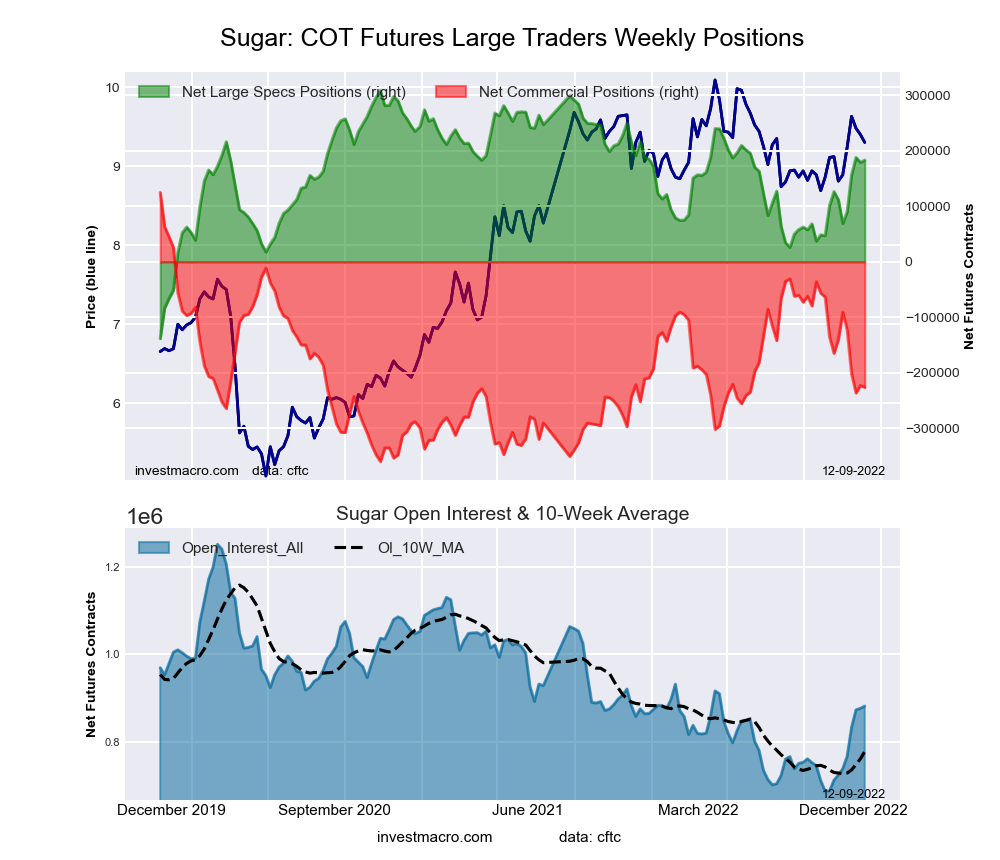 The SUGAR large speculator standing this week totaled a net position of 183,124 contracts in the data reported through Tuesday. This was a weekly advance of 4,089 contracts from the previous week which had a total of 179,035 net contracts.
This week’s current strength score (the trader positioning range over the past three years, measured from 0 to 100) shows the speculators are currently Bullish with a score of 56.9 percent. The commercials are Bearish with a score of 38.3 percent and the small traders (not shown in chart) are Bullish with a score of 60.9 percent.
| SUGAR Futures Statistics | SPECULATORS | COMMERCIALS | SMALL TRADERS |
| – Percent of Open Interest Longs: | 32.1 | 45.0 | 10.4 |
| – Percent of Open Interest Shorts: | 11.3 | 70.6 | 5.5 |
| – Net Position: | 183,124 | -226,066 | 42,942 |
| – Gross Longs: | 282,673 | 396,317 | 91,614 |
| – Gross Shorts: | 99,549 | 622,383 | 48,672 |
| – Long to Short Ratio: | 2.8 to 1 | 0.6 to 1 | 1.9 to 1 |
| NET POSITION TREND: | |||
| – Strength Index Score (3 Year Range Pct): | 56.9 | 38.3 | 60.9 |
| – Strength Index Reading (3 Year Range): | Bullish | Bearish | Bullish |
| NET POSITION MOVEMENT INDEX: | |||
| – 6-Week Change in Strength Index: | 24.5 | -24.7 | 18.1 |
COFFEE Futures:
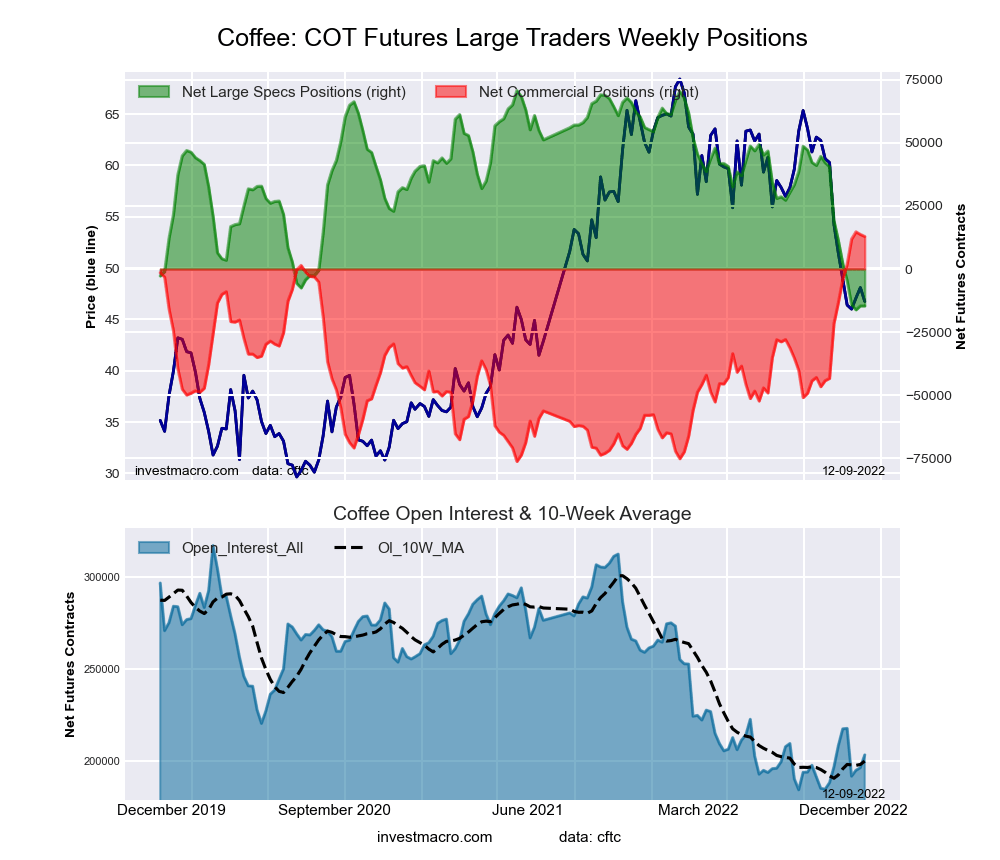 The COFFEE large speculator standing this week totaled a net position of -14,642 contracts in the data reported through Tuesday. This was a weekly lowering of -6 contracts from the previous week which had a total of -14,636 net contracts.
This week’s current strength score (the trader positioning range over the past three years, measured from 0 to 100) shows the speculators are currently Bearish-Extreme with a score of 1.8 percent. The commercials are Bullish-Extreme with a score of 98.0 percent and the small traders (not shown in chart) are Bearish with a score of 23.6 percent.
| COFFEE Futures Statistics | SPECULATORS | COMMERCIALS | SMALL TRADERS |
| – Percent of Open Interest Longs: | 19.9 | 54.8 | 4.7 |
| – Percent of Open Interest Shorts: | 27.1 | 48.4 | 3.8 |
| – Net Position: | -14,642 | 12,907 | 1,735 |
| – Gross Longs: | 40,476 | 111,365 | 9,524 |
| – Gross Shorts: | 55,118 | 98,458 | 7,789 |
| – Long to Short Ratio: | 0.7 to 1 | 1.1 to 1 | 1.2 to 1 |
| NET POSITION TREND: | |||
| – Strength Index Score (3 Year Range Pct): | 1.8 | 98.0 | 23.6 |
| – Strength Index Reading (3 Year Range): | Bearish-Extreme | Bullish-Extreme | Bearish |
| NET POSITION MOVEMENT INDEX: | |||
| – 6-Week Change in Strength Index: | -29.9 | 28.8 | -3.3 |
SOYBEANS Futures:
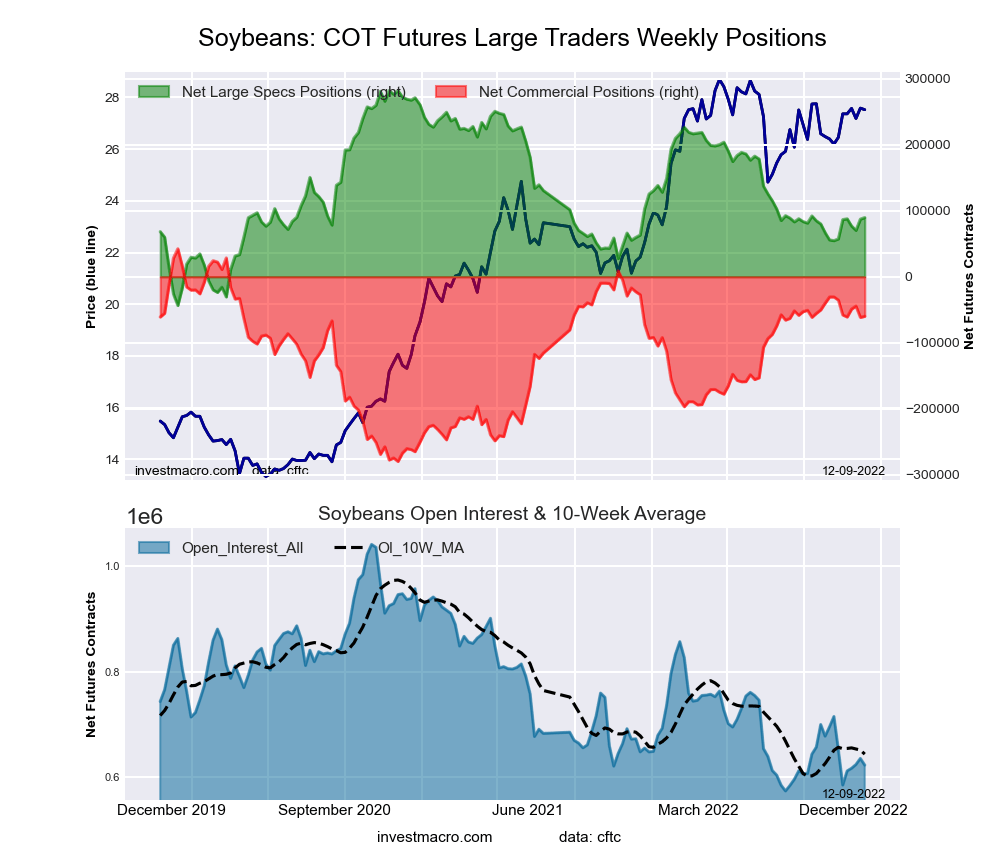 The SOYBEANS large speculator standing this week totaled a net position of 89,661 contracts in the data reported through Tuesday. This was a weekly increase of 2,453 contracts from the previous week which had a total of 87,208 net contracts.
This week’s current strength score (the trader positioning range over the past three years, measured from 0 to 100) shows the speculators are currently Bearish with a score of 38.5 percent. The commercials are Bullish with a score of 71.3 percent and the small traders (not shown in chart) are Bearish with a score of 20.7 percent.
| SOYBEANS Futures Statistics | SPECULATORS | COMMERCIALS | SMALL TRADERS |
| – Percent of Open Interest Longs: | 25.8 | 51.3 | 7.3 |
| – Percent of Open Interest Shorts: | 11.4 | 60.9 | 12.1 |
| – Net Position: | 89,661 | -59,882 | -29,779 |
| – Gross Longs: | 160,518 | 319,120 | 45,508 |
| – Gross Shorts: | 70,857 | 379,002 | 75,287 |
| – Long to Short Ratio: | 2.3 to 1 | 0.8 to 1 | 0.6 to 1 |
| NET POSITION TREND: | |||
| – Strength Index Score (3 Year Range Pct): | 38.5 | 71.3 | 20.7 |
| – Strength Index Reading (3 Year Range): | Bearish | Bullish | Bearish |
| NET POSITION MOVEMENT INDEX: | |||
| – 6-Week Change in Strength Index: | 10.3 | -8.0 | -13.1 |
SOYBEAN OIL Futures:
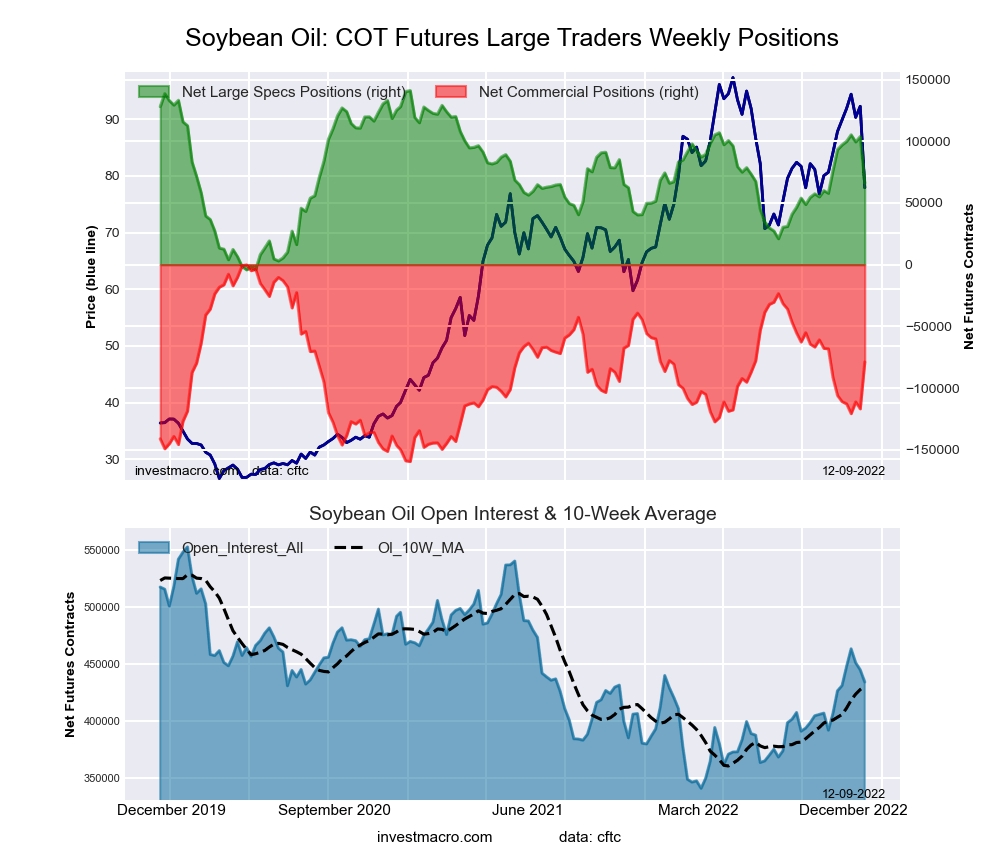 The SOYBEAN OIL large speculator standing this week totaled a net position of 66,311 contracts in the data reported through Tuesday. This was a weekly reduction of -37,543 contracts from the previous week which had a total of 103,854 net contracts.
This week’s current strength score (the trader positioning range over the past three years, measured from 0 to 100) shows the speculators are currently Bearish with a score of 48.5 percent. The commercials are Bullish with a score of 50.6 percent and the small traders (not shown in chart) are Bullish with a score of 60.3 percent.
| SOYBEAN OIL Futures Statistics | SPECULATORS | COMMERCIALS | SMALL TRADERS |
| – Percent of Open Interest Longs: | 24.5 | 47.0 | 8.5 |
| – Percent of Open Interest Shorts: | 9.3 | 65.2 | 5.6 |
| – Net Position: | 66,311 | -78,867 | 12,556 |
| – Gross Longs: | 106,474 | 204,193 | 36,717 |
| – Gross Shorts: | 40,163 | 283,060 | 24,161 |
| – Long to Short Ratio: | 2.7 to 1 | 0.7 to 1 | 1.5 to 1 |
| NET POSITION TREND: | |||
| – Strength Index Score (3 Year Range Pct): | 48.5 | 50.6 | 60.3 |
| – Strength Index Reading (3 Year Range): | Bearish | Bullish | Bullish |
| NET POSITION MOVEMENT INDEX: | |||
| – 6-Week Change in Strength Index: | -18.5 | 17.0 | -0.9 |
SOYBEAN MEAL Futures:
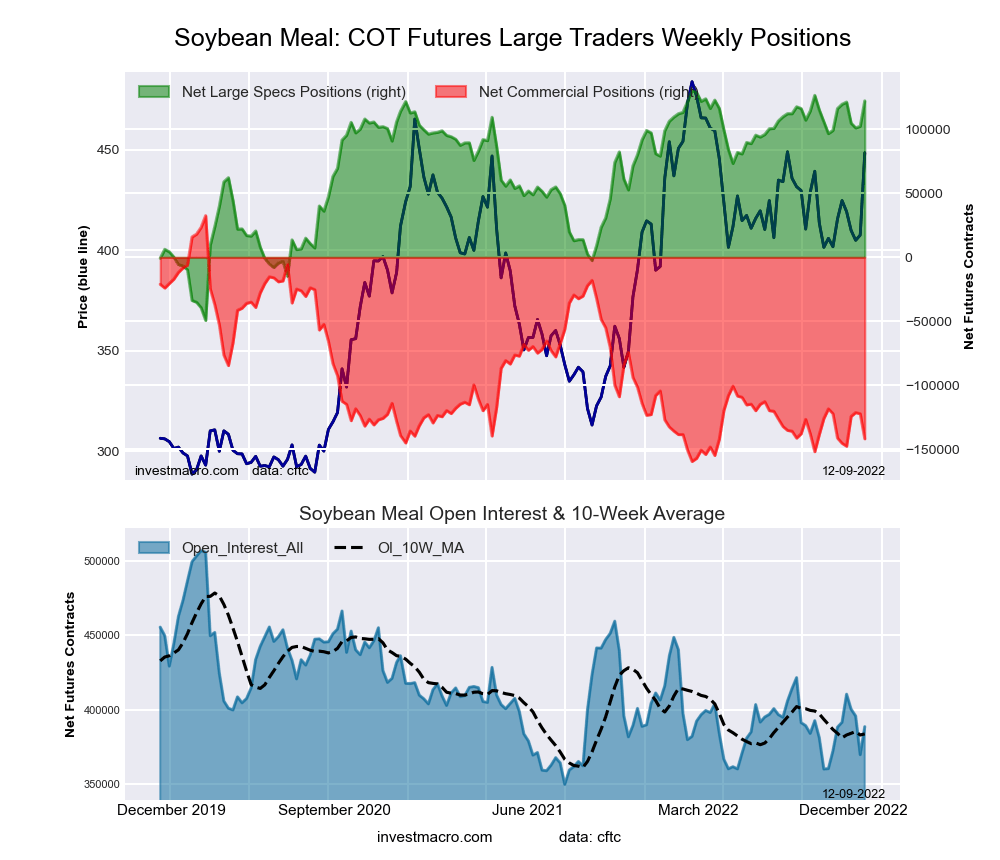 The SOYBEAN MEAL large speculator standing this week totaled a net position of 122,174 contracts in the data reported through Tuesday. This was a weekly advance of 19,835 contracts from the previous week which had a total of 102,339 net contracts.
This week’s current strength score (the trader positioning range over the past three years, measured from 0 to 100) shows the speculators are currently Bullish-Extreme with a score of 95.5 percent. The commercials are Bearish-Extreme with a score of 9.2 percent and the small traders (not shown in chart) are Bearish with a score of 34.5 percent.
| SOYBEAN MEAL Futures Statistics | SPECULATORS | COMMERCIALS | SMALL TRADERS |
| – Percent of Open Interest Longs: | 36.0 | 37.9 | 12.3 |
| – Percent of Open Interest Shorts: | 4.6 | 74.4 | 7.3 |
| – Net Position: | 122,174 | -141,761 | 19,587 |
| – Gross Longs: | 140,034 | 147,251 | 47,971 |
| – Gross Shorts: | 17,860 | 289,012 | 28,384 |
| – Long to Short Ratio: | 7.8 to 1 | 0.5 to 1 | 1.7 to 1 |
| NET POSITION TREND: | |||
| – Strength Index Score (3 Year Range Pct): | 95.5 | 9.2 | 34.5 |
| – Strength Index Reading (3 Year Range): | Bullish-Extreme | Bearish-Extreme | Bearish |
| NET POSITION MOVEMENT INDEX: | |||
| – 6-Week Change in Strength Index: | 3.4 | -0.3 | -28.4 |
LIVE CATTLE Futures:
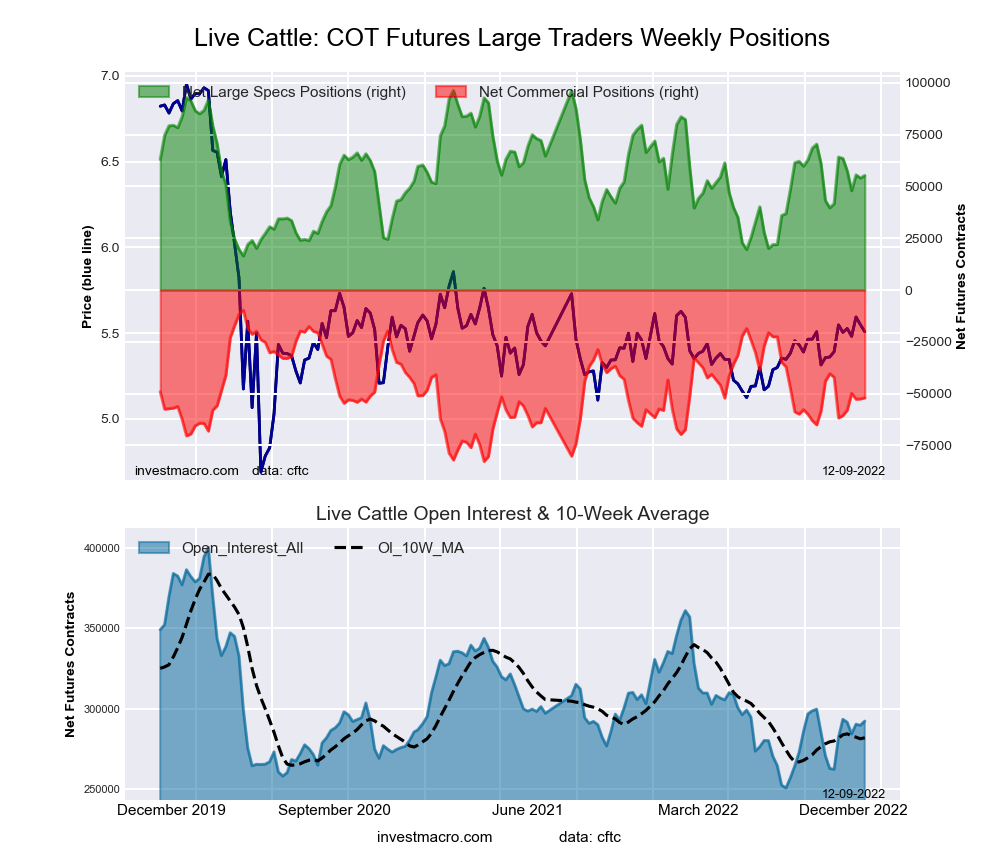 The LIVE CATTLE large speculator standing this week totaled a net position of 55,263 contracts in the data reported through Tuesday. This was a weekly boost of 1,229 contracts from the previous week which had a total of 54,034 net contracts.
This week’s current strength score (the trader positioning range over the past three years, measured from 0 to 100) shows the speculators are currently Bearish with a score of 48.7 percent. The commercials are Bearish with a score of 42.0 percent and the small traders (not shown in chart) are Bullish with a score of 79.8 percent.
| LIVE CATTLE Futures Statistics | SPECULATORS | COMMERCIALS | SMALL TRADERS |
| – Percent of Open Interest Longs: | 37.3 | 32.8 | 11.2 |
| – Percent of Open Interest Shorts: | 18.4 | 50.6 | 12.3 |
| – Net Position: | 55,263 | -52,026 | -3,237 |
| – Gross Longs: | 108,912 | 95,851 | 32,667 |
| – Gross Shorts: | 53,649 | 147,877 | 35,904 |
| – Long to Short Ratio: | 2.0 to 1 | 0.6 to 1 | 0.9 to 1 |
| NET POSITION TREND: | |||
| – Strength Index Score (3 Year Range Pct): | 48.7 | 42.0 | 79.8 |
| – Strength Index Reading (3 Year Range): | Bearish | Bearish | Bullish |
| NET POSITION MOVEMENT INDEX: | |||
| – 6-Week Change in Strength Index: | -11.1 | 13.3 | -3.2 |
LEAN HOGS Futures:
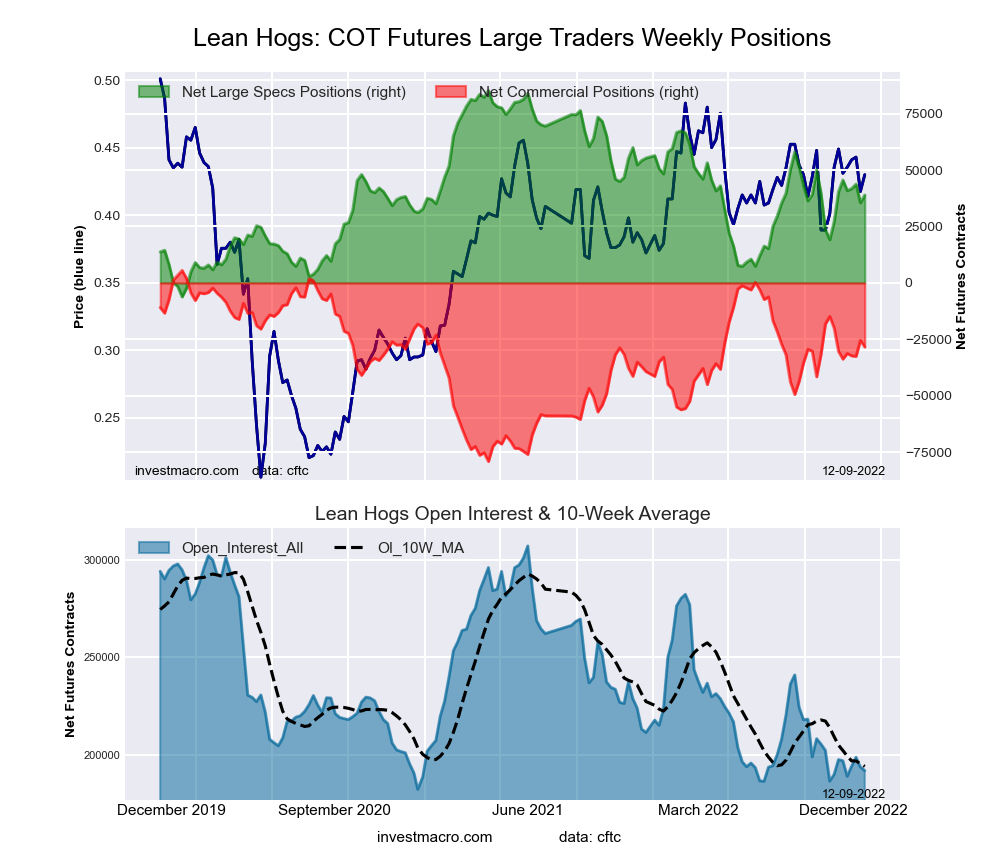 The LEAN HOGS large speculator standing this week totaled a net position of 38,908 contracts in the data reported through Tuesday. This was a weekly rise of 3,409 contracts from the previous week which had a total of 35,499 net contracts.
This week’s current strength score (the trader positioning range over the past three years, measured from 0 to 100) shows the speculators are currently Bearish with a score of 46.9 percent. The commercials are Bullish with a score of 62.5 percent and the small traders (not shown in chart) are Bearish with a score of 42.5 percent.
| LEAN HOGS Futures Statistics | SPECULATORS | COMMERCIALS | SMALL TRADERS |
| – Percent of Open Interest Longs: | 40.1 | 35.1 | 7.1 |
| – Percent of Open Interest Shorts: | 19.8 | 49.9 | 12.6 |
| – Net Position: | 38,908 | -28,396 | -10,512 |
| – Gross Longs: | 76,849 | 67,376 | 13,694 |
| – Gross Shorts: | 37,941 | 95,772 | 24,206 |
| – Long to Short Ratio: | 2.0 to 1 | 0.7 to 1 | 0.6 to 1 |
| NET POSITION TREND: | |||
| – Strength Index Score (3 Year Range Pct): | 46.9 | 62.5 | 42.5 |
| – Strength Index Reading (3 Year Range): | Bearish | Bullish | Bearish |
| NET POSITION MOVEMENT INDEX: | |||
| – 6-Week Change in Strength Index: | -1.7 | 2.4 | -2.5 |
COTTON Futures:
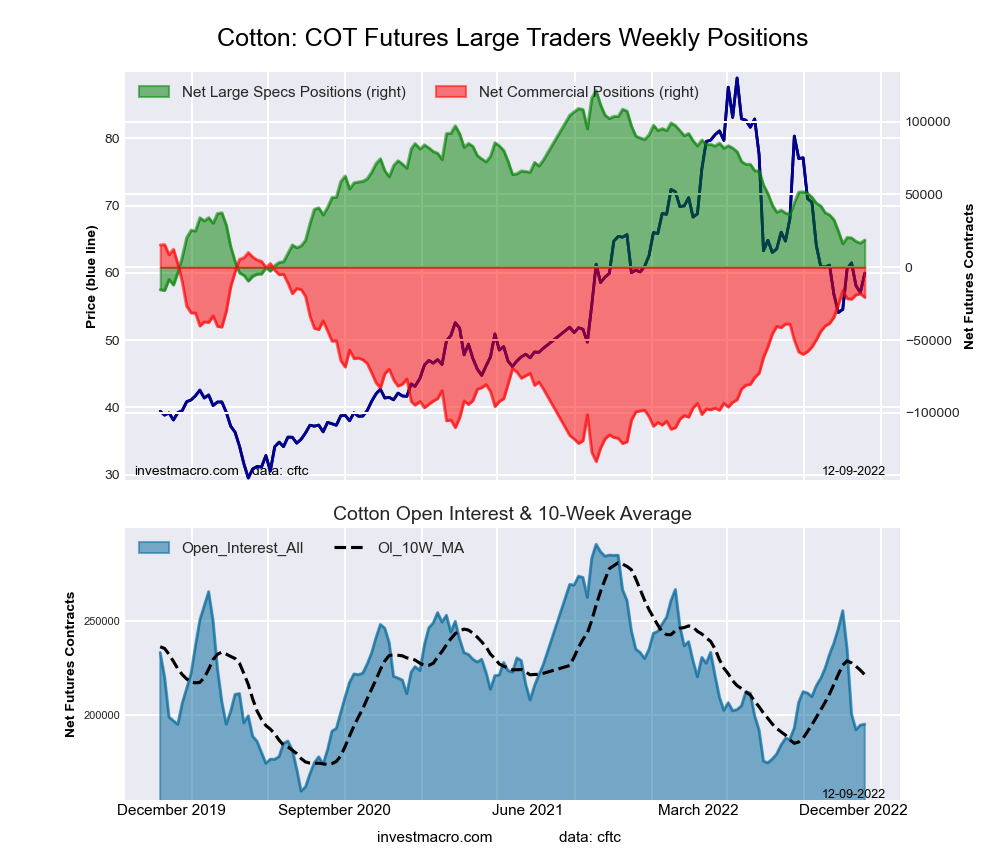 The COTTON large speculator standing this week totaled a net position of 18,720 contracts in the data reported through Tuesday. This was a weekly increase of 2,140 contracts from the previous week which had a total of 16,580 net contracts.
This week’s current strength score (the trader positioning range over the past three years, measured from 0 to 100) shows the speculators are currently Bearish with a score of 21.5 percent. The commercials are Bullish with a score of 78.5 percent and the small traders (not shown in chart) are Bearish with a score of 22.8 percent.
| COTTON Futures Statistics | SPECULATORS | COMMERCIALS | SMALL TRADERS |
| – Percent of Open Interest Longs: | 33.2 | 47.2 | 6.3 |
| – Percent of Open Interest Shorts: | 23.6 | 57.8 | 5.3 |
| – Net Position: | 18,720 | -20,658 | 1,938 |
| – Gross Longs: | 64,807 | 92,047 | 12,243 |
| – Gross Shorts: | 46,087 | 112,705 | 10,305 |
| – Long to Short Ratio: | 1.4 to 1 | 0.8 to 1 | 1.2 to 1 |
| NET POSITION TREND: | |||
| – Strength Index Score (3 Year Range Pct): | 21.5 | 78.5 | 22.8 |
| – Strength Index Reading (3 Year Range): | Bearish | Bullish | Bearish |
| NET POSITION MOVEMENT INDEX: | |||
| – 6-Week Change in Strength Index: | -4.6 | 3.5 | 6.6 |
COCOA Futures:
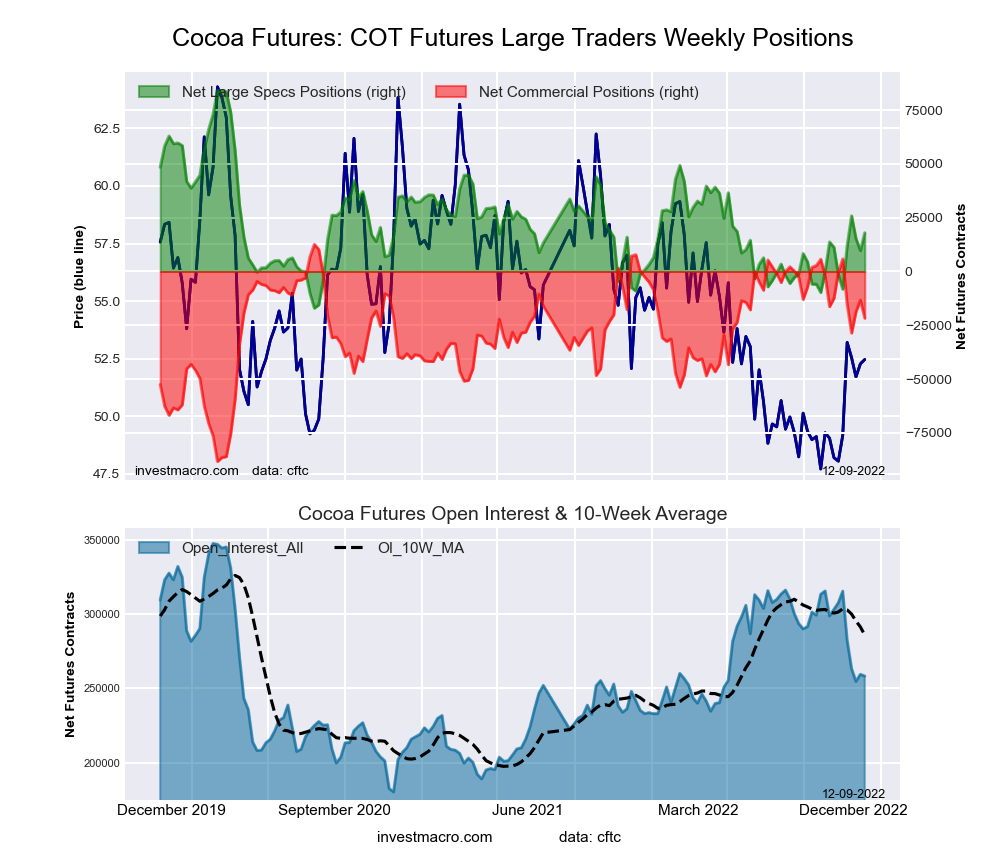 The COCOA large speculator standing this week totaled a net position of 17,964 contracts in the data reported through Tuesday. This was a weekly increase of 8,266 contracts from the previous week which had a total of 9,698 net contracts.
This week’s current strength score (the trader positioning range over the past three years, measured from 0 to 100) shows the speculators are currently Bearish with a score of 34.6 percent. The commercials are Bullish with a score of 66.0 percent and the small traders (not shown in chart) are Bearish with a score of 34.0 percent.
| COCOA Futures Statistics | SPECULATORS | COMMERCIALS | SMALL TRADERS |
| – Percent of Open Interest Longs: | 32.4 | 47.4 | 4.6 |
| – Percent of Open Interest Shorts: | 25.5 | 55.8 | 3.1 |
| – Net Position: | 17,964 | -21,713 | 3,749 |
| – Gross Longs: | 83,808 | 122,383 | 11,758 |
| – Gross Shorts: | 65,844 | 144,096 | 8,009 |
| – Long to Short Ratio: | 1.3 to 1 | 0.8 to 1 | 1.5 to 1 |
| NET POSITION TREND: | |||
| – Strength Index Score (3 Year Range Pct): | 34.6 | 66.0 | 34.0 |
| – Strength Index Reading (3 Year Range): | Bearish | Bullish | Bearish |
| NET POSITION MOVEMENT INDEX: | |||
| – 6-Week Change in Strength Index: | 19.3 | -21.1 | 17.5 |
WHEAT Futures:
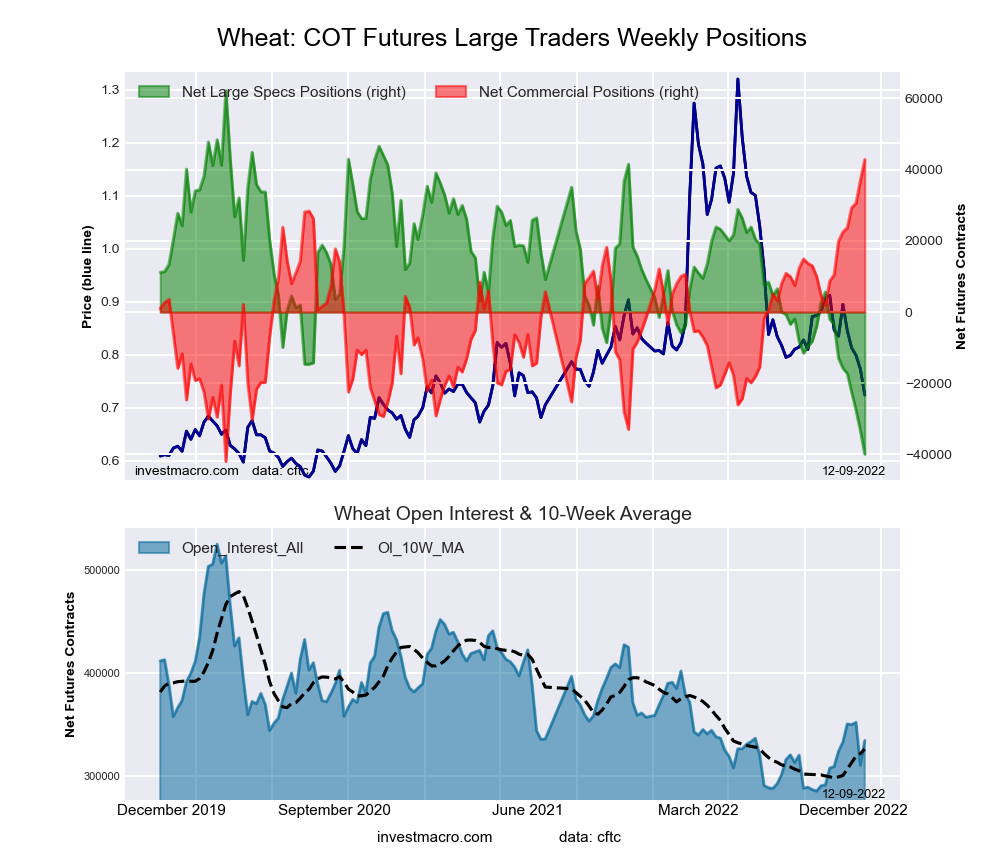 The WHEAT large speculator standing this week totaled a net position of -39,897 contracts in the data reported through Tuesday. This was a weekly decrease of -6,592 contracts from the previous week which had a total of -33,305 net contracts.
This week’s current strength score (the trader positioning range over the past three years, measured from 0 to 100) shows the speculators are currently Bearish-Extreme with a score of 0.0 percent. The commercials are Bullish-Extreme with a score of 100.0 percent and the small traders (not shown in chart) are Bullish-Extreme with a score of 95.2 percent.
| WHEAT Futures Statistics | SPECULATORS | COMMERCIALS | SMALL TRADERS |
| – Percent of Open Interest Longs: | 28.6 | 40.6 | 10.2 |
| – Percent of Open Interest Shorts: | 40.5 | 27.8 | 11.1 |
| – Net Position: | -39,897 | 42,820 | -2,923 |
| – Gross Longs: | 95,846 | 135,857 | 34,182 |
| – Gross Shorts: | 135,743 | 93,037 | 37,105 |
| – Long to Short Ratio: | 0.7 to 1 | 1.5 to 1 | 0.9 to 1 |
| NET POSITION TREND: | |||
| – Strength Index Score (3 Year Range Pct): | 0.0 | 100.0 | 95.2 |
| – Strength Index Reading (3 Year Range): | Bearish-Extreme | Bullish-Extreme | Bullish-Extreme |
| NET POSITION MOVEMENT INDEX: | |||
| – 6-Week Change in Strength Index: | -26.4 | 27.0 | 21.1 |
Article By InvestMacro – Receive our weekly COT Newsletter
*COT Report: The COT data, released weekly to the public each Friday, is updated through the most recent Tuesday (data is 3 days old) and shows a quick view of how large speculators or non-commercials (for-profit traders) were positioned in the futures markets.
The CFTC categorizes trader positions according to commercial hedgers (traders who use futures contracts for hedging as part of the business), non-commercials (large traders who speculate to realize trading profits) and nonreportable traders (usually small traders/speculators) as well as their open interest (contracts open in the market at time of reporting). See CFTC criteria here.

- COT Metals Charts: Weekly Speculator Bets led by Copper & Steel Jul 18, 2026
- COT Bonds Charts: Weekly Speculator Bets led by 2-Year, SOFR 3M & 5-Year Bonds Jul 18, 2026
- COT Energy Charts: Weekly Speculator Bets led by Brent Oil & Heating Oil Jul 18, 2026
- COT Soft Commodities Charts: Weekly Speculator Bets led by Wheat, Corn & Soybean Meal Jul 18, 2026
- The Bank of Canada kept its interest rate unchanged. Platinum prices reached a three‑week high Jul 16, 2026
- Stock indices rose after the release of US inflation data. China’s GDP slowed sharply Jul 15, 2026
- GBP/USD Awaits Political News: What Will Happen Next Jul 15, 2026
- USD/JPY Holds at Highs: Pressure Lingers on Yen Jul 14, 2026
- Oil prices jumped 4% amid a new wave of escalation between the US and Iran Jul 13, 2026
- EUR/USD: US Inflation Will Determine Everything Jul 13, 2026