
By InvestMacro
Here are the latest charts and statistics for the Commitment of Traders (COT) reports data published by the Commodities Futures Trading Commission (CFTC).
The latest COT data is updated through Tuesday April 11th and shows a quick view of how large traders (for-profit speculators and commercial hedgers) were positioned in the futures markets.
Weekly Speculator Changes led by SOFR 3-Months & 5-Year Bonds
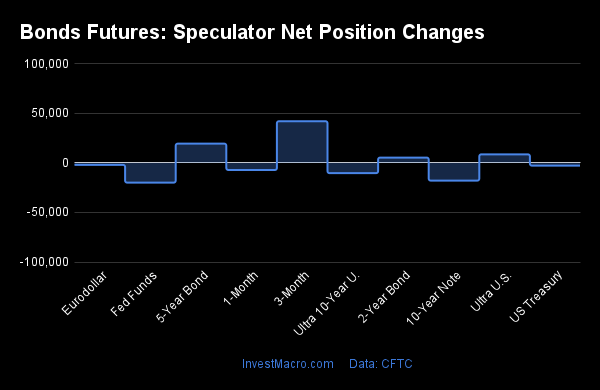
The COT bond market speculator bets were lower this week as four out of the nine bond markets we cover had higher positioning while the other five markets had lower speculator contracts.
Free Reports:
 Get our Weekly Commitment of Traders Reports - See where the biggest traders (Hedge Funds and Commercial Hedgers) are positioned in the futures markets on a weekly basis.
 Download Our Metatrader 4 Indicators – Put Our Free MetaTrader 4 Custom Indicators on your charts when you join our Weekly Newsletter
Leading the gains for the bond markets was the SOFR 3-Months (41,837 contracts) with the 5-Year Bonds (19,258 contracts), the Ultra Treasury Bonds (8,480 contracts) and the 2-Year Bonds (5,214 contracts) also showing positive weeks.
The bond markets with declines in speculator bets for the week were the Fed Funds (-20,036 contracts), the 10-Year Bonds (-18,006 contracts), the Eurodollar (-2,166 contracts), the US Treasury Bonds (-2,938 contracts) and the Ultra 10-Year Bonds (-10,494 contracts) also registering lower bets on the week.
SOFR contracts to replace Eurodollar contracts this week
Highlighting the COT bond’s data this week is an important week for the Secured Overnight Financing Rate (3-Months) or SOFR contracts. The SOFR contracts are relatively new on the scene as these futures only started in 2020. The SOFR contracts are in the process of taking the place of the Eurodollar contracts as the Eurodollars are being phased out and this week marks the last week for traders to use the Eurodollars contracts. Going forward, the Eurodollars contracts will be converted into 3-Month SOFRs and we will cease to have a Eurodollars futures contract.
The Eurodollars were the most traded and the highest open interest contract in the futures market for many years because it was a way for investors to express a view on short-term interest rates based on the London Interbank Offered Rate (LIBOR). However, LIBOR was fraught with controversy as it was a survey based on banks and was caught up in a manipulation scandal in 2012. In that scandal, bank participants colluded to move the LIBOR rate higher or lower and use that to their advantage.
The SOFR has taken precedence because it is calculated using actually market data (provided by the NY Fed Bank) instead of survey data. The SOFR data is from the US Dollar Treasury overnight repurchase agreement (REPO) transactions which are essentially loans between banks that are backed and collateralized by Treasury securities.
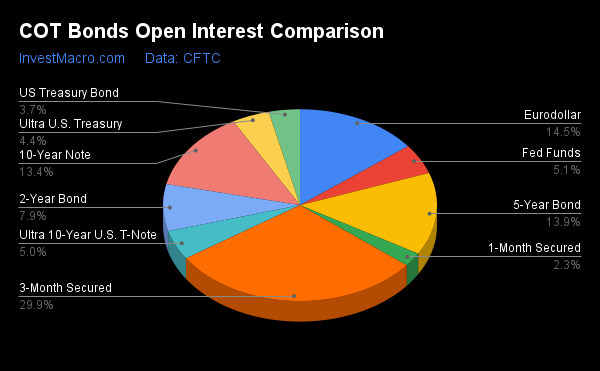
The SOFR contracts now have the highest open interest levels with these contracts exceeding over 10 million in open interest in March. To read more on the SOFRs and how to imply the SOFR interest rate from the futures contracts, see here.
| Apr-11-2023 | OI | OI-Index | Spec-Net | Spec-Index | Com-Net | COM-Index | Smalls-Net | Smalls-Index |
|---|---|---|---|---|---|---|---|---|
| Eurodollar | 4,630,651 | 0 | -649,485 | 57 | 801,073 | 41 | -151,588 | 71 |
| FedFunds | 1,624,730 | 57 | -167,276 | 19 | 175,875 | 81 | -8,599 | 74 |
| 2-Year | 2,531,969 | 68 | -496,841 | 25 | 460,413 | 72 | 36,428 | 73 |
| Long T-Bond | 1,179,823 | 52 | -132,584 | 41 | 69,508 | 35 | 63,076 | 95 |
| 10-Year | 4,275,293 | 84 | -639,037 | 0 | 622,661 | 88 | 16,376 | 87 |
| 5-Year | 4,446,566 | 97 | -761,981 | 2 | 722,702 | 94 | 39,279 | 92 |
Strength Scores led by SOFR 3-Months & Eurodollar
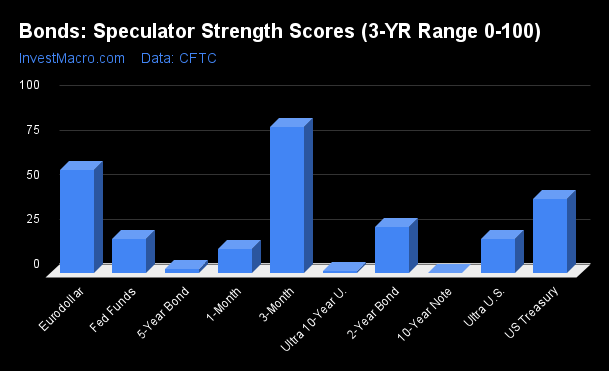
COT Strength Scores (a normalized measure of Speculator positions over a 3-Year range, from 0 to 100 where above 80 is Extreme-Bullish and below 20 is Extreme-Bearish) showed that the SOFR 3-Months (82 percent) and the Eurodollar (57 percent) lead the bond markets this week. The US Treasury Bonds (41 percent) comes in as the next highest in the weekly strength scores.
On the downside, the 10-Year Bonds (0 percent) and the Ultra 10-Year Bonds (1 percent) come in at the lowest strength level currently and are in Extreme-Bearish territory (below 20 percent). The next lowest strength scores were the 5-Year Bonds (2 percent) and the Ultra Treasury Bonds (19 percent).
Strength Statistics:
Fed Funds (19.0 percent) vs Fed Funds previous week (21.4 percent)
2-Year Bond (25.5 percent) vs 2-Year Bond previous week (24.8 percent)
5-Year Bond (2.2 percent) vs 5-Year Bond previous week (0.0 percent)
10-Year Bond (0.0 percent) vs 10-Year Bond previous week (2.2 percent)
Ultra 10-Year Bond (1.2 percent) vs Ultra 10-Year Bond previous week (3.4 percent)
US Treasury Bond (41.4 percent) vs US Treasury Bond previous week (42.4 percent)
Ultra US Treasury Bond (19.0 percent) vs Ultra US Treasury Bond previous week (15.4 percent)
Eurodollar (57.4 percent) vs Eurodollar previous week (57.4 percent)
SOFR 3-Months (81.6 percent) vs SOFR 3-Months previous week (78.2 percent)
SOFR 3-Months & 2-Year Bonds top the 6-Week Strength Trends
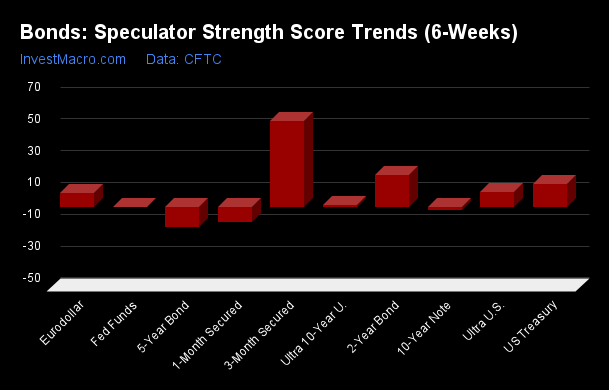
COT Strength Score Trends (or move index, calculates the 6-week changes in strength scores) showed that the SOFR 3-Months (54 percent) and the 2-Year Bonds (20 percent) lead the past six weeks trends for bonds. The US Treasury Bonds (14 percent) and the 5-Year Bonds (-12 percent) are the next highest positive movers in the latest trends data.
The 10-Year Bonds (-1 percent) leads the downside trend scores currently with the Fed Funds (0 percent) and the Ultra 10-Year Bonds (1 percent) following next with lower trend scores.
Strength Trend Statistics:
Fed Funds (0.5 percent) vs Fed Funds previous week (-7.1 percent)
2-Year Bond (20.4 percent) vs 2-Year Bond previous week (24.4 percent)
5-Year Bond (-12.4 percent) vs 5-Year Bond previous week (-20.8 percent)
10-Year Bond (-1.4 percent) vs 10-Year Bond previous week (-14.7 percent)
Ultra 10-Year Bond (1.2 percent) vs Ultra 10-Year Bond previous week (-9.8 percent)
US Treasury Bond (14.4 percent) vs US Treasury Bond previous week (8.2 percent)
Ultra US Treasury Bond (9.9 percent) vs Ultra US Treasury Bond previous week (-1.9 percent)
Eurodollar (9.0 percent) vs Eurodollar previous week (9.3 percent)
SOFR 3-Months (54.2 percent) vs SOFR 3-Months previous week (43.9 percent)
Individual Bond Markets:
3-Month Eurodollars Futures:
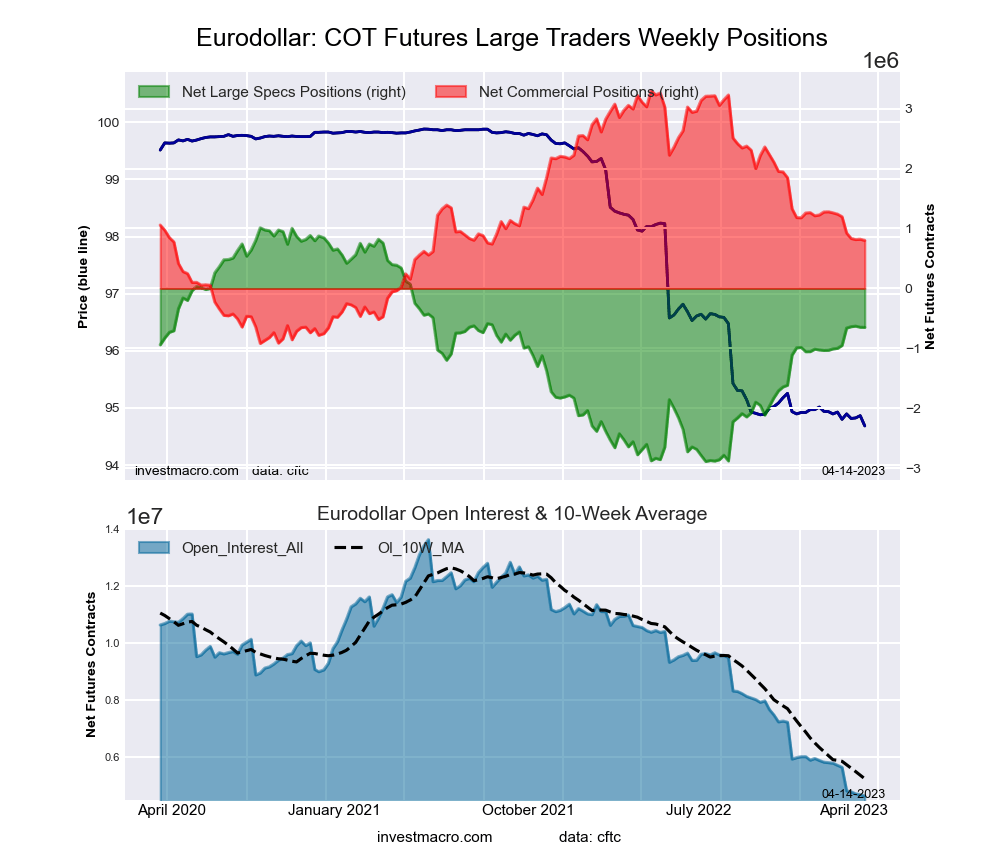 The 3-Month Eurodollars large speculator standing this week recorded a net position of -649,485 contracts in the data reported through Tuesday. This was a weekly reduction of -2,166 contracts from the previous week which had a total of -647,319 net contracts.
This week’s current strength score (the trader positioning range over the past three years, measured from 0 to 100) shows the speculators are currently Bullish with a score of 57.4 percent. The commercials are Bearish with a score of 40.7 percent and the small traders (not shown in chart) are Bullish with a score of 71.1 percent.
| 3-Month Eurodollars Statistics | SPECULATORS | COMMERCIALS | SMALL TRADERS |
| – Percent of Open Interest Longs: | 6.2 | 67.7 | 4.5 |
| – Percent of Open Interest Shorts: | 20.3 | 50.4 | 7.7 |
| – Net Position: | -649,485 | 801,073 | -151,588 |
| – Gross Longs: | 288,650 | 3,134,754 | 207,022 |
| – Gross Shorts: | 938,135 | 2,333,681 | 358,610 |
| – Long to Short Ratio: | 0.3 to 1 | 1.3 to 1 | 0.6 to 1 |
| NET POSITION TREND: | |||
| – Strength Index Score (3 Year Range Pct): | 57.4 | 40.7 | 71.1 |
| – Strength Index Reading (3 Year Range): | Bullish | Bearish | Bullish |
| NET POSITION MOVEMENT INDEX: | |||
| – 6-Week Change in Strength Index: | 9.0 | -10.4 | 19.5 |
Secured Overnight Financing Rate (3-Month) Futures:
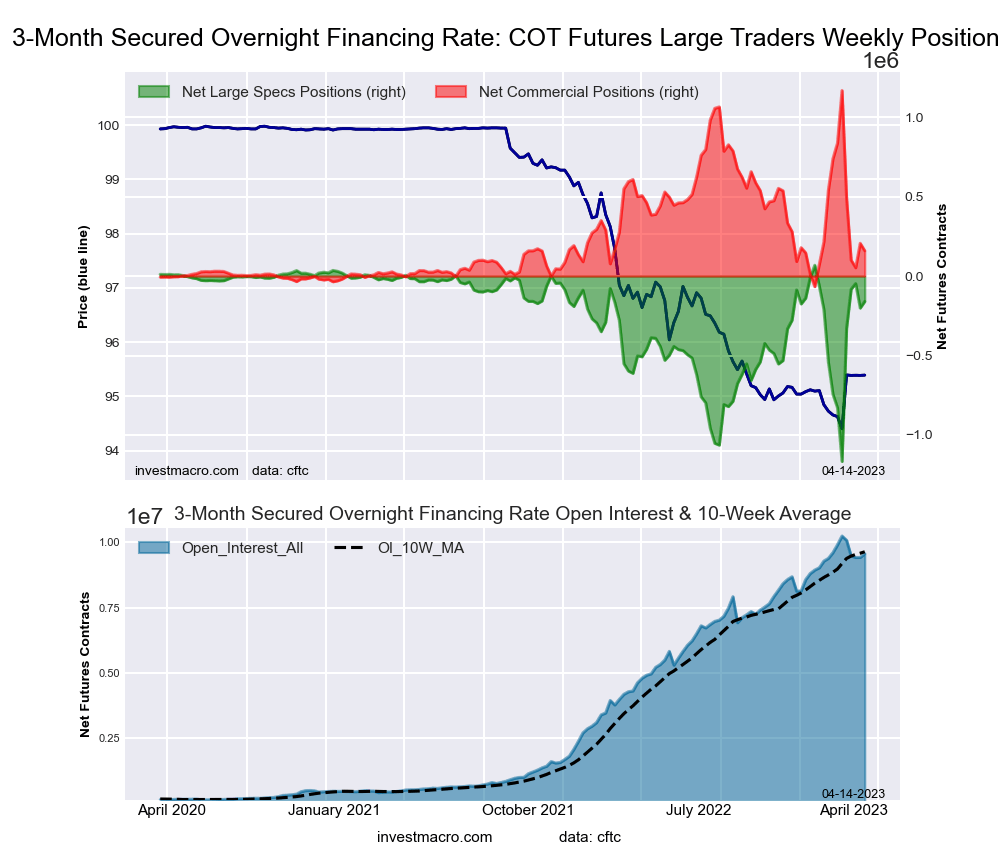 The Secured Overnight Financing Rate (3-Month) large speculator standing this week recorded a net position of -159,440 contracts in the data reported through Tuesday. This was a weekly advance of 41,837 contracts from the previous week which had a total of -201,277 net contracts.
This week’s current strength score (the trader positioning range over the past three years, measured from 0 to 100) shows the speculators are currently Bullish-Extreme with a score of 81.6 percent. The commercials are Bearish-Extreme with a score of 18.3 percent and the small traders (not shown in chart) are Bullish-Extreme with a score of 88.0 percent.
| SOFR 3-Months Statistics | SPECULATORS | COMMERCIALS | SMALL TRADERS |
| – Percent of Open Interest Longs: | 20.1 | 57.7 | 0.5 |
| – Percent of Open Interest Shorts: | 21.8 | 56.0 | 0.5 |
| – Net Position: | -159,440 | 159,269 | 171 |
| – Gross Longs: | 1,920,637 | 5,513,375 | 48,102 |
| – Gross Shorts: | 2,080,077 | 5,354,106 | 47,931 |
| – Long to Short Ratio: | 0.9 to 1 | 1.0 to 1 | 1.0 to 1 |
| NET POSITION TREND: | |||
| – Strength Index Score (3 Year Range Pct): | 81.6 | 18.3 | 88.0 |
| – Strength Index Reading (3 Year Range): | Bullish-Extreme | Bearish-Extreme | Bullish-Extreme |
| NET POSITION MOVEMENT INDEX: | |||
| – 6-Week Change in Strength Index: | 54.2 | -55.0 | 4.8 |
30-Day Federal Funds Futures:
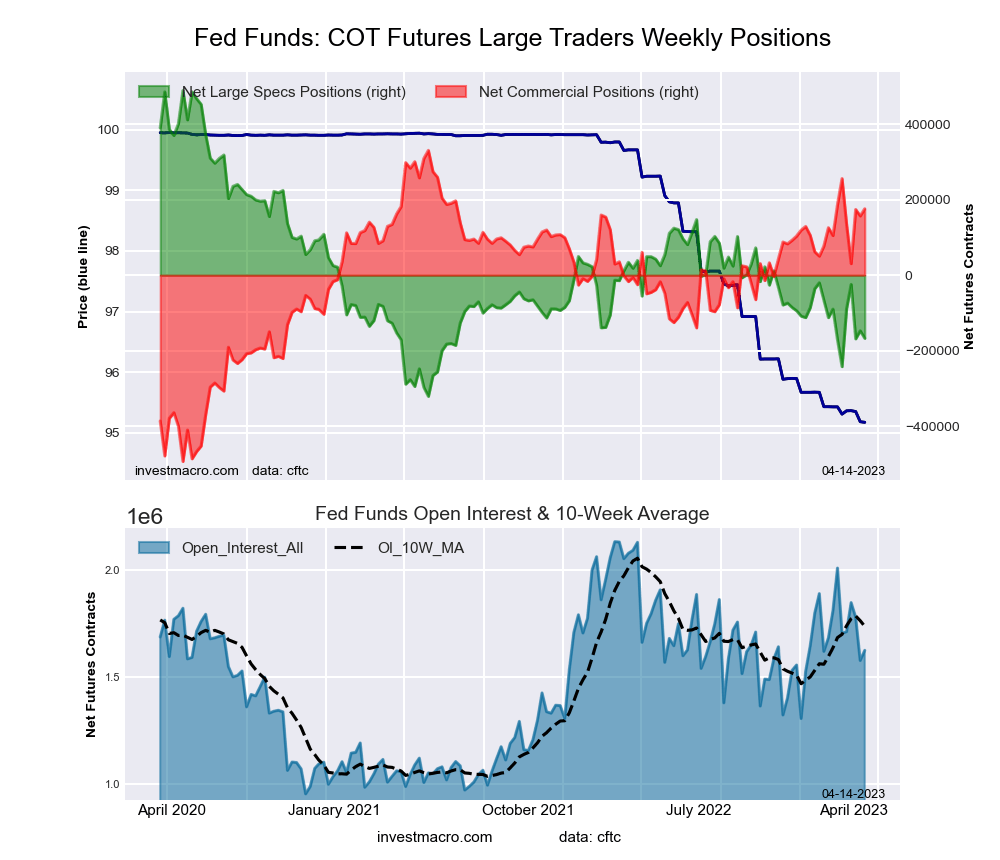 The 30-Day Federal Funds large speculator standing this week recorded a net position of -167,276 contracts in the data reported through Tuesday. This was a weekly decline of -20,036 contracts from the previous week which had a total of -147,240 net contracts.
This week’s current strength score (the trader positioning range over the past three years, measured from 0 to 100) shows the speculators are currently Bearish-Extreme with a score of 19.0 percent. The commercials are Bullish-Extreme with a score of 81.2 percent and the small traders (not shown in chart) are Bullish with a score of 74.1 percent.
| 30-Day Federal Funds Statistics | SPECULATORS | COMMERCIALS | SMALL TRADERS |
| – Percent of Open Interest Longs: | 2.3 | 82.1 | 2.4 |
| – Percent of Open Interest Shorts: | 12.6 | 71.3 | 2.9 |
| – Net Position: | -167,276 | 175,875 | -8,599 |
| – Gross Longs: | 37,100 | 1,334,569 | 38,360 |
| – Gross Shorts: | 204,376 | 1,158,694 | 46,959 |
| – Long to Short Ratio: | 0.2 to 1 | 1.2 to 1 | 0.8 to 1 |
| NET POSITION TREND: | |||
| – Strength Index Score (3 Year Range Pct): | 19.0 | 81.2 | 74.1 |
| – Strength Index Reading (3 Year Range): | Bearish-Extreme | Bullish-Extreme | Bullish |
| NET POSITION MOVEMENT INDEX: | |||
| – 6-Week Change in Strength Index: | 0.5 | -1.3 | 14.0 |
2-Year Treasury Note Futures:
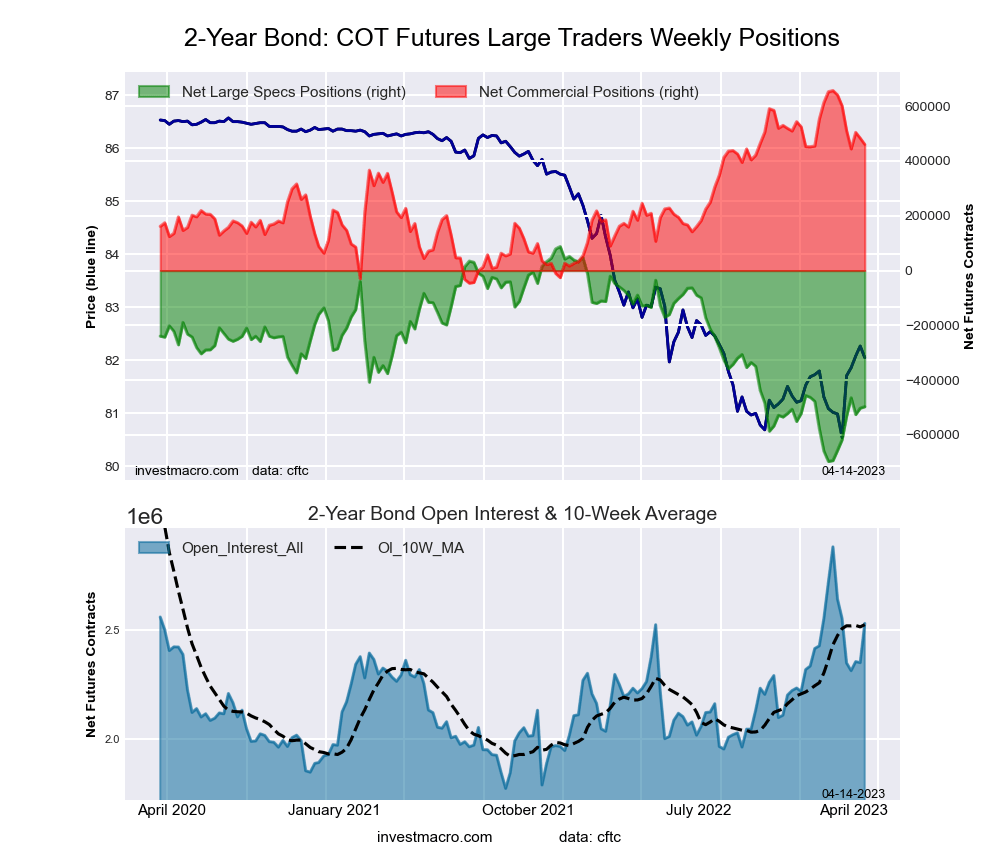 The 2-Year Treasury Note large speculator standing this week recorded a net position of -496,841 contracts in the data reported through Tuesday. This was a weekly advance of 5,214 contracts from the previous week which had a total of -502,055 net contracts.
This week’s current strength score (the trader positioning range over the past three years, measured from 0 to 100) shows the speculators are currently Bearish with a score of 25.5 percent. The commercials are Bullish with a score of 72.0 percent and the small traders (not shown in chart) are Bullish with a score of 73.3 percent.
| 2-Year Treasury Note Statistics | SPECULATORS | COMMERCIALS | SMALL TRADERS |
| – Percent of Open Interest Longs: | 8.7 | 82.3 | 8.1 |
| – Percent of Open Interest Shorts: | 28.4 | 64.2 | 6.7 |
| – Net Position: | -496,841 | 460,413 | 36,428 |
| – Gross Longs: | 221,139 | 2,084,824 | 205,672 |
| – Gross Shorts: | 717,980 | 1,624,411 | 169,244 |
| – Long to Short Ratio: | 0.3 to 1 | 1.3 to 1 | 1.2 to 1 |
| NET POSITION TREND: | |||
| – Strength Index Score (3 Year Range Pct): | 25.5 | 72.0 | 73.3 |
| – Strength Index Reading (3 Year Range): | Bearish | Bullish | Bullish |
| NET POSITION MOVEMENT INDEX: | |||
| – 6-Week Change in Strength Index: | 20.4 | -25.7 | 9.9 |
5-Year Treasury Note Futures:
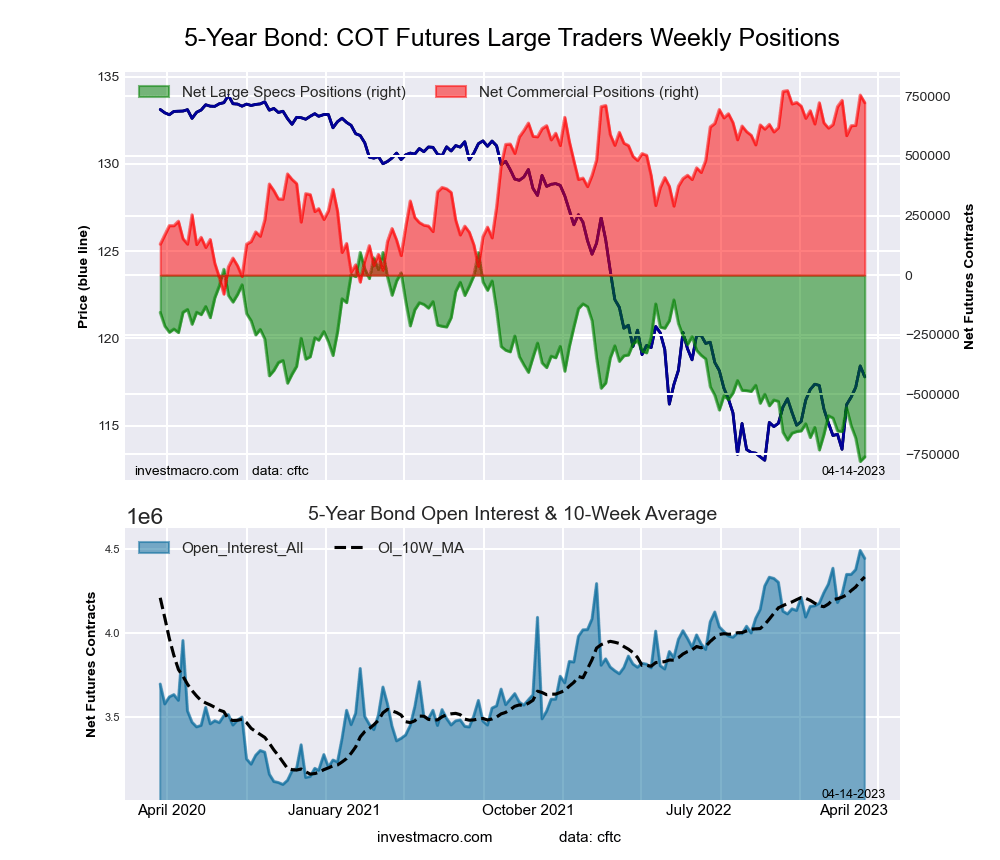 The 5-Year Treasury Note large speculator standing this week recorded a net position of -761,981 contracts in the data reported through Tuesday. This was a weekly gain of 19,258 contracts from the previous week which had a total of -781,239 net contracts.
This week’s current strength score (the trader positioning range over the past three years, measured from 0 to 100) shows the speculators are currently Bearish-Extreme with a score of 2.2 percent. The commercials are Bullish-Extreme with a score of 94.0 percent and the small traders (not shown in chart) are Bullish-Extreme with a score of 91.8 percent.
| 5-Year Treasury Note Statistics | SPECULATORS | COMMERCIALS | SMALL TRADERS |
| – Percent of Open Interest Longs: | 7.0 | 83.4 | 8.2 |
| – Percent of Open Interest Shorts: | 24.2 | 67.2 | 7.3 |
| – Net Position: | -761,981 | 722,702 | 39,279 |
| – Gross Longs: | 312,076 | 3,708,958 | 365,278 |
| – Gross Shorts: | 1,074,057 | 2,986,256 | 325,999 |
| – Long to Short Ratio: | 0.3 to 1 | 1.2 to 1 | 1.1 to 1 |
| NET POSITION TREND: | |||
| – Strength Index Score (3 Year Range Pct): | 2.2 | 94.0 | 91.8 |
| – Strength Index Reading (3 Year Range): | Bearish-Extreme | Bullish-Extreme | Bullish-Extreme |
| NET POSITION MOVEMENT INDEX: | |||
| – 6-Week Change in Strength Index: | -12.4 | 1.9 | 25.4 |
10-Year Treasury Note Futures:
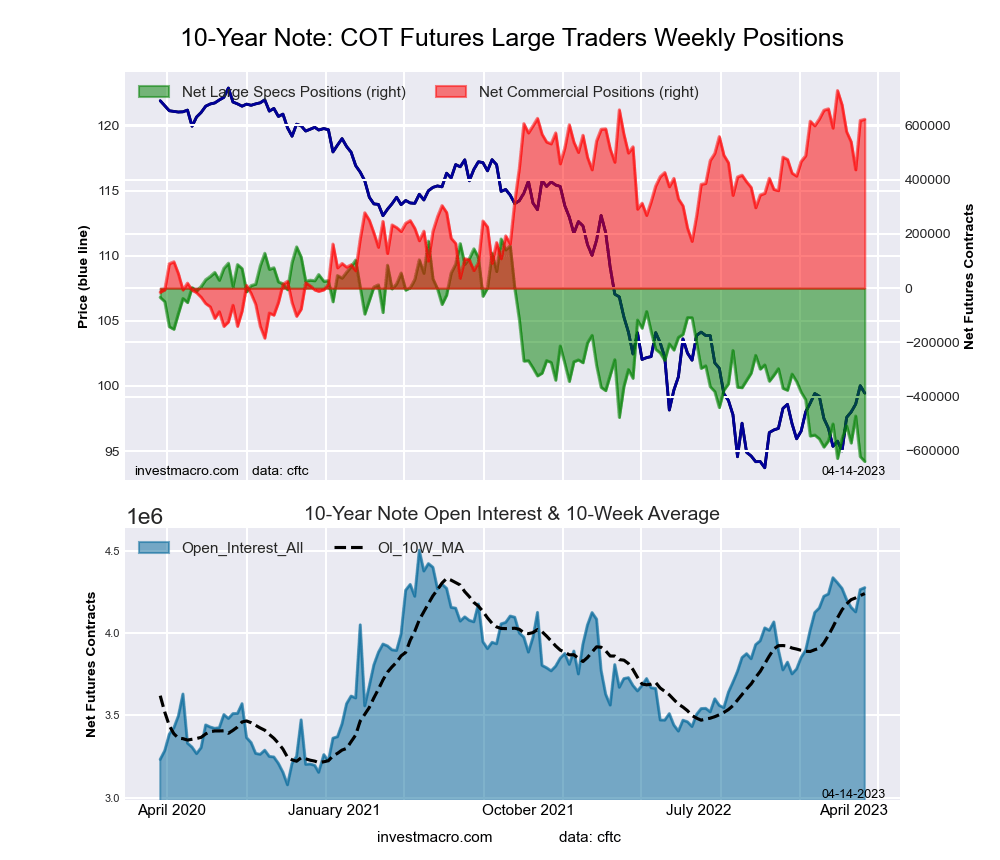 The 10-Year Treasury Note large speculator standing this week recorded a net position of -639,037 contracts in the data reported through Tuesday. This was a weekly reduction of -18,006 contracts from the previous week which had a total of -621,031 net contracts.
This week’s current strength score (the trader positioning range over the past three years, measured from 0 to 100) shows the speculators are currently Bearish-Extreme with a score of 0.0 percent. The commercials are Bullish-Extreme with a score of 88.4 percent and the small traders (not shown in chart) are Bullish-Extreme with a score of 87.4 percent.
| 10-Year Treasury Note Statistics | SPECULATORS | COMMERCIALS | SMALL TRADERS |
| – Percent of Open Interest Longs: | 9.8 | 79.7 | 8.7 |
| – Percent of Open Interest Shorts: | 24.7 | 65.1 | 8.3 |
| – Net Position: | -639,037 | 622,661 | 16,376 |
| – Gross Longs: | 418,080 | 3,405,619 | 371,253 |
| – Gross Shorts: | 1,057,117 | 2,782,958 | 354,877 |
| – Long to Short Ratio: | 0.4 to 1 | 1.2 to 1 | 1.0 to 1 |
| NET POSITION TREND: | |||
| – Strength Index Score (3 Year Range Pct): | 0.0 | 88.4 | 87.4 |
| – Strength Index Reading (3 Year Range): | Bearish-Extreme | Bullish-Extreme | Bullish-Extreme |
| NET POSITION MOVEMENT INDEX: | |||
| – 6-Week Change in Strength Index: | -1.4 | -11.6 | 28.9 |
Ultra 10-Year Notes Futures:
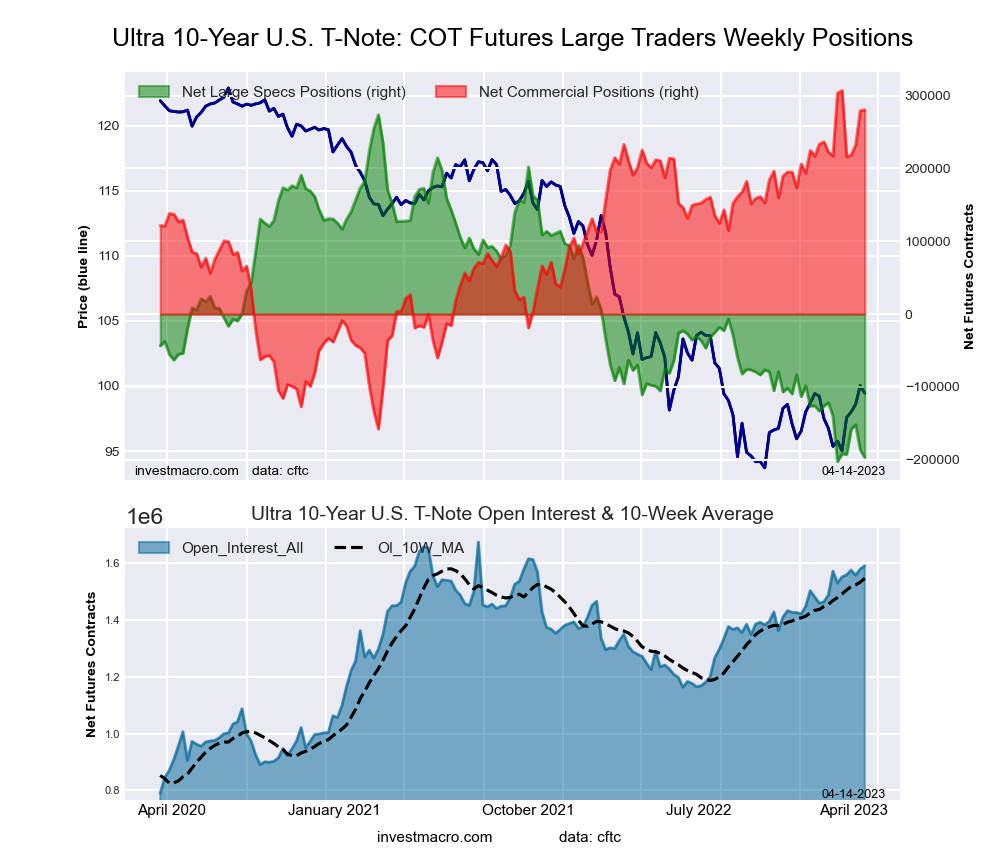 The Ultra 10-Year Notes large speculator standing this week recorded a net position of -196,971 contracts in the data reported through Tuesday. This was a weekly fall of -10,494 contracts from the previous week which had a total of -186,477 net contracts.
This week’s current strength score (the trader positioning range over the past three years, measured from 0 to 100) shows the speculators are currently Bearish-Extreme with a score of 1.2 percent. The commercials are Bullish-Extreme with a score of 94.3 percent and the small traders (not shown in chart) are Bullish with a score of 64.4 percent.
| Ultra 10-Year Notes Statistics | SPECULATORS | COMMERCIALS | SMALL TRADERS |
| – Percent of Open Interest Longs: | 7.9 | 81.1 | 9.7 |
| – Percent of Open Interest Shorts: | 20.3 | 63.4 | 14.9 |
| – Net Position: | -196,971 | 280,480 | -83,509 |
| – Gross Longs: | 126,517 | 1,290,288 | 153,890 |
| – Gross Shorts: | 323,488 | 1,009,808 | 237,399 |
| – Long to Short Ratio: | 0.4 to 1 | 1.3 to 1 | 0.6 to 1 |
| NET POSITION TREND: | |||
| – Strength Index Score (3 Year Range Pct): | 1.2 | 94.3 | 64.4 |
| – Strength Index Reading (3 Year Range): | Bearish-Extreme | Bullish-Extreme | Bullish |
| NET POSITION MOVEMENT INDEX: | |||
| – 6-Week Change in Strength Index: | 1.2 | -4.9 | 10.3 |
US Treasury Bonds Futures:
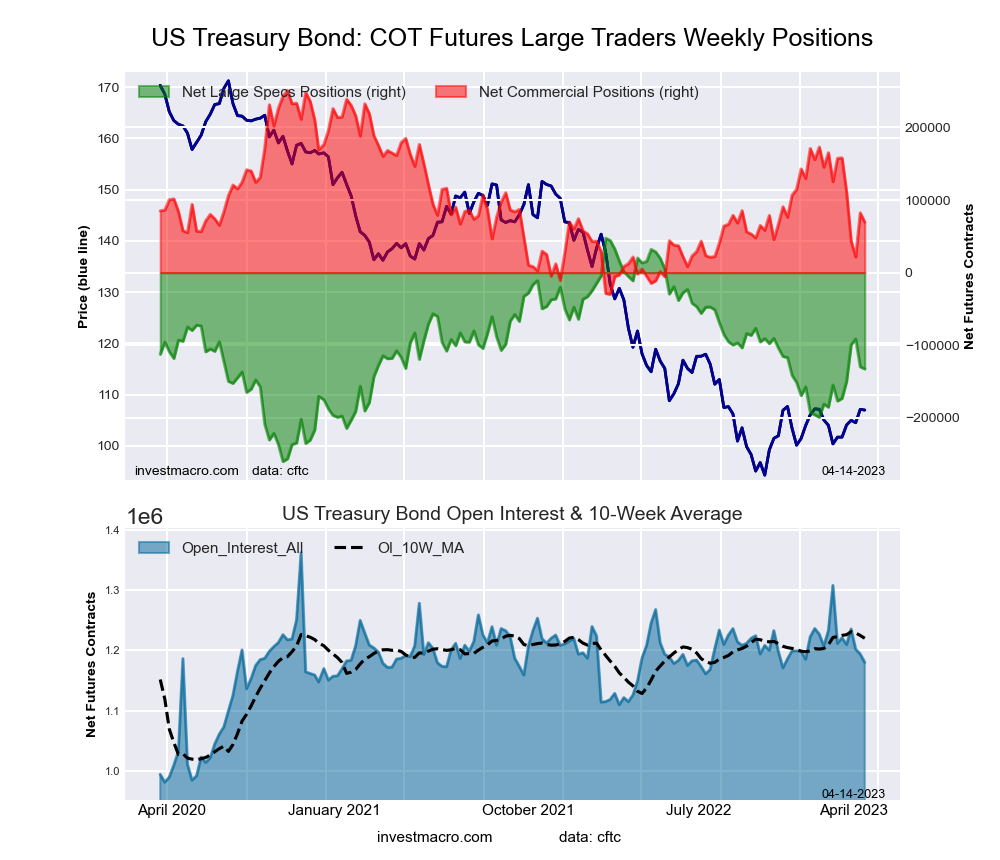 The US Treasury Bonds large speculator standing this week recorded a net position of -132,584 contracts in the data reported through Tuesday. This was a weekly decrease of -2,938 contracts from the previous week which had a total of -129,646 net contracts.
This week’s current strength score (the trader positioning range over the past three years, measured from 0 to 100) shows the speculators are currently Bearish with a score of 41.4 percent. The commercials are Bearish with a score of 35.4 percent and the small traders (not shown in chart) are Bullish-Extreme with a score of 95.1 percent.
| US Treasury Bonds Statistics | SPECULATORS | COMMERCIALS | SMALL TRADERS |
| – Percent of Open Interest Longs: | 5.9 | 79.0 | 14.7 |
| – Percent of Open Interest Shorts: | 17.2 | 73.1 | 9.4 |
| – Net Position: | -132,584 | 69,508 | 63,076 |
| – Gross Longs: | 69,855 | 932,461 | 173,415 |
| – Gross Shorts: | 202,439 | 862,953 | 110,339 |
| – Long to Short Ratio: | 0.3 to 1 | 1.1 to 1 | 1.6 to 1 |
| NET POSITION TREND: | |||
| – Strength Index Score (3 Year Range Pct): | 41.4 | 35.4 | 95.1 |
| – Strength Index Reading (3 Year Range): | Bearish | Bearish | Bullish-Extreme |
| NET POSITION MOVEMENT INDEX: | |||
| – 6-Week Change in Strength Index: | 14.4 | -31.3 | 32.2 |
Ultra US Treasury Bonds Futures:
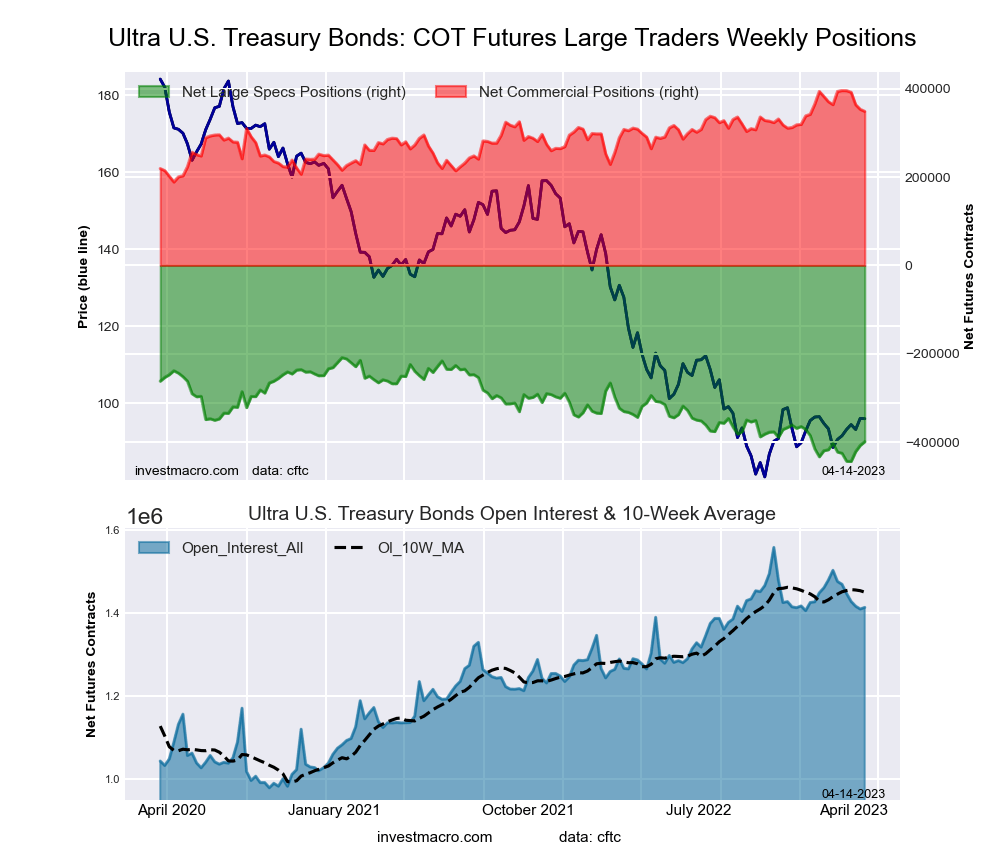 The Ultra US Treasury Bonds large speculator standing this week recorded a net position of -399,278 contracts in the data reported through Tuesday. This was a weekly rise of 8,480 contracts from the previous week which had a total of -407,758 net contracts.
This week’s current strength score (the trader positioning range over the past three years, measured from 0 to 100) shows the speculators are currently Bearish-Extreme with a score of 19.0 percent. The commercials are Bullish with a score of 77.2 percent and the small traders (not shown in chart) are Bullish-Extreme with a score of 90.4 percent.
| Ultra US Treasury Bonds Statistics | SPECULATORS | COMMERCIALS | SMALL TRADERS |
| – Percent of Open Interest Longs: | 5.5 | 83.0 | 11.3 |
| – Percent of Open Interest Shorts: | 33.8 | 58.3 | 7.7 |
| – Net Position: | -399,278 | 348,669 | 50,609 |
| – Gross Longs: | 78,023 | 1,172,982 | 159,503 |
| – Gross Shorts: | 477,301 | 824,313 | 108,894 |
| – Long to Short Ratio: | 0.2 to 1 | 1.4 to 1 | 1.5 to 1 |
| NET POSITION TREND: | |||
| – Strength Index Score (3 Year Range Pct): | 19.0 | 77.2 | 90.4 |
| – Strength Index Reading (3 Year Range): | Bearish-Extreme | Bullish | Bullish-Extreme |
| NET POSITION MOVEMENT INDEX: | |||
| – 6-Week Change in Strength Index: | 9.9 | -21.8 | 21.9 |
Article By InvestMacro – Receive our weekly COT Newsletter
*COT Report: The COT data, released weekly to the public each Friday, is updated through the most recent Tuesday (data is 3 days old) and shows a quick view of how large speculators or non-commercials (for-profit traders) were positioned in the futures markets.
The CFTC categorizes trader positions according to commercial hedgers (traders who use futures contracts for hedging as part of the business), non-commercials (large traders who speculate to realize trading profits) and nonreportable traders (usually small traders/speculators) as well as their open interest (contracts open in the market at time of reporting). See CFTC criteria here.

- Geopolitical and macroeconomic conditions continue to pressure market sentiment Jul 20, 2026
- USD/JPY Poised to Continue Gains as Expensive Oil and Lack of Support Weigh on Yen Jul 20, 2026
- COT Metals Charts: Weekly Speculator Bets led by Copper & Steel Jul 18, 2026
- COT Bonds Charts: Weekly Speculator Bets led by 2-Year, SOFR 3M & 5-Year Bonds Jul 18, 2026
- COT Energy Charts: Weekly Speculator Bets led by Brent Oil & Heating Oil Jul 18, 2026
- COT Soft Commodities Charts: Weekly Speculator Bets led by Wheat, Corn & Soybean Meal Jul 18, 2026
- The Bank of Canada kept its interest rate unchanged. Platinum prices reached a three‑week high Jul 16, 2026
- Stock indices rose after the release of US inflation data. China’s GDP slowed sharply Jul 15, 2026
- GBP/USD Awaits Political News: What Will Happen Next Jul 15, 2026
- USD/JPY Holds at Highs: Pressure Lingers on Yen Jul 14, 2026