
By InvestMacro

Here are the latest charts and statistics for the Commitment of Traders (COT) data published by the Commodities Futures Trading Commission (CFTC).
The latest COT data is updated through Tuesday January 3rdand shows a quick view of how large traders (for-profit speculators and commercial entities) were positioned in the futures markets.
Weekly Speculator Changes led by S&P500-Mini & MSCI EAFE-Mini
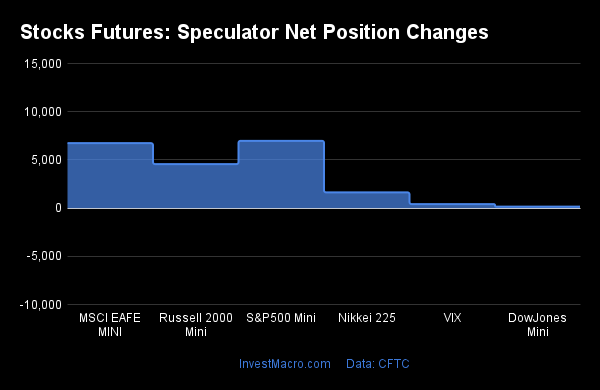
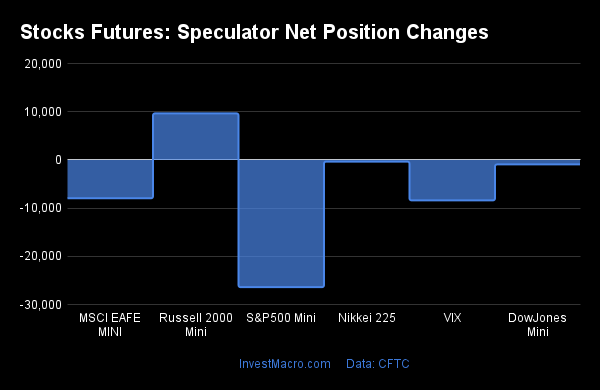
The COT stock markets speculator bets were higher this week as all of the eight stock markets we cover had higher positioning.
Leading the gains for the stock markets was S&P500-Mini (6,980 contracts) with the MSCI EAFE-Mini (6,738 contracts), Russell-Mini (4,563 contracts), Nikkei 225 (1,633 contracts), Nikkei 225 Yen (992 contracts), Nasdaq-Mini (190 contracts), DowJones-Mini (154 contracts) and the VIX (415 contracts) also showing positive weeks.
| Jan-03-2023 | OI | OI-Index | Spec-Net | Spec-Index | Com-Net | COM-Index | Smalls-Net | Smalls-Index |
|---|---|---|---|---|---|---|---|---|
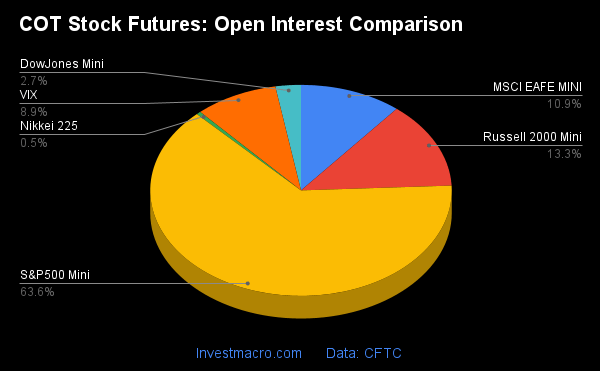
| S&P500-Mini | 2,010,996 | 2 | -167,301 | 25 | 166,552 | 72 | 749 | 27 |
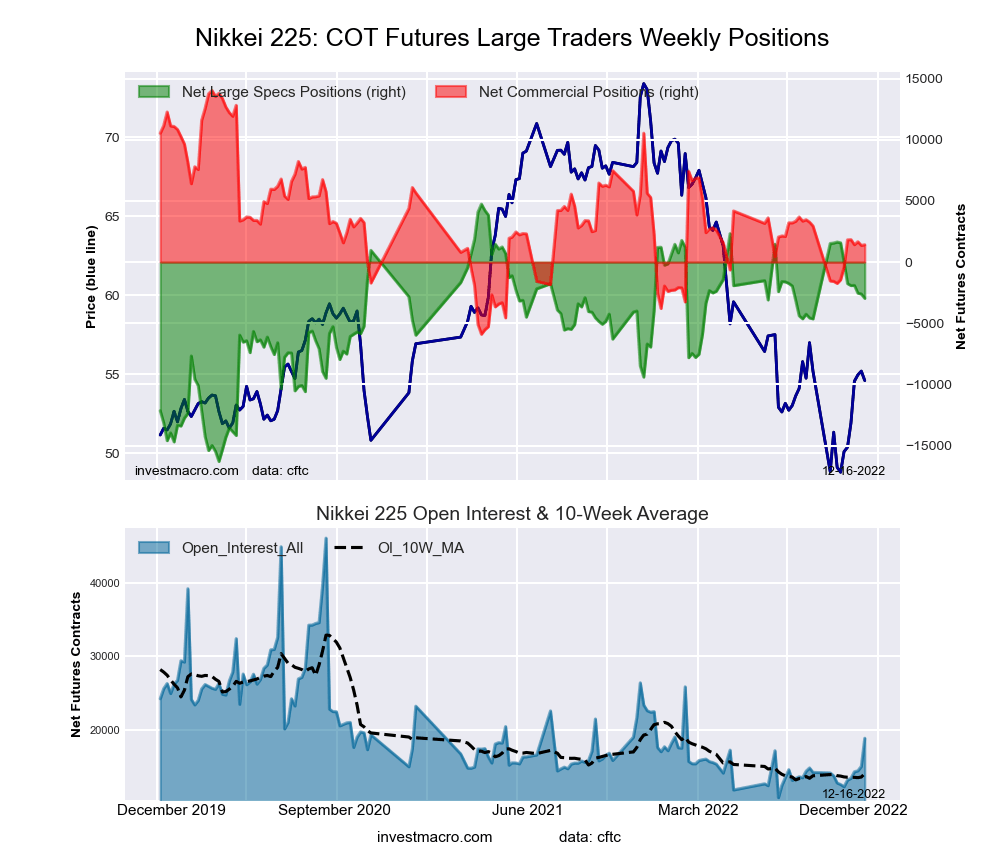
| Nikkei 225 | 11,889 | 3 | -2,974 | 63 | 2,892 | 44 | 82 | 29 |
| Nasdaq-Mini | 244,658 | 39 | 1,362 | 76 | 4,177 | 29 | -5,539 | 42 |
| DowJones-Mini | 79,731 | 42 | -11,891 | 25 | 16,039 | 79 | -4,148 | 19 |
| VIX | 297,329 | 33 | -68,000 | 67 | 75,329 | 35 | -7,329 | 56 |
| Nikkei 225 Yen | 38,248 | 17 | 6,205 | 53 | 75 | 10 | -6,280 | 68 |
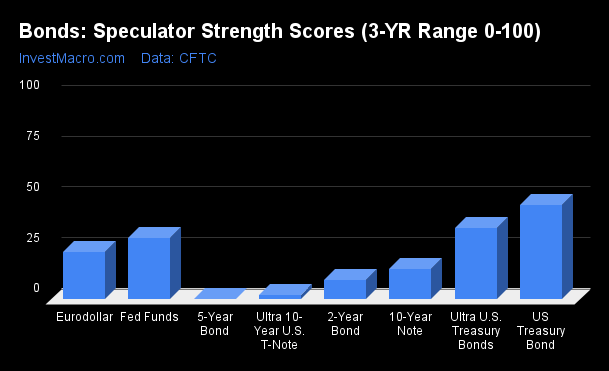
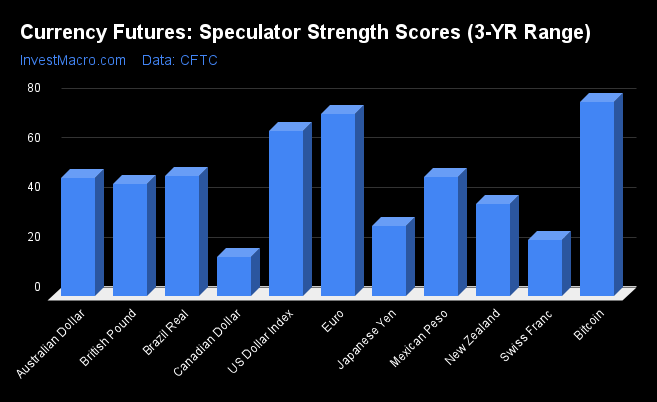
Strength Scores led by Nasdaq-Mini & VIX
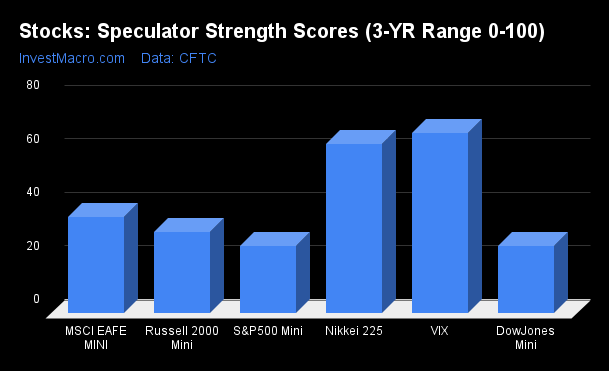
COT Strength Scores (a normalized measure of Speculator positions over a 3-Year range, from 0 to 100 where above 80 is Extreme-Bullish and below 20 is Extreme-Bearish) showed that the Nasdaq-Mini (76 percent) and the VIX (67 percent) lead the stock markets this week. The Nikkei 225 (63 percent) and Nikkei 225 Yen (53 percent) come in as the next highest in the weekly strength scores.
On the downside, the DowJones-Mini (25 percent) and the S&P500-Mini (25 percent) come in at the lowest strength levels currently.
Strength Statistics:
VIX (67.3 percent) vs VIX previous week (67.0 percent)
S&P500-Mini (25.2 percent) vs S&P500-Mini previous week (23.9 percent)
DowJones-Mini (25.2 percent) vs DowJones-Mini previous week (24.9 percent)
Nasdaq-Mini (75.8 percent) vs Nasdaq-Mini previous week (75.7 percent)
Russell2000-Mini (30.6 percent) vs Russell2000-Mini previous week (28.1 percent)
Nikkei USD (63.3 percent) vs Nikkei USD previous week (55.6 percent)
EAFE-Mini (36.1 percent) vs EAFE-Mini previous week (28.0 percent)
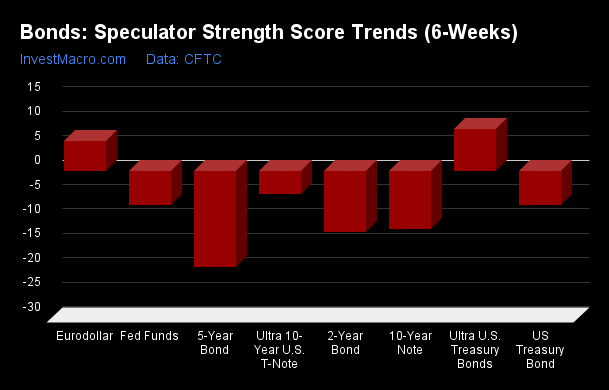
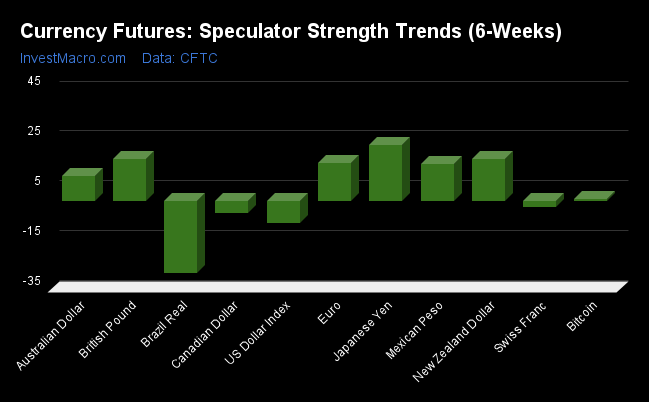
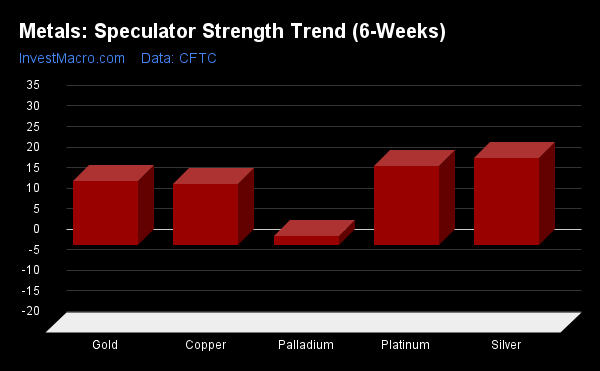
MSCI EAFE-Mini & Nikkei 225 Yen top the 6-Week Strength Trends
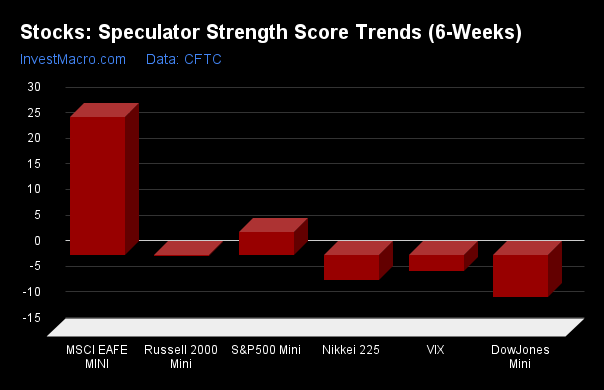
COT Strength Score Trends (or move index, calculates the 6-week changes in strength scores) showed that the MSCI EAFE-Mini (27 percent) leads the past six weeks trends for the stock markets. The S&P500-Mini (4.5 percent) comes in as the next highest positive mover in the latest trends data.
The DowJones-Mini (-8 percent) leads the downside trend scores currently with the Nikkei 225 (-5 percent) coming in as the next market with lower trend scores.
Strength Trend Statistics:
VIX (-3.1 percent) vs VIX previous week (-2.4 percent)
S&P500-Mini (4.5 percent) vs S&P500-Mini previous week (5.3 percent)
DowJones-Mini (-8.2 percent) vs DowJones-Mini previous week (-2.1 percent)
Nasdaq-Mini (-0.9 percent) vs Nasdaq-Mini previous week (3.6 percent)
Russell2000-Mini (-0.2 percent) vs Russell2000-Mini previous week (-1.1 percent)
Nikkei USD (-5.0 percent) vs Nikkei USD previous week (-13.6 percent)
EAFE-Mini (26.9 percent) vs EAFE-Mini previous week (25.0 percent)
Individual Stock Market Charts:
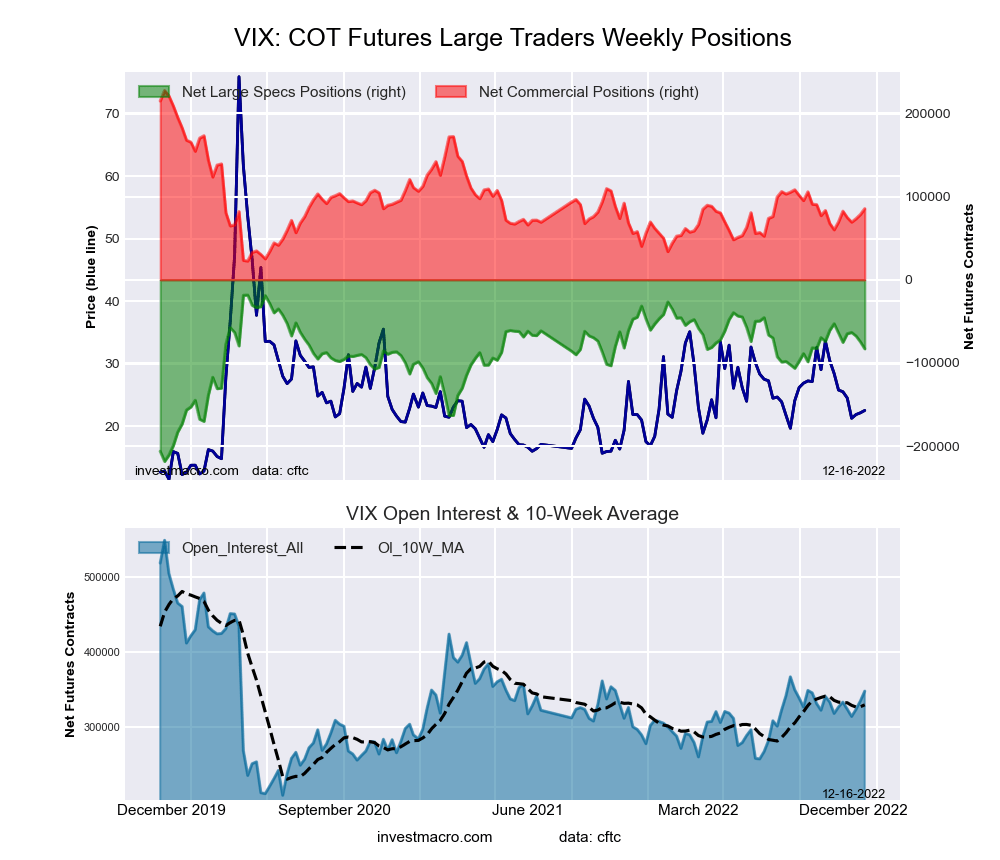
VIX Volatility Futures:
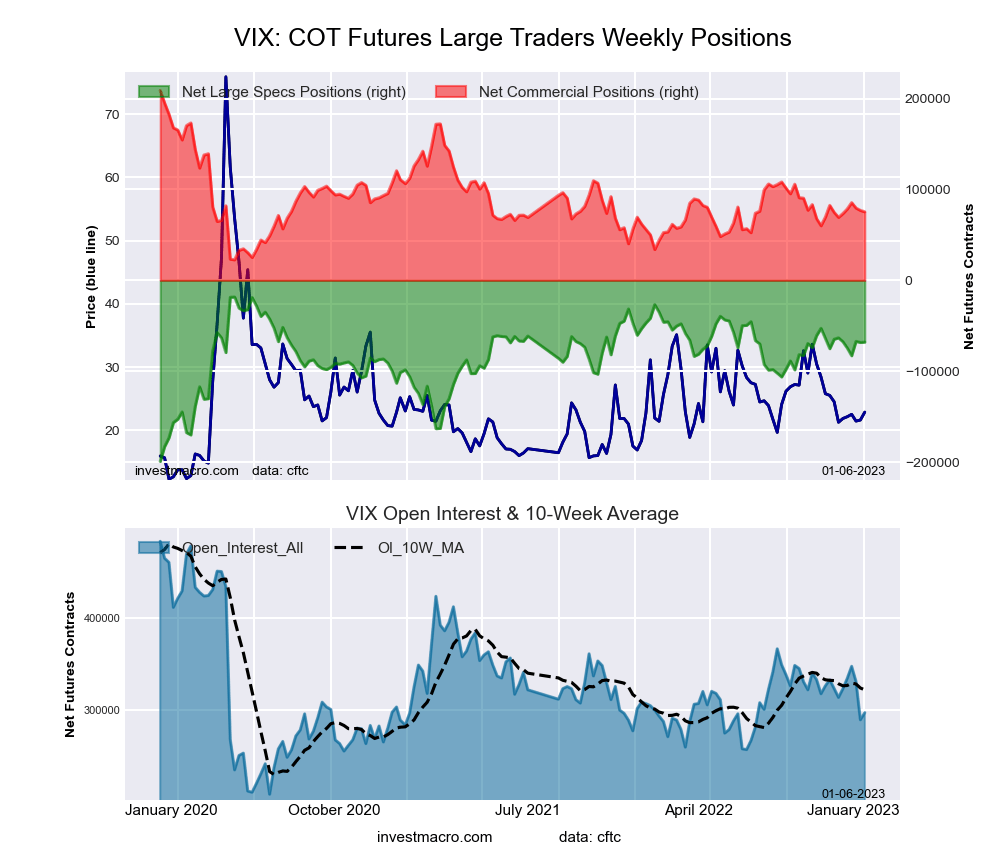 The VIX Volatility large speculator standing this week resulted in a net position of -68,000 contracts in the data reported through Tuesday. This was a weekly boost of 415 contracts from the previous week which had a total of -68,415 net contracts.
This week’s current strength score (the trader positioning range over the past three years, measured from 0 to 100) shows the speculators are currently Bullish with a score of 67.3 percent. The commercials are Bearish with a score of 35.1 percent and the small traders (not shown in chart) are Bullish with a score of 55.8 percent.
| VIX Volatility Futures Statistics | SPECULATORS | COMMERCIALS | SMALL TRADERS |
| – Percent of Open Interest Longs: | 19.1 | 56.6 | 6.4 |
| – Percent of Open Interest Shorts: | 41.9 | 31.3 | 8.9 |
| – Net Position: | -68,000 | 75,329 | -7,329 |
| – Gross Longs: | 56,713 | 168,326 | 18,988 |
| – Gross Shorts: | 124,713 | 92,997 | 26,317 |
| – Long to Short Ratio: | 0.5 to 1 | 1.8 to 1 | 0.7 to 1 |
| NET POSITION TREND: | |||
| – Strength Index Score (3 Year Range Pct): | 67.3 | 35.1 | 55.8 |
| – Strength Index Reading (3 Year Range): | Bullish | Bearish | Bullish |
| NET POSITION MOVEMENT INDEX: | |||
| – 6-Week Change in Strength Index: | -3.1 | 4.0 | -6.8 |
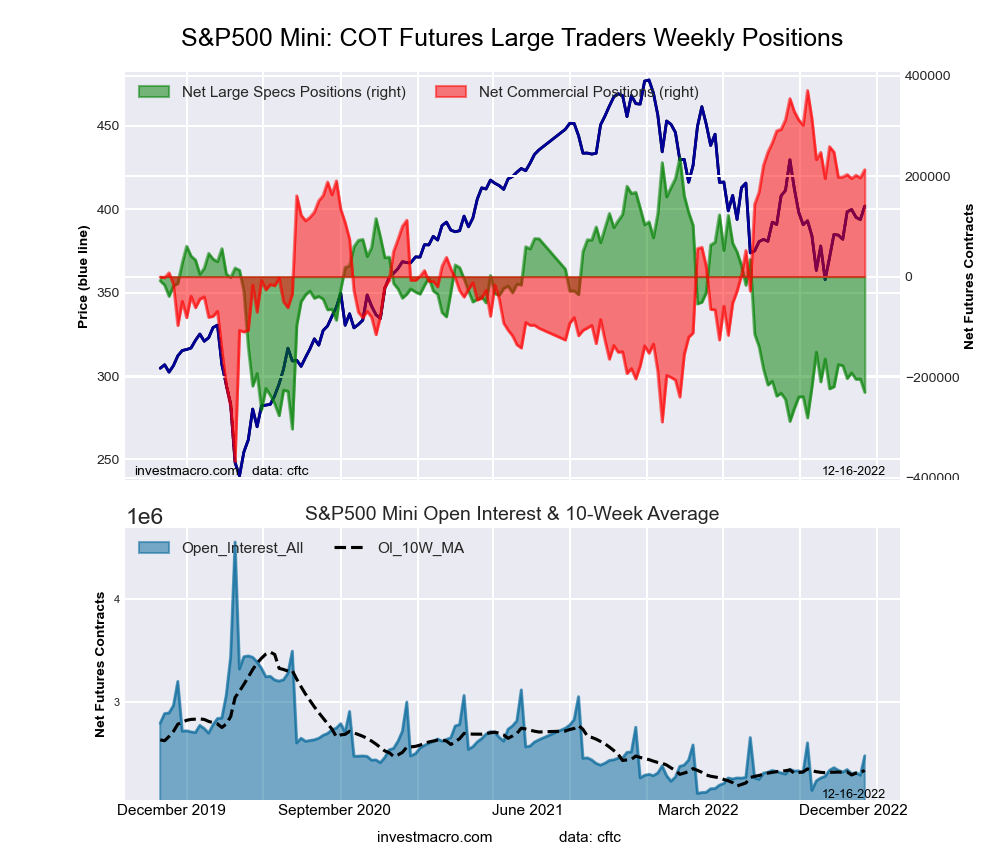
S&P500 Mini Futures:
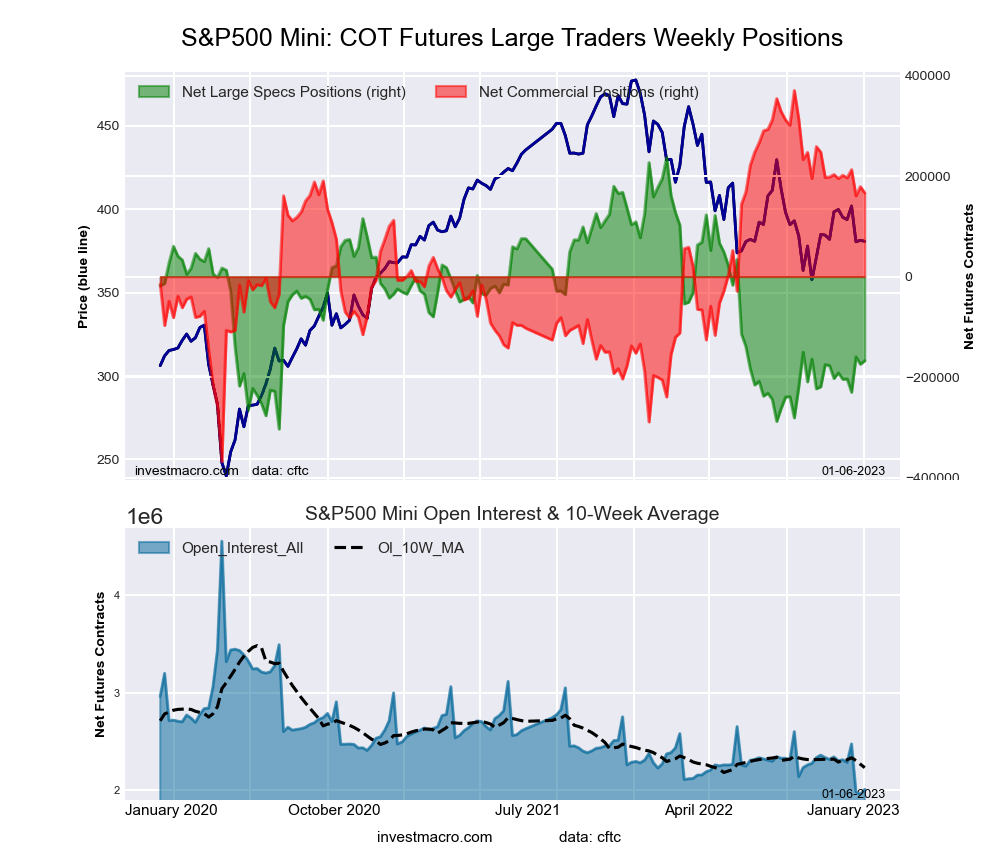 The S&P500 Mini large speculator standing this week resulted in a net position of -167,301 contracts in the data reported through Tuesday. This was a weekly rise of 6,980 contracts from the previous week which had a total of -174,281 net contracts.
This week’s current strength score (the trader positioning range over the past three years, measured from 0 to 100) shows the speculators are currently Bearish with a score of 25.2 percent. The commercials are Bullish with a score of 72.4 percent and the small traders (not shown in chart) are Bearish with a score of 26.5 percent.
| S&P500 Mini Futures Statistics | SPECULATORS | COMMERCIALS | SMALL TRADERS |
| – Percent of Open Interest Longs: | 13.0 | 73.3 | 11.6 |
| – Percent of Open Interest Shorts: | 21.3 | 65.1 | 11.5 |
| – Net Position: | -167,301 | 166,552 | 749 |
| – Gross Longs: | 261,260 | 1,474,811 | 232,853 |
| – Gross Shorts: | 428,561 | 1,308,259 | 232,104 |
| – Long to Short Ratio: | 0.6 to 1 | 1.1 to 1 | 1.0 to 1 |
| NET POSITION TREND: | |||
| – Strength Index Score (3 Year Range Pct): | 25.2 | 72.4 | 26.5 |
| – Strength Index Reading (3 Year Range): | Bearish | Bullish | Bearish |
| NET POSITION MOVEMENT INDEX: | |||
| – 6-Week Change in Strength Index: | 4.5 | -3.9 | 0.9 |
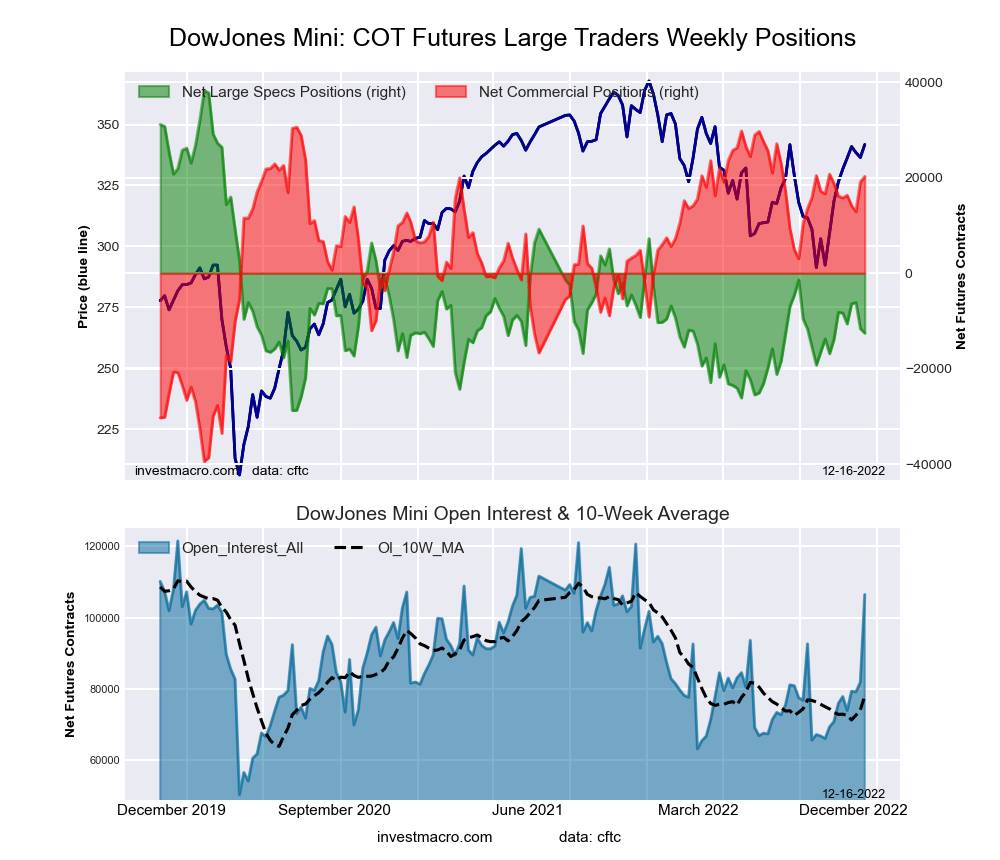
Dow Jones Mini Futures:
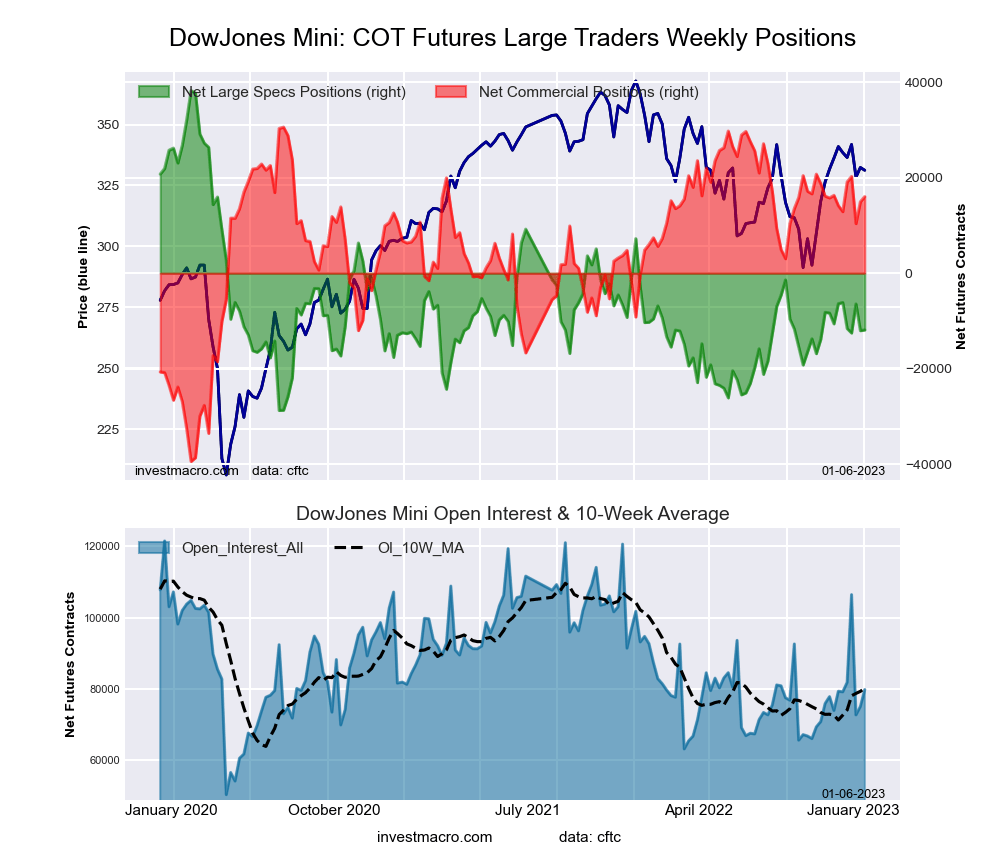 The Dow Jones Mini large speculator standing this week resulted in a net position of -11,891 contracts in the data reported through Tuesday. This was a weekly gain of 154 contracts from the previous week which had a total of -12,045 net contracts.
This week’s current strength score (the trader positioning range over the past three years, measured from 0 to 100) shows the speculators are currently Bearish with a score of 25.2 percent. The commercials are Bullish with a score of 79.2 percent and the small traders (not shown in chart) are Bearish-Extreme with a score of 19.5 percent.
| Dow Jones Mini Futures Statistics | SPECULATORS | COMMERCIALS | SMALL TRADERS |
| – Percent of Open Interest Longs: | 31.7 | 51.3 | 14.5 |
| – Percent of Open Interest Shorts: | 46.6 | 31.2 | 19.7 |
| – Net Position: | -11,891 | 16,039 | -4,148 |
| – Gross Longs: | 25,248 | 40,900 | 11,541 |
| – Gross Shorts: | 37,139 | 24,861 | 15,689 |
| – Long to Short Ratio: | 0.7 to 1 | 1.6 to 1 | 0.7 to 1 |
| NET POSITION TREND: | |||
| – Strength Index Score (3 Year Range Pct): | 25.2 | 79.2 | 19.5 |
| – Strength Index Reading (3 Year Range): | Bearish | Bullish | Bearish-Extreme |
| NET POSITION MOVEMENT INDEX: | |||
| – 6-Week Change in Strength Index: | -8.2 | 2.7 | 18.5 |
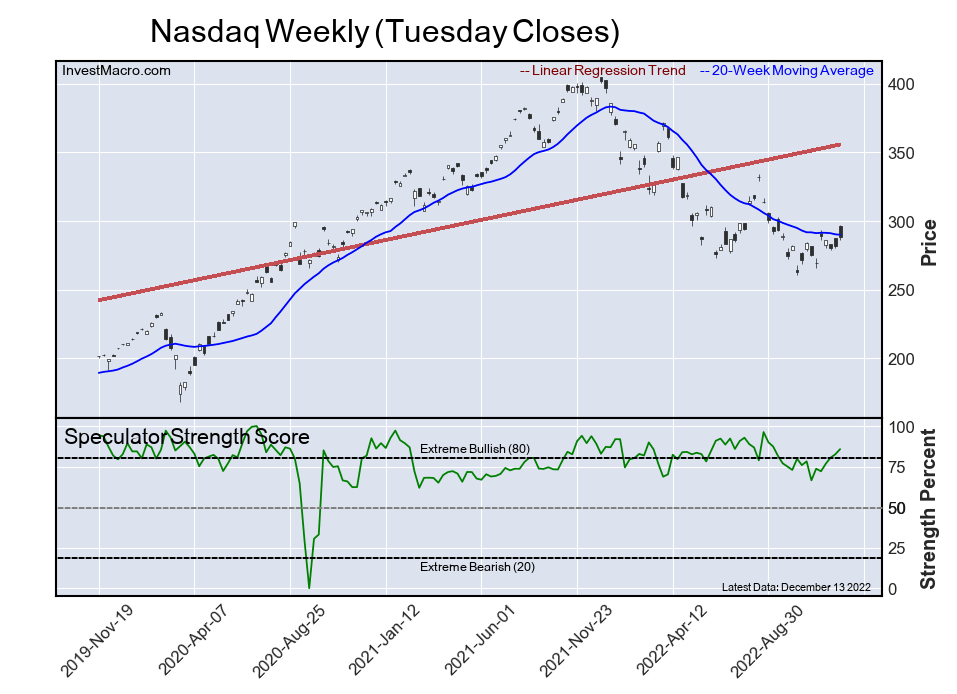
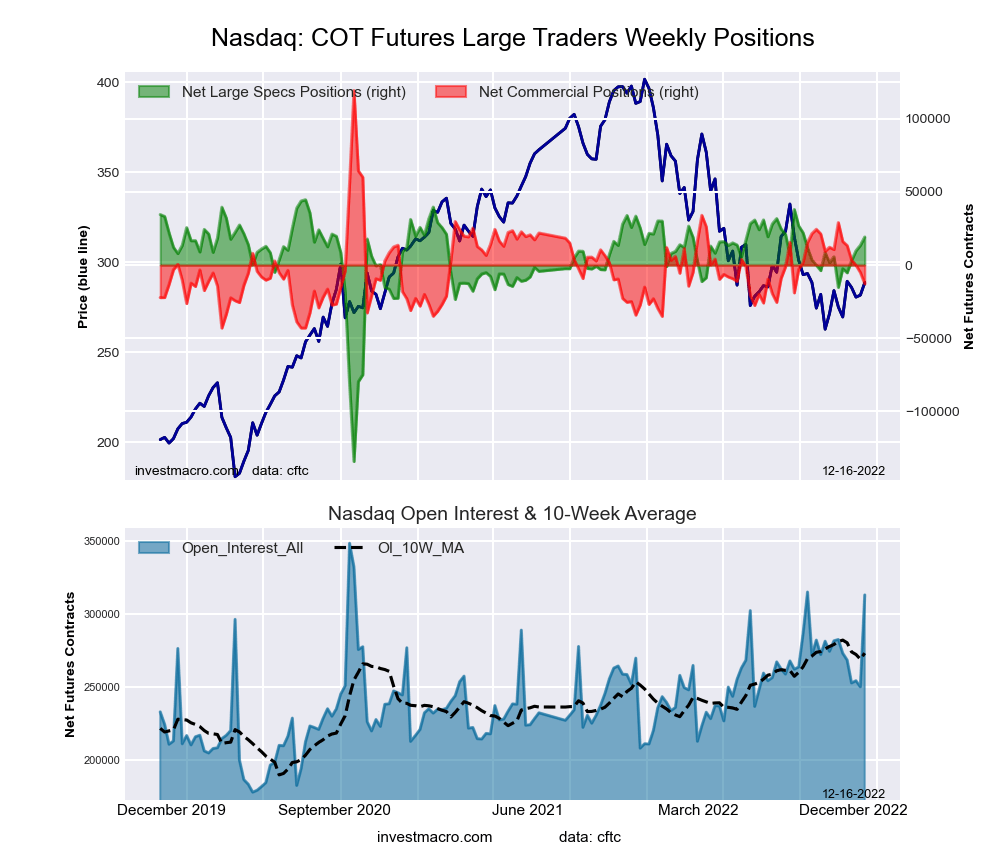
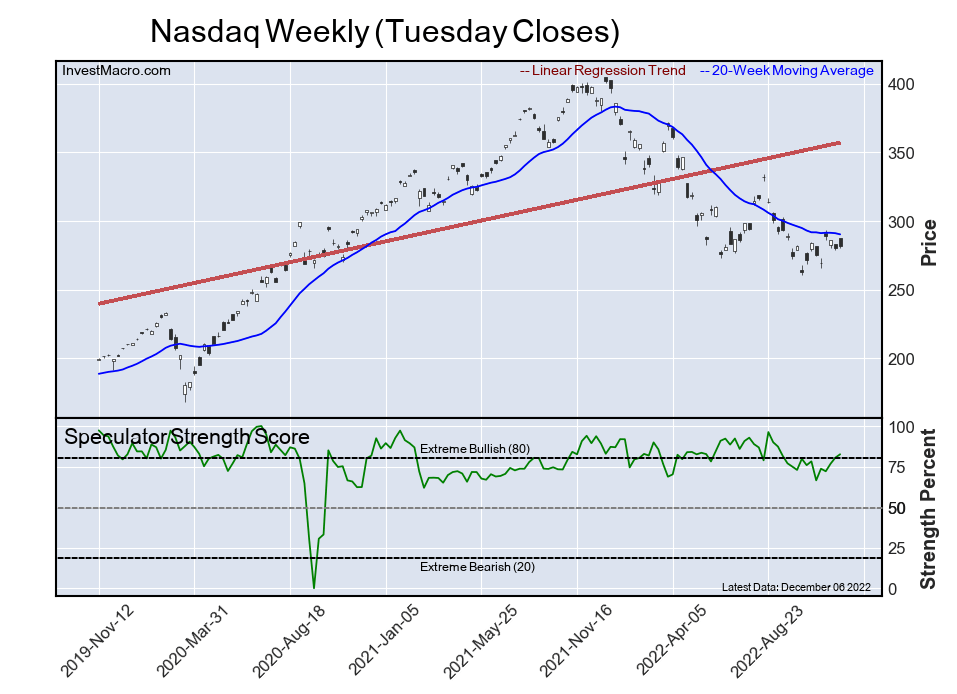
Nasdaq Mini Futures:
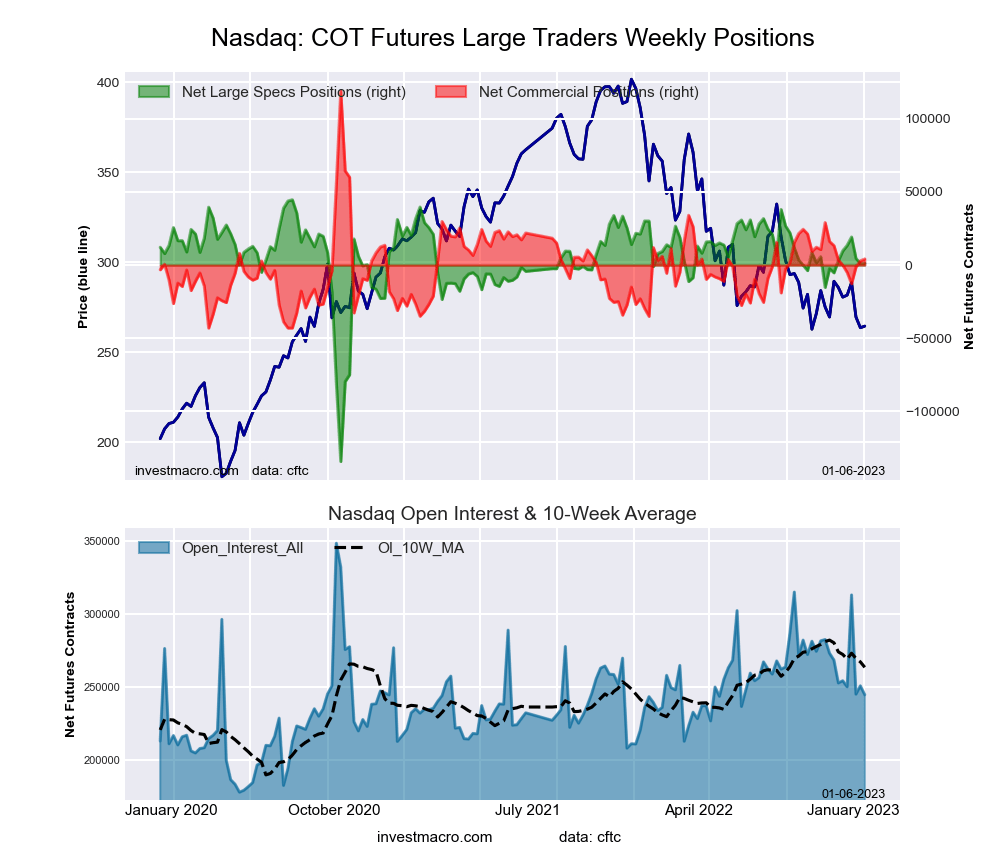 The Nasdaq Mini large speculator standing this week resulted in a net position of 1,362 contracts in the data reported through Tuesday. This was a weekly gain of 190 contracts from the previous week which had a total of 1,172 net contracts.
This week’s current strength score (the trader positioning range over the past three years, measured from 0 to 100) shows the speculators are currently Bullish with a score of 75.8 percent. The commercials are Bearish with a score of 29.1 percent and the small traders (not shown in chart) are Bearish with a score of 41.7 percent.
| Nasdaq Mini Futures Statistics | SPECULATORS | COMMERCIALS | SMALL TRADERS |
| – Percent of Open Interest Longs: | 24.4 | 59.6 | 14.1 |
| – Percent of Open Interest Shorts: | 23.9 | 57.9 | 16.4 |
| – Net Position: | 1,362 | 4,177 | -5,539 |
| – Gross Longs: | 59,802 | 145,713 | 34,484 |
| – Gross Shorts: | 58,440 | 141,536 | 40,023 |
| – Long to Short Ratio: | 1.0 to 1 | 1.0 to 1 | 0.9 to 1 |
| NET POSITION TREND: | |||
| – Strength Index Score (3 Year Range Pct): | 75.8 | 29.1 | 41.7 |
| – Strength Index Reading (3 Year Range): | Bullish | Bearish | Bearish |
| NET POSITION MOVEMENT INDEX: | |||
| – 6-Week Change in Strength Index: | -0.9 | 0.5 | 1.8 |
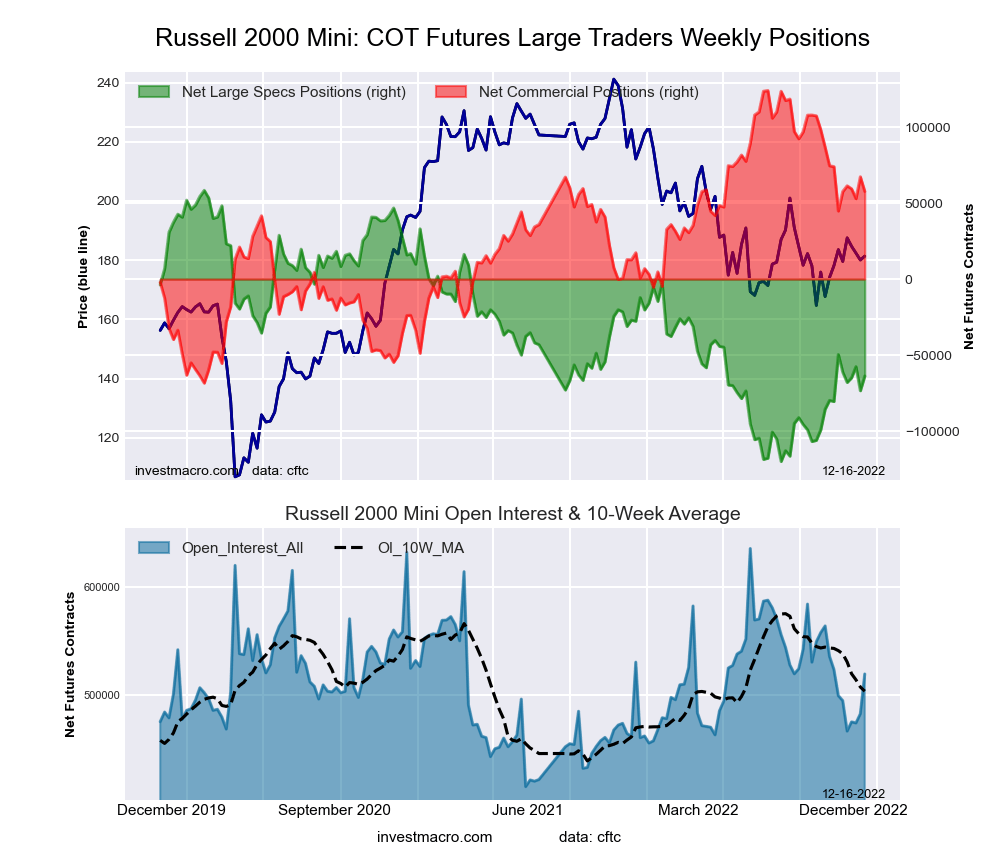
Russell 2000 Mini Futures:
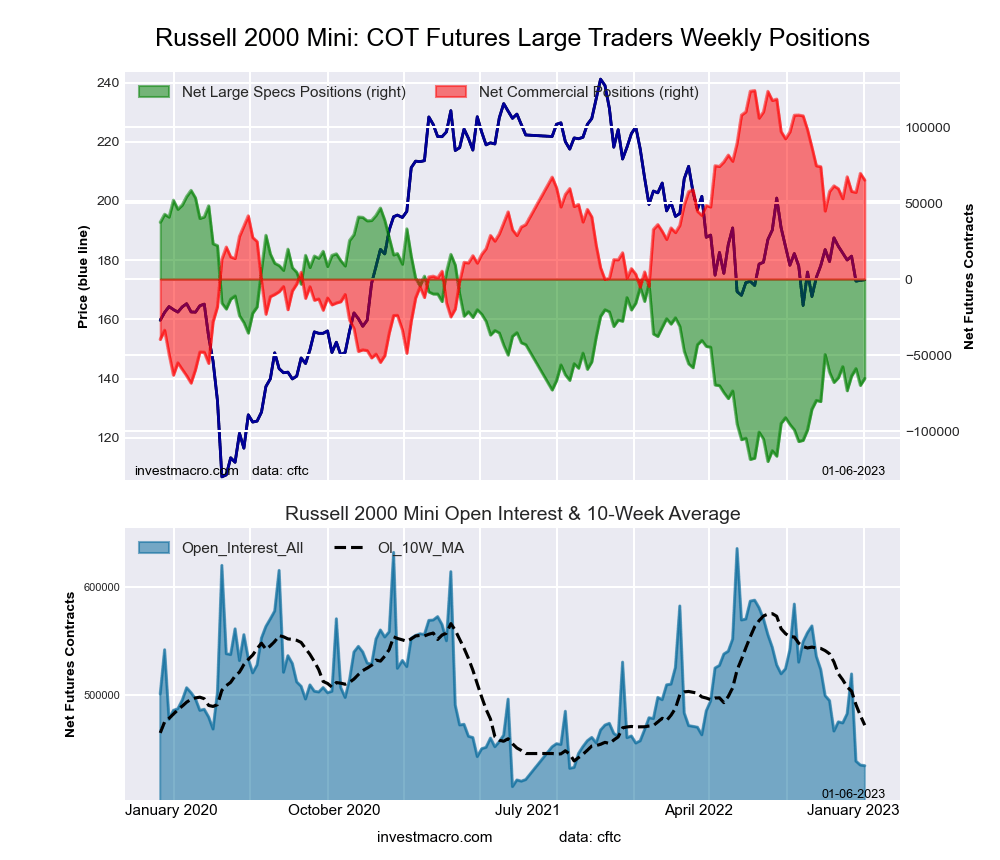 The Russell 2000 Mini large speculator standing this week resulted in a net position of -65,361 contracts in the data reported through Tuesday. This was a weekly boost of 4,563 contracts from the previous week which had a total of -69,924 net contracts.
This week’s current strength score (the trader positioning range over the past three years, measured from 0 to 100) shows the speculators are currently Bearish with a score of 30.6 percent. The commercials are Bullish with a score of 69.4 percent and the small traders (not shown in chart) are Bearish with a score of 27.5 percent.
| Russell 2000 Mini Futures Statistics | SPECULATORS | COMMERCIALS | SMALL TRADERS |
| – Percent of Open Interest Longs: | 10.1 | 83.6 | 5.1 |
| – Percent of Open Interest Shorts: | 25.1 | 68.6 | 5.0 |
| – Net Position: | -65,361 | 65,079 | 282 |
| – Gross Longs: | 43,799 | 363,125 | 21,973 |
| – Gross Shorts: | 109,160 | 298,046 | 21,691 |
| – Long to Short Ratio: | 0.4 to 1 | 1.2 to 1 | 1.0 to 1 |
| NET POSITION TREND: | |||
| – Strength Index Score (3 Year Range Pct): | 30.6 | 69.4 | 27.5 |
| – Strength Index Reading (3 Year Range): | Bearish | Bullish | Bearish |
| NET POSITION MOVEMENT INDEX: | |||
| – 6-Week Change in Strength Index: | -0.2 | 3.0 | -16.3 |
Nikkei Stock Average (USD) Futures:
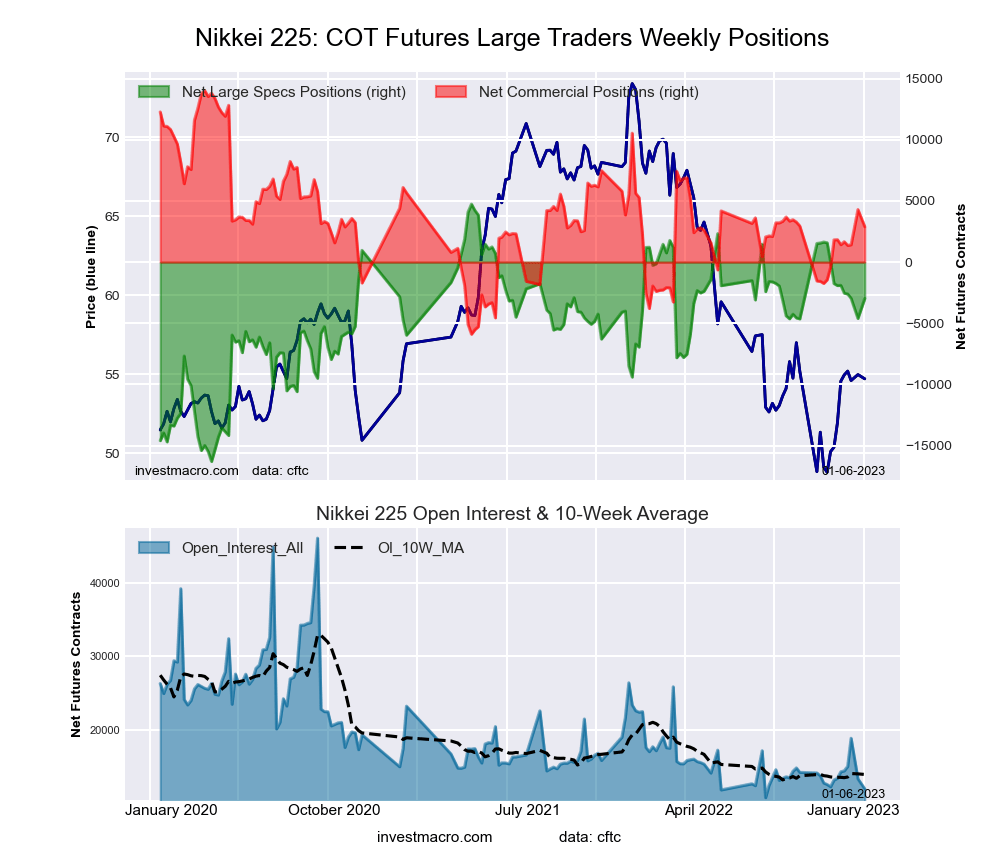 The Nikkei Stock Average (USD) large speculator standing this week resulted in a net position of -2,974 contracts in the data reported through Tuesday. This was a weekly boost of 1,633 contracts from the previous week which had a total of -4,607 net contracts.
This week’s current strength score (the trader positioning range over the past three years, measured from 0 to 100) shows the speculators are currently Bullish with a score of 63.3 percent. The commercials are Bearish with a score of 44.1 percent and the small traders (not shown in chart) are Bearish with a score of 29.4 percent.
| Nikkei Stock Average Futures Statistics | SPECULATORS | COMMERCIALS | SMALL TRADERS |
| – Percent of Open Interest Longs: | 21.9 | 52.5 | 25.6 |
| – Percent of Open Interest Shorts: | 47.0 | 28.2 | 24.9 |
| – Net Position: | -2,974 | 2,892 | 82 |
| – Gross Longs: | 2,609 | 6,242 | 3,038 |
| – Gross Shorts: | 5,583 | 3,350 | 2,956 |
| – Long to Short Ratio: | 0.5 to 1 | 1.9 to 1 | 1.0 to 1 |
| NET POSITION TREND: | |||
| – Strength Index Score (3 Year Range Pct): | 63.3 | 44.1 | 29.4 |
| – Strength Index Reading (3 Year Range): | Bullish | Bearish | Bearish |
| NET POSITION MOVEMENT INDEX: | |||
| – 6-Week Change in Strength Index: | -5.0 | 5.3 | -0.0 |
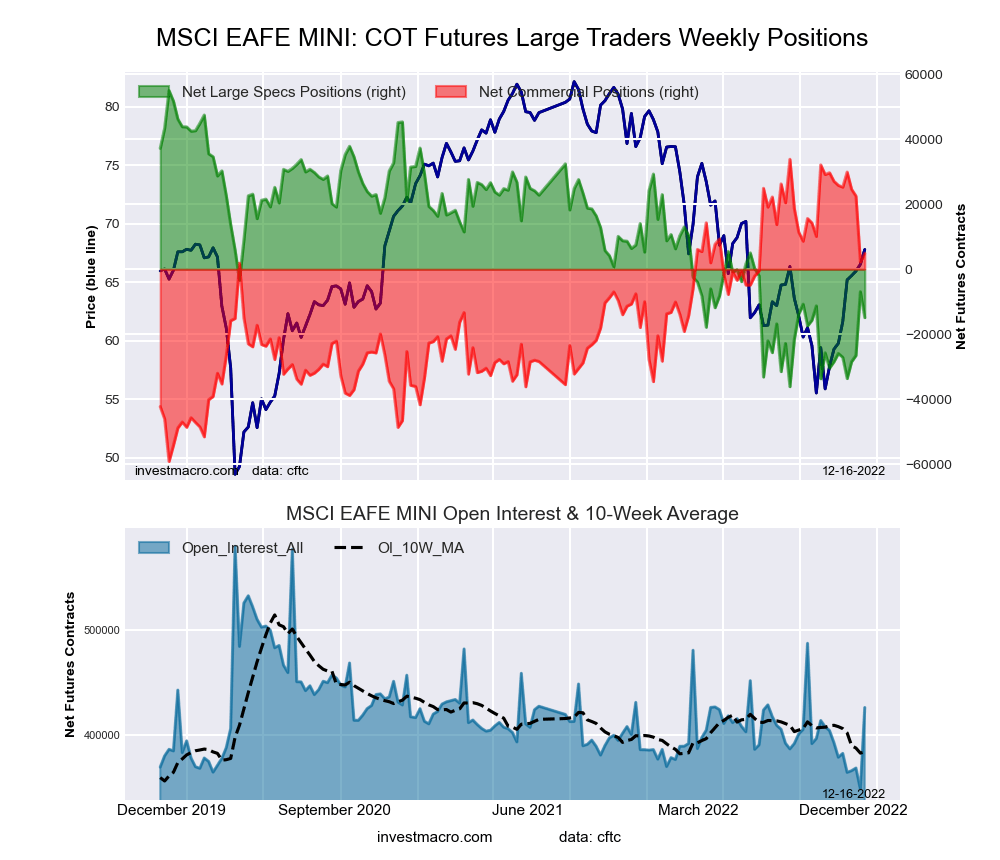
MSCI EAFE Mini Futures:
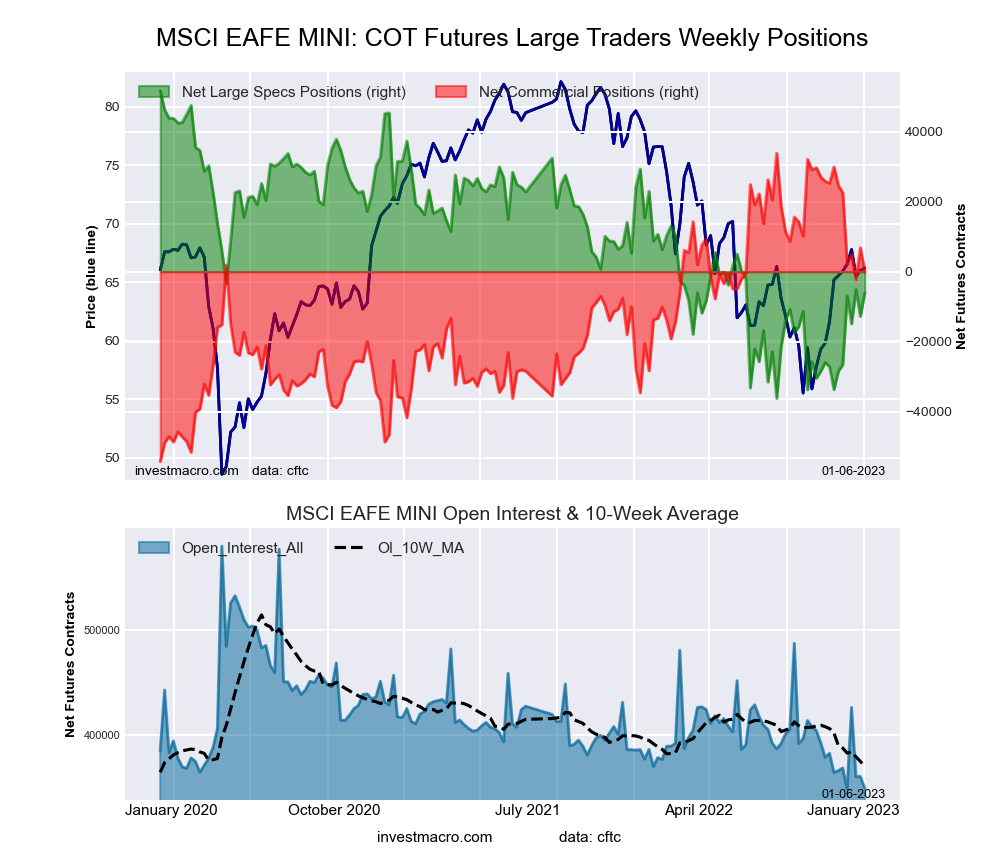 The MSCI EAFE Mini large speculator standing this week resulted in a net position of -5,996 contracts in the data reported through Tuesday. This was a weekly gain of 6,738 contracts from the previous week which had a total of -12,734 net contracts.
This week’s current strength score (the trader positioning range over the past three years, measured from 0 to 100) shows the speculators are currently Bearish with a score of 36.1 percent. The commercials are Bullish with a score of 60.4 percent and the small traders (not shown in chart) are Bullish with a score of 70.5 percent.
| MSCI EAFE Mini Futures Statistics | SPECULATORS | COMMERCIALS | SMALL TRADERS |
| – Percent of Open Interest Longs: | 4.8 | 91.7 | 3.1 |
| – Percent of Open Interest Shorts: | 6.5 | 91.7 | 1.3 |
| – Net Position: | -5,996 | -9 | 6,005 |
| – Gross Longs: | 16,843 | 320,467 | 10,720 |
| – Gross Shorts: | 22,839 | 320,476 | 4,715 |
| – Long to Short Ratio: | 0.7 to 1 | 1.0 to 1 | 2.3 to 1 |
| NET POSITION TREND: | |||
| – Strength Index Score (3 Year Range Pct): | 36.1 | 60.4 | 70.5 |
| – Strength Index Reading (3 Year Range): | Bearish | Bullish | Bullish |
| NET POSITION MOVEMENT INDEX: | |||
| – 6-Week Change in Strength Index: | 26.9 | -28.8 | 16.1 |
Article By InvestMacro – Receive our weekly COT Newsletter
*COT Report: The COT data, released weekly to the public each Friday, is updated through the most recent Tuesday (data is 3 days old) and shows a quick view of how large speculators or non-commercials (for-profit traders) were positioned in the futures markets.
The CFTC categorizes trader positions according to commercial hedgers (traders who use futures contracts for hedging as part of the business), non-commercials (large traders who speculate to realize trading profits) and nonreportable traders (usually small traders/speculators) as well as their open interest (contracts open in the market at time of reporting). See CFTC criteria here.


