
By InvestMacro
Here are the latest charts and statistics for the Commitment of Traders (COT) reports data published by the Commodities Futures Trading Commission (CFTC).
The latest COT data is updated through Tuesday December 13th and shows a quick view of how large traders (for-profit speculators and commercial entities) were positioned in the futures markets.
Weekly Speculator Changes led by Soybeans & Corn
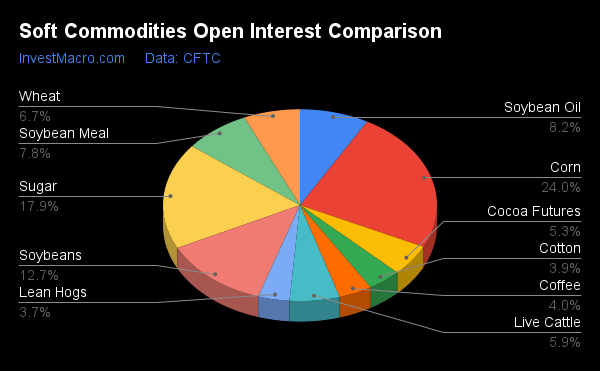
The COT soft commodities markets speculator bets were higher this week as seven out of the eleven softs markets we cover had higher positioning while the other four markets had lower speculator contracts.
Free Reports:
 Get our Weekly Commitment of Traders Reports - See where the biggest traders (Hedge Funds and Commercial Hedgers) are positioned in the futures markets on a weekly basis.
 Download Our Metatrader 4 Indicators – Put Our Free MetaTrader 4 Custom Indicators on your charts when you join our Weekly Newsletter
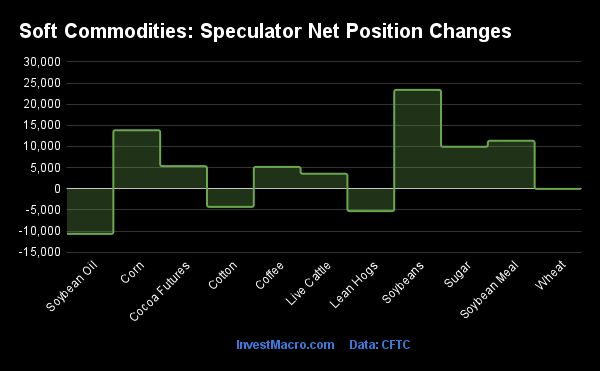
Leading the gains for the softs markets was Soybeans (23,398 contracts) with Corn (13,855 contracts), Soybean Meal (11,358 contracts), Sugar (9,927 contracts) with Cocoa (5,353 contracts), Coffee (5,172 contracts) and Live Cattle (3,552 contracts) also showing positive weeks.
The markets with the declines in speculator bets this week were Soybean Oil (-10,669 contracts) with Lean Hogs (-5,281 contracts), Cotton (-4,281 contracts) and Wheat (-21 contracts) also registering lower bets on the week.
Highlighting the COT soft commodities data this week is the continued gain in the Soybean Meal speculator positioning. The large speculator bets for Soybean Meal rose this week for a third consecutive week and for the seventh time out of the past ten weeks. Speculators bets have now pushed the overall net position standing for Soybean Meal (currently at +133,532 contracts) to the highest level in the past two-hundred and thirty-six weeks, dating back to June 5th of 2018.
Soybean Meal futures prices dipped this week despite the continued strong sentiment. The Soybean Meal futures price had previously gained for three straight weeks and hit the highest price level since March above the 470.0 threshold. The futures price closed out the week right around the 460.0 support/resistance area.
| Dec-13-2022 | OI | OI-Index | Spec-Net | Spec-Index | Com-Net | COM-Index | Smalls-Net | Smalls-Index |
|---|---|---|---|---|---|---|---|---|
| WTI Crude | 1,450,482 | 4 | 229,559 | 5 | -247,747 | 97 | 18,188 | 29 |
| Gold | 437,040 | 4 | 125,649 | 24 | -138,529 | 76 | 12,880 | 12 |
| Silver | 125,555 | 4 | 22,819 | 39 | -35,806 | 61 | 12,987 | 33 |
| Copper | 162,191 | 11 | 2,556 | 38 | -6,559 | 62 | 4,003 | 48 |
| Palladium | 7,494 | 8 | -883 | 20 | 854 | 77 | 29 | 43 |
| Platinum | 72,416 | 43 | 28,445 | 47 | -32,624 | 55 | 4,179 | 24 |
| Natural Gas | 996,823 | 9 | -153,681 | 32 | 129,960 | 72 | 23,721 | 36 |
| Brent | 148,097 | 10 | -28,567 | 62 | 25,351 | 36 | 3,216 | 53 |
| Heating Oil | 270,751 | 24 | 17,308 | 68 | -32,771 | 36 | 15,463 | 52 |
| Soybeans | 638,744 | 14 | 113,059 | 46 | -82,011 | 64 | -31,048 | 19 |
| Corn | 1,205,259 | 0 | 212,230 | 57 | -173,223 | 47 | -39,007 | 21 |
| Coffee | 198,702 | 11 | -9,470 | 8 | 8,451 | 93 | 1,019 | 14 |
| Sugar | 899,777 | 38 | 193,051 | 60 | -228,593 | 38 | 35,542 | 52 |
| Wheat | 335,354 | 21 | -39,918 | 0 | 42,894 | 100 | -2,976 | 95 |
Strength Scores led by Soybean Meal & Sugar

COT Strength Scores (a normalized measure of Speculator positions over a 3-Year range, from 0 to 100 where above 80 is Extreme-Bullish and below 20 is Extreme-Bearish) showed that Soybean Meal (100 percent) and Sugar (60 percent) lead the softs markets this week. Corn (57 percent), Live Cattle (53 percent) and Soybeans (46 percent) come in as the next highest in the weekly strength scores.
On the downside, Wheat (0 percent), Coffee (8 percent) and Cotton (18 percent) come in at the lowest strength levels currently and are in Extreme-Bearish territory (below 20 percent). The next lowest strength score this week was Lean Hogs (37 percent).
Strength Statistics:
Corn (57.1 percent) vs Corn previous week (55.4 percent)
Sugar (60.3 percent) vs Sugar previous week (56.9 percent)
Coffee (7.7 percent) vs Coffee previous week (1.8 percent)
Soybeans (45.9 percent) vs Soybeans previous week (38.5 percent)
Soybean Oil (41.2 percent) vs Soybean Oil previous week (48.5 percent)
Soybean Meal (100.0 percent) vs Soybean Meal previous week (93.8 percent)
Live Cattle (53.1 percent) vs Live Cattle previous week (48.7 percent)
Lean Hogs (37.2 percent) vs Lean Hogs previous week (43.6 percent)
Cotton (18.3 percent) vs Cotton previous week (21.5 percent)
Cocoa (39.9 percent) vs Cocoa previous week (34.6 percent)
Wheat (0.0 percent) vs Wheat previous week (0.0 percent)
Sugar & Cocoa top the 6-Week Strength Trends

COT Strength Score Trends (or move index, calculates the 6-week changes in strength scores) showed that Sugar (43 percent) and Cocoa (31 percent) lead the past six weeks trends for soft commodities. Soybeans (9 percent) and Soybean Meal (8 percent) are the next highest positive movers in the latest trends data.
Soybean Oil (-29 percent) leads the downside trend scores currently with Wheat (-24 percent), Corn (-16 percent) and Lean Hogs (-14 percent) following next with lower trend scores.
Strength Trend Statistics:
Corn (-16.4 percent) vs Corn previous week (-16.8 percent)
Sugar (42.6 percent) vs Sugar previous week (24.5 percent)
Coffee (-13.4 percent) vs Coffee previous week (-29.9 percent)
Soybeans (8.5 percent) vs Soybeans previous week (10.3 percent)
Soybean Oil (-28.5 percent) vs Soybean Oil previous week (-18.5 percent)
Soybean Meal (7.7 percent) vs Soybean Meal previous week (3.3 percent)
Live Cattle (-5.8 percent) vs Live Cattle previous week (-11.1 percent)
Lean Hogs (-14.4 percent) vs Lean Hogs previous week (-1.8 percent)
Cotton (-1.3 percent) vs Cotton previous week (-4.6 percent)
Cocoa (31.2 percent) vs Cocoa previous week (19.3 percent)
Wheat (-23.7 percent) vs Wheat previous week (-26.4 percent)
Individual Soft Commodities Markets:
CORN Futures:
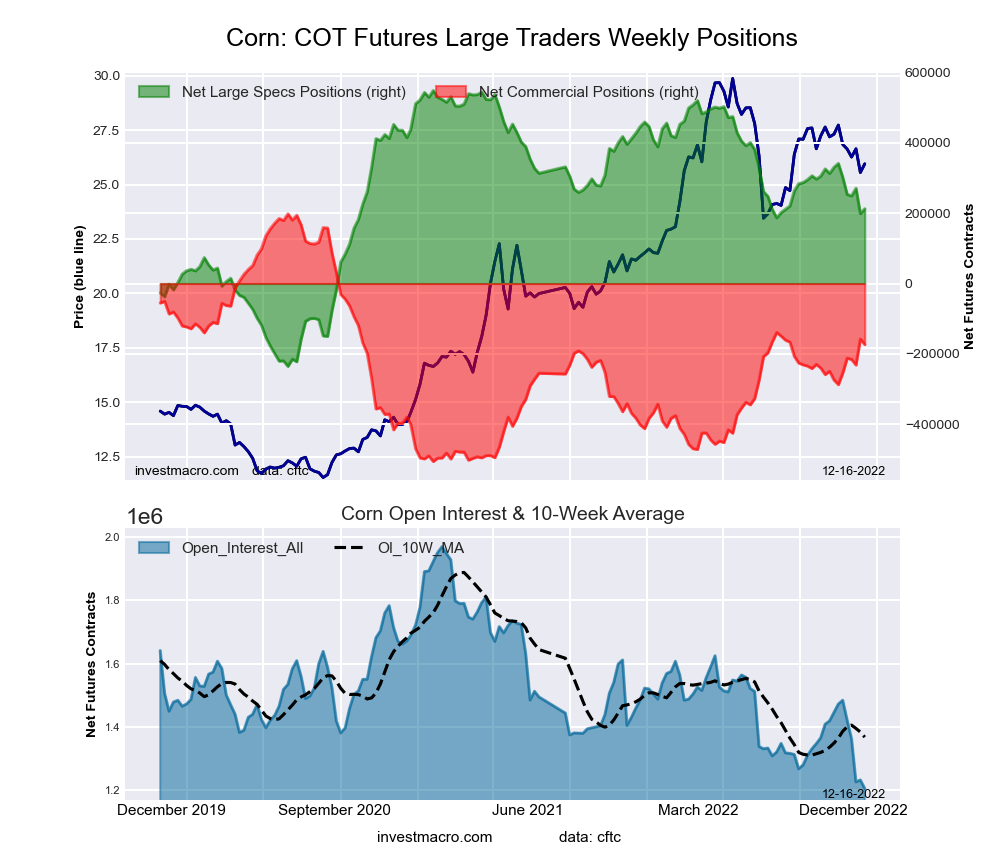 The CORN large speculator standing this week recorded a net position of 212,230 contracts in the data reported through Tuesday. This was a weekly boost of 13,855 contracts from the previous week which had a total of 198,375 net contracts.
This week’s current strength score (the trader positioning range over the past three years, measured from 0 to 100) shows the speculators are currently Bullish with a score of 57.1 percent. The commercials are Bearish with a score of 47.2 percent and the small traders (not shown in chart) are Bearish with a score of 21.3 percent.
| CORN Futures Statistics | SPECULATORS | COMMERCIALS | SMALL TRADERS |
| – Percent of Open Interest Longs: | 26.2 | 47.3 | 10.2 |
| – Percent of Open Interest Shorts: | 8.6 | 61.7 | 13.4 |
| – Net Position: | 212,230 | -173,223 | -39,007 |
| – Gross Longs: | 316,184 | 570,199 | 122,422 |
| – Gross Shorts: | 103,954 | 743,422 | 161,429 |
| – Long to Short Ratio: | 3.0 to 1 | 0.8 to 1 | 0.8 to 1 |
| NET POSITION TREND: | |||
| – Strength Index Score (3 Year Range Pct): | 57.1 | 47.2 | 21.3 |
| – Strength Index Reading (3 Year Range): | Bullish | Bearish | Bearish |
| NET POSITION MOVEMENT INDEX: | |||
| – 6-Week Change in Strength Index: | -16.4 | 16.2 | 8.9 |
SUGAR Futures:
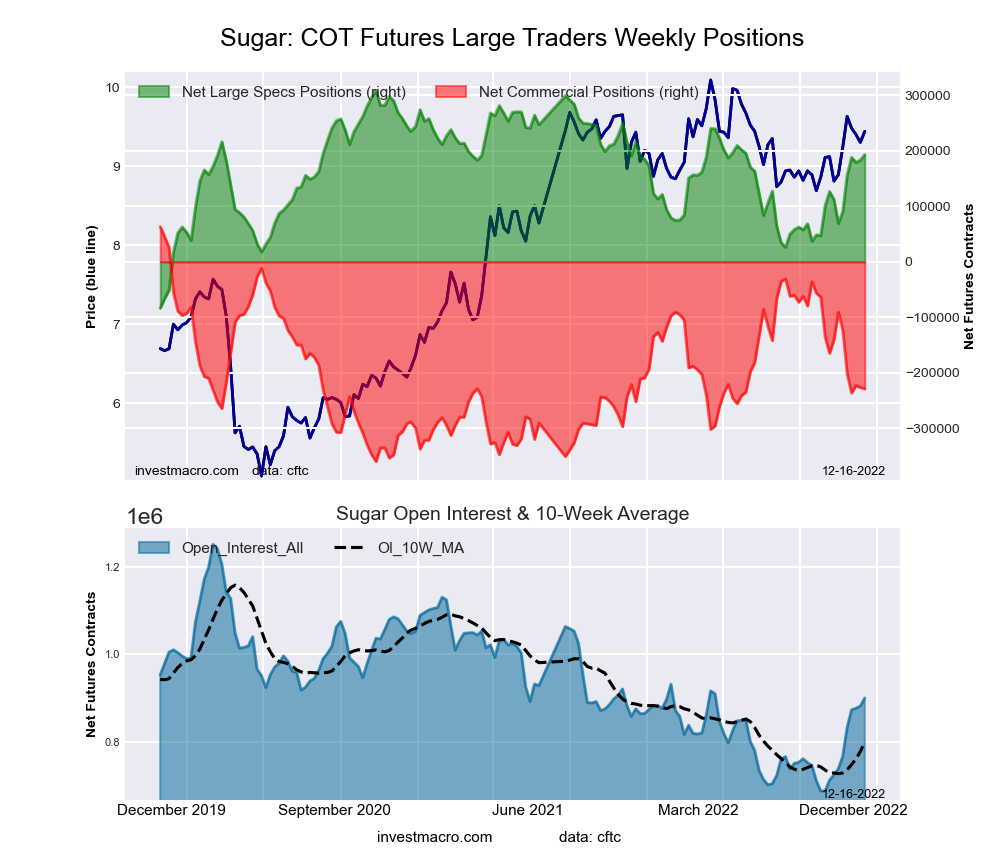 The SUGAR large speculator standing this week recorded a net position of 193,051 contracts in the data reported through Tuesday. This was a weekly lift of 9,927 contracts from the previous week which had a total of 183,124 net contracts.
This week’s current strength score (the trader positioning range over the past three years, measured from 0 to 100) shows the speculators are currently Bullish with a score of 60.3 percent. The commercials are Bearish with a score of 37.6 percent and the small traders (not shown in chart) are Bullish with a score of 51.8 percent.
| SUGAR Futures Statistics | SPECULATORS | COMMERCIALS | SMALL TRADERS |
| – Percent of Open Interest Longs: | 32.0 | 44.6 | 10.2 |
| – Percent of Open Interest Shorts: | 10.6 | 70.0 | 6.2 |
| – Net Position: | 193,051 | -228,593 | 35,542 |
| – Gross Longs: | 288,052 | 401,488 | 91,410 |
| – Gross Shorts: | 95,001 | 630,081 | 55,868 |
| – Long to Short Ratio: | 3.0 to 1 | 0.6 to 1 | 1.6 to 1 |
| NET POSITION TREND: | |||
| – Strength Index Score (3 Year Range Pct): | 60.3 | 37.6 | 51.8 |
| – Strength Index Reading (3 Year Range): | Bullish | Bearish | Bullish |
| NET POSITION MOVEMENT INDEX: | |||
| – 6-Week Change in Strength Index: | 42.6 | -39.7 | 17.4 |
COFFEE Futures:
 The COFFEE large speculator standing this week recorded a net position of -9,470 contracts in the data reported through Tuesday. This was a weekly advance of 5,172 contracts from the previous week which had a total of -14,642 net contracts.
This week’s current strength score (the trader positioning range over the past three years, measured from 0 to 100) shows the speculators are currently Bearish-Extreme with a score of 7.7 percent. The commercials are Bullish-Extreme with a score of 93.1 percent and the small traders (not shown in chart) are Bearish-Extreme with a score of 13.6 percent.
| COFFEE Futures Statistics | SPECULATORS | COMMERCIALS | SMALL TRADERS |
| – Percent of Open Interest Longs: | 22.5 | 53.0 | 4.5 |
| – Percent of Open Interest Shorts: | 27.2 | 48.7 | 4.0 |
| – Net Position: | -9,470 | 8,451 | 1,019 |
| – Gross Longs: | 44,628 | 105,240 | 8,917 |
| – Gross Shorts: | 54,098 | 96,789 | 7,898 |
| – Long to Short Ratio: | 0.8 to 1 | 1.1 to 1 | 1.1 to 1 |
| NET POSITION TREND: | |||
| – Strength Index Score (3 Year Range Pct): | 7.7 | 93.1 | 13.6 |
| – Strength Index Reading (3 Year Range): | Bearish-Extreme | Bullish-Extreme | Bearish-Extreme |
| NET POSITION MOVEMENT INDEX: | |||
| – 6-Week Change in Strength Index: | -13.4 | 13.9 | -13.4 |
SOYBEANS Futures:
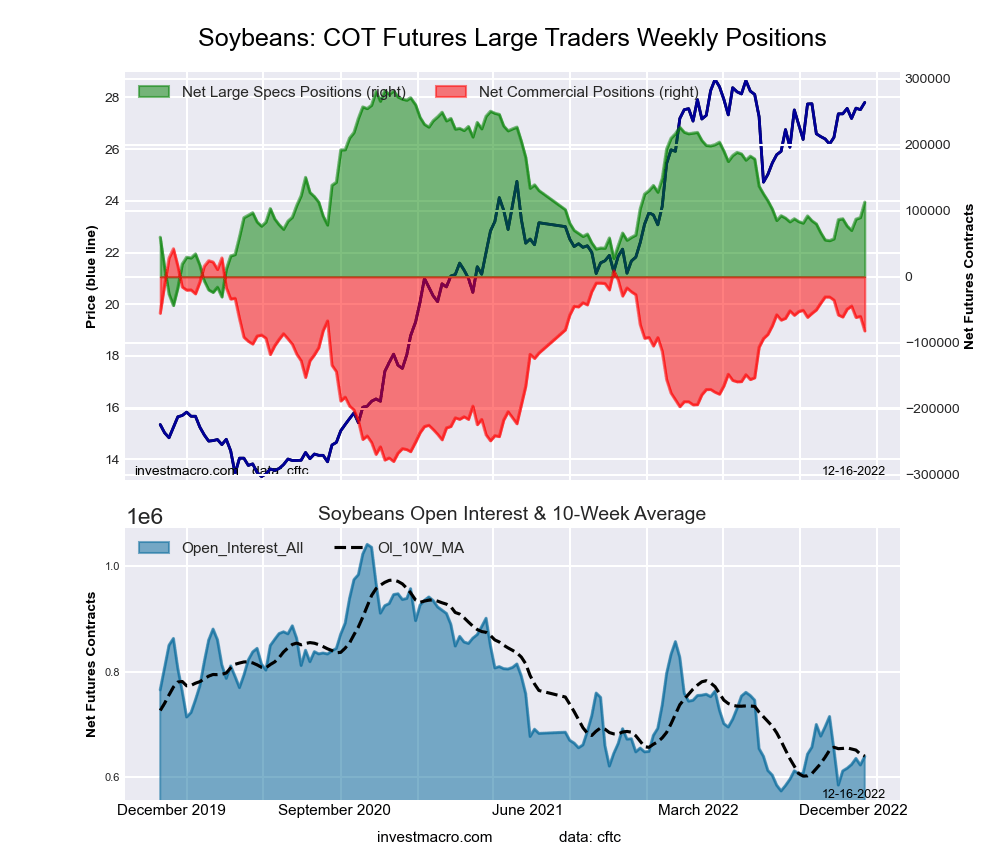 The SOYBEANS large speculator standing this week recorded a net position of 113,059 contracts in the data reported through Tuesday. This was a weekly rise of 23,398 contracts from the previous week which had a total of 89,661 net contracts.
This week’s current strength score (the trader positioning range over the past three years, measured from 0 to 100) shows the speculators are currently Bearish with a score of 45.9 percent. The commercials are Bullish with a score of 64.1 percent and the small traders (not shown in chart) are Bearish-Extreme with a score of 18.6 percent.
| SOYBEANS Futures Statistics | SPECULATORS | COMMERCIALS | SMALL TRADERS |
| – Percent of Open Interest Longs: | 27.0 | 50.7 | 7.5 |
| – Percent of Open Interest Shorts: | 9.3 | 63.6 | 12.4 |
| – Net Position: | 113,059 | -82,011 | -31,048 |
| – Gross Longs: | 172,330 | 324,126 | 48,054 |
| – Gross Shorts: | 59,271 | 406,137 | 79,102 |
| – Long to Short Ratio: | 2.9 to 1 | 0.8 to 1 | 0.6 to 1 |
| NET POSITION TREND: | |||
| – Strength Index Score (3 Year Range Pct): | 45.9 | 64.1 | 18.6 |
| – Strength Index Reading (3 Year Range): | Bearish | Bullish | Bearish-Extreme |
| NET POSITION MOVEMENT INDEX: | |||
| – 6-Week Change in Strength Index: | 8.5 | -7.8 | -4.1 |
SOYBEAN OIL Futures:
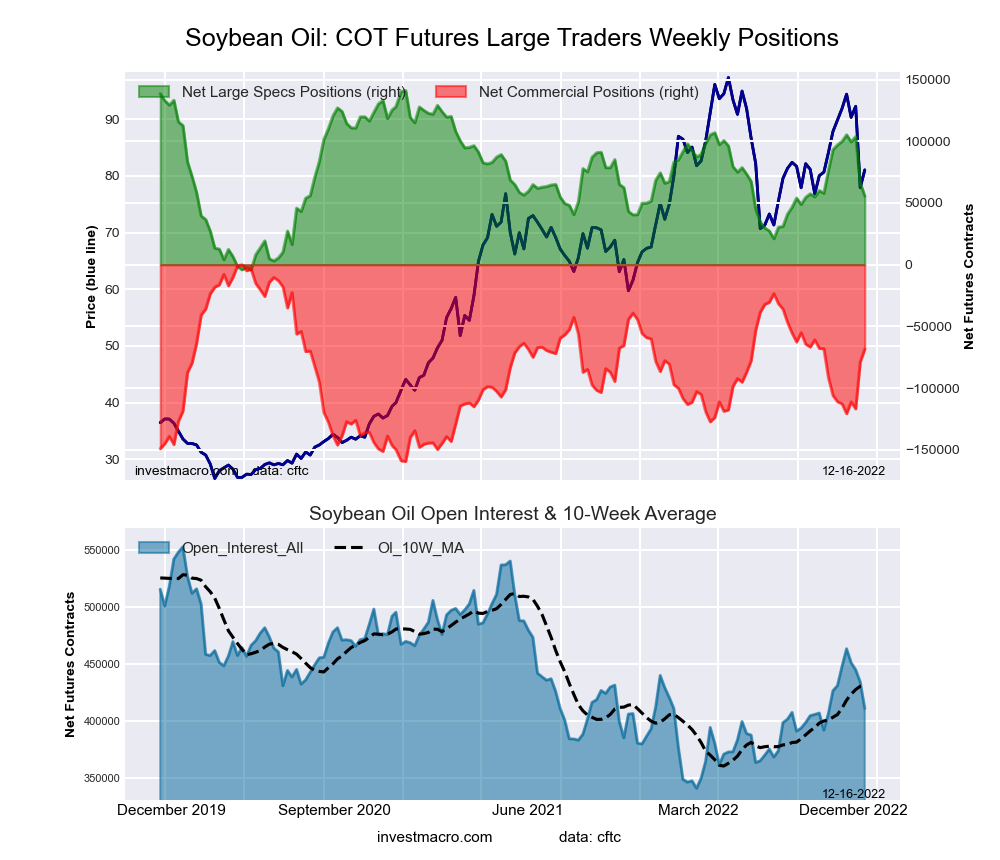 The SOYBEAN OIL large speculator standing this week recorded a net position of 55,642 contracts in the data reported through Tuesday. This was a weekly decrease of -10,669 contracts from the previous week which had a total of 66,311 net contracts.
This week’s current strength score (the trader positioning range over the past three years, measured from 0 to 100) shows the speculators are currently Bearish with a score of 41.2 percent. The commercials are Bullish with a score of 57.1 percent and the small traders (not shown in chart) are Bullish with a score of 61.5 percent.
| SOYBEAN OIL Futures Statistics | SPECULATORS | COMMERCIALS | SMALL TRADERS |
| – Percent of Open Interest Longs: | 23.2 | 49.5 | 8.6 |
| – Percent of Open Interest Shorts: | 9.7 | 66.2 | 5.5 |
| – Net Position: | 55,642 | -68,529 | 12,887 |
| – Gross Longs: | 95,349 | 203,433 | 35,470 |
| – Gross Shorts: | 39,707 | 271,962 | 22,583 |
| – Long to Short Ratio: | 2.4 to 1 | 0.7 to 1 | 1.6 to 1 |
| NET POSITION TREND: | |||
| – Strength Index Score (3 Year Range Pct): | 41.2 | 57.1 | 61.5 |
| – Strength Index Reading (3 Year Range): | Bearish | Bullish | Bullish |
| NET POSITION MOVEMENT INDEX: | |||
| – 6-Week Change in Strength Index: | -28.5 | 26.7 | -4.1 |
SOYBEAN MEAL Futures:
 The SOYBEAN MEAL large speculator standing this week recorded a net position of 133,532 contracts in the data reported through Tuesday. This was a weekly increase of 11,358 contracts from the previous week which had a total of 122,174 net contracts.
This week’s current strength score (the trader positioning range over the past three years, measured from 0 to 100) shows the speculators are currently Bullish-Extreme with a score of 100.0 percent. The commercials are Bearish-Extreme with a score of 3.8 percent and the small traders (not shown in chart) are Bearish with a score of 29.4 percent.
| SOYBEAN MEAL Futures Statistics | SPECULATORS | COMMERCIALS | SMALL TRADERS |
| – Percent of Open Interest Longs: | 37.8 | 36.2 | 12.2 |
| – Percent of Open Interest Shorts: | 3.8 | 75.0 | 7.5 |
| – Net Position: | 133,532 | -152,141 | 18,609 |
| – Gross Longs: | 148,357 | 142,149 | 47,862 |
| – Gross Shorts: | 14,825 | 294,290 | 29,253 |
| – Long to Short Ratio: | 10.0 to 1 | 0.5 to 1 | 1.6 to 1 |
| NET POSITION TREND: | |||
| – Strength Index Score (3 Year Range Pct): | 100.0 | 3.8 | 29.4 |
| – Strength Index Reading (3 Year Range): | Bullish-Extreme | Bearish-Extreme | Bearish |
| NET POSITION MOVEMENT INDEX: | |||
| – 6-Week Change in Strength Index: | 7.7 | -3.6 | -37.0 |
LIVE CATTLE Futures:
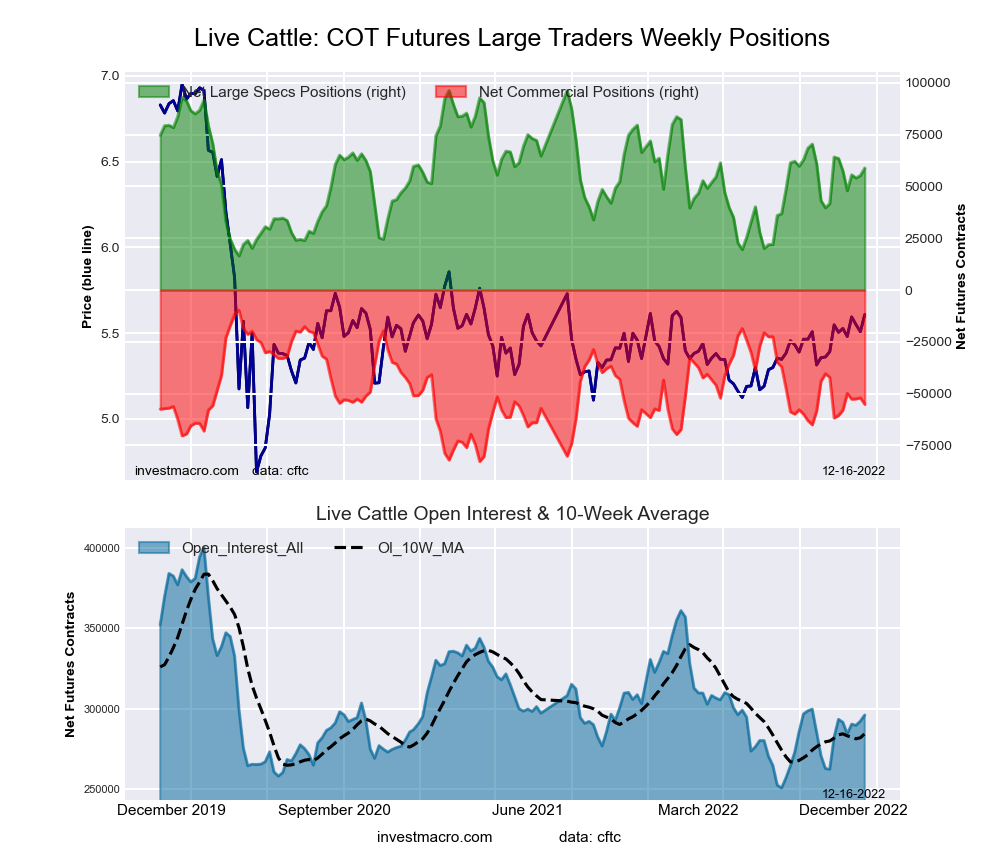 The LIVE CATTLE large speculator standing this week recorded a net position of 58,815 contracts in the data reported through Tuesday. This was a weekly advance of 3,552 contracts from the previous week which had a total of 55,263 net contracts.
This week’s current strength score (the trader positioning range over the past three years, measured from 0 to 100) shows the speculators are currently Bullish with a score of 53.1 percent. The commercials are Bearish with a score of 37.7 percent and the small traders (not shown in chart) are Bullish with a score of 78.1 percent.
| LIVE CATTLE Futures Statistics | SPECULATORS | COMMERCIALS | SMALL TRADERS |
| – Percent of Open Interest Longs: | 38.7 | 32.9 | 11.0 |
| – Percent of Open Interest Shorts: | 18.8 | 51.5 | 12.2 |
| – Net Position: | 58,815 | -55,162 | -3,653 |
| – Gross Longs: | 114,479 | 97,378 | 32,476 |
| – Gross Shorts: | 55,664 | 152,540 | 36,129 |
| – Long to Short Ratio: | 2.1 to 1 | 0.6 to 1 | 0.9 to 1 |
| NET POSITION TREND: | |||
| – Strength Index Score (3 Year Range Pct): | 53.1 | 37.7 | 78.1 |
| – Strength Index Reading (3 Year Range): | Bullish | Bearish | Bullish |
| NET POSITION MOVEMENT INDEX: | |||
| – 6-Week Change in Strength Index: | -5.8 | 7.4 | -2.8 |
LEAN HOGS Futures:
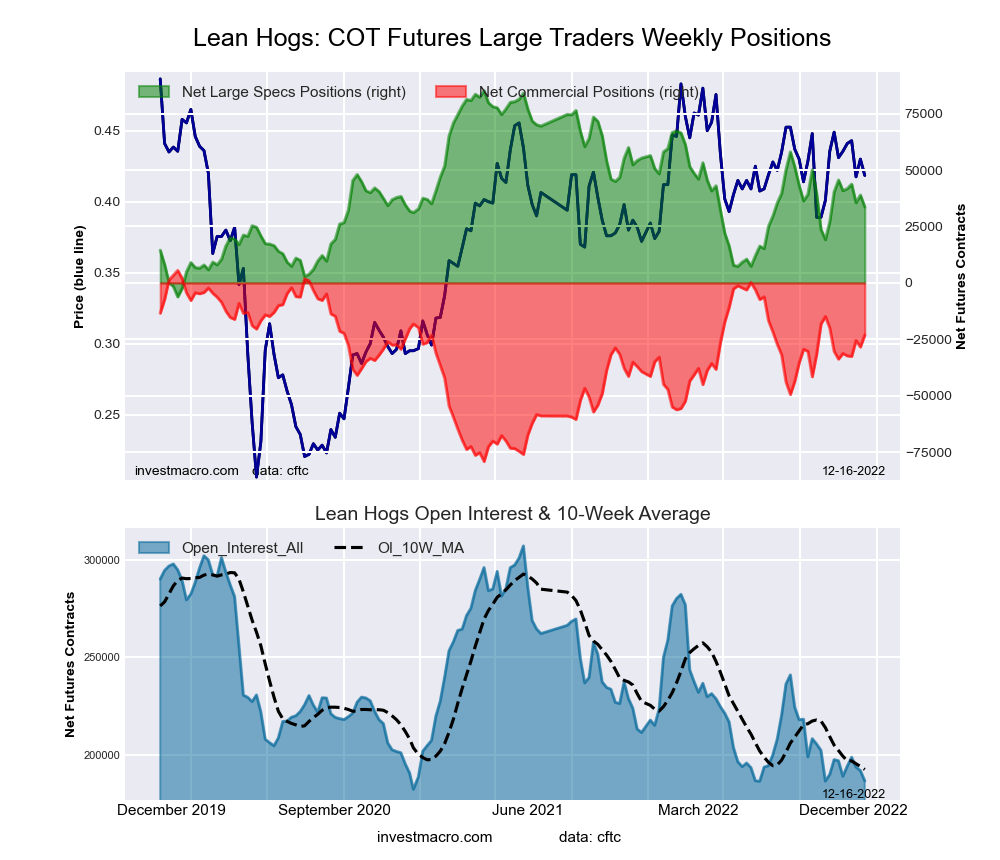 The LEAN HOGS large speculator standing this week recorded a net position of 33,627 contracts in the data reported through Tuesday. This was a weekly decline of -5,281 contracts from the previous week which had a total of 38,908 net contracts.
This week’s current strength score (the trader positioning range over the past three years, measured from 0 to 100) shows the speculators are currently Bearish with a score of 37.2 percent. The commercials are Bullish with a score of 69.2 percent and the small traders (not shown in chart) are Bearish with a score of 44.5 percent.
| LEAN HOGS Futures Statistics | SPECULATORS | COMMERCIALS | SMALL TRADERS |
| – Percent of Open Interest Longs: | 37.5 | 36.6 | 7.4 |
| – Percent of Open Interest Shorts: | 19.5 | 49.0 | 13.1 |
| – Net Position: | 33,627 | -23,073 | -10,554 |
| – Gross Longs: | 69,910 | 68,312 | 13,877 |
| – Gross Shorts: | 36,283 | 91,385 | 24,431 |
| – Long to Short Ratio: | 1.9 to 1 | 0.7 to 1 | 0.6 to 1 |
| NET POSITION TREND: | |||
| – Strength Index Score (3 Year Range Pct): | 37.2 | 69.2 | 44.5 |
| – Strength Index Reading (3 Year Range): | Bearish | Bullish | Bearish |
| NET POSITION MOVEMENT INDEX: | |||
| – 6-Week Change in Strength Index: | -14.4 | 13.2 | 6.9 |
COTTON Futures:
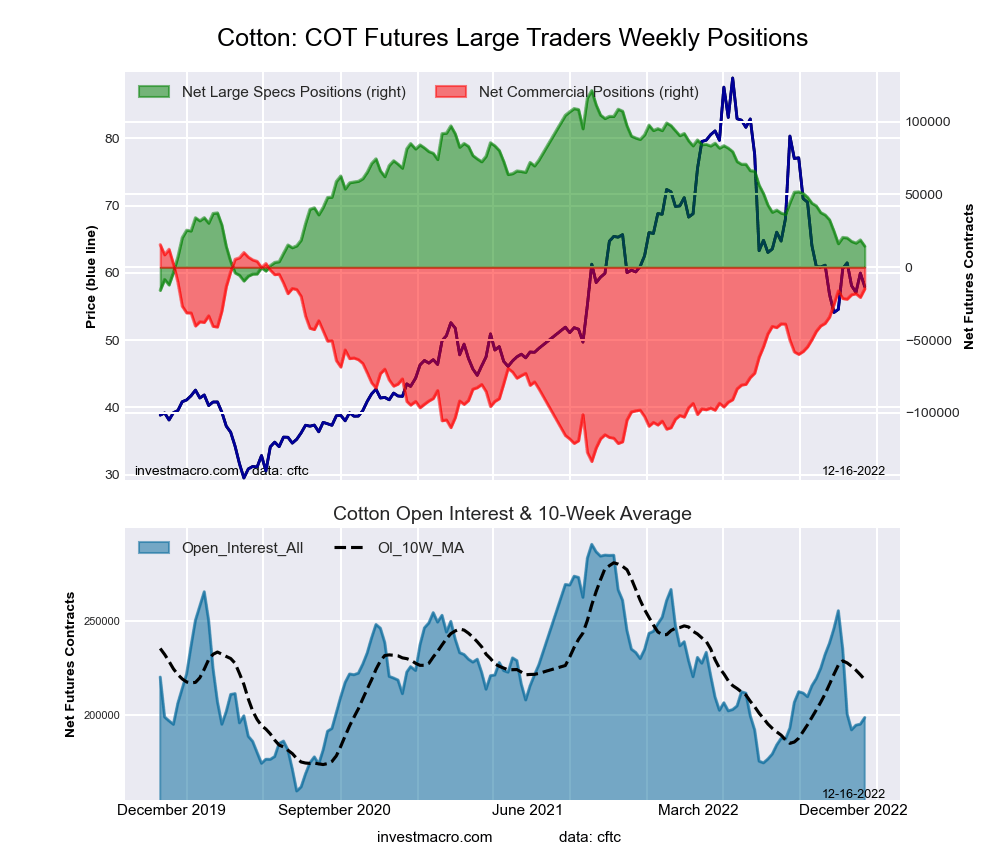 The COTTON large speculator standing this week recorded a net position of 14,439 contracts in the data reported through Tuesday. This was a weekly decrease of -4,281 contracts from the previous week which had a total of 18,720 net contracts.
This week’s current strength score (the trader positioning range over the past three years, measured from 0 to 100) shows the speculators are currently Bearish-Extreme with a score of 18.3 percent. The commercials are Bullish-Extreme with a score of 82.6 percent and the small traders (not shown in chart) are Bearish-Extreme with a score of 12.8 percent.
| COTTON Futures Statistics | SPECULATORS | COMMERCIALS | SMALL TRADERS |
| – Percent of Open Interest Longs: | 31.3 | 49.5 | 6.1 |
| – Percent of Open Interest Shorts: | 24.0 | 57.0 | 5.9 |
| – Net Position: | 14,439 | -14,822 | 383 |
| – Gross Longs: | 62,069 | 98,286 | 12,021 |
| – Gross Shorts: | 47,630 | 113,108 | 11,638 |
| – Long to Short Ratio: | 1.3 to 1 | 0.9 to 1 | 1.0 to 1 |
| NET POSITION TREND: | |||
| – Strength Index Score (3 Year Range Pct): | 18.3 | 82.6 | 12.8 |
| – Strength Index Reading (3 Year Range): | Bearish-Extreme | Bullish-Extreme | Bearish-Extreme |
| NET POSITION MOVEMENT INDEX: | |||
| – 6-Week Change in Strength Index: | -1.3 | 0.9 | 2.3 |
COCOA Futures:
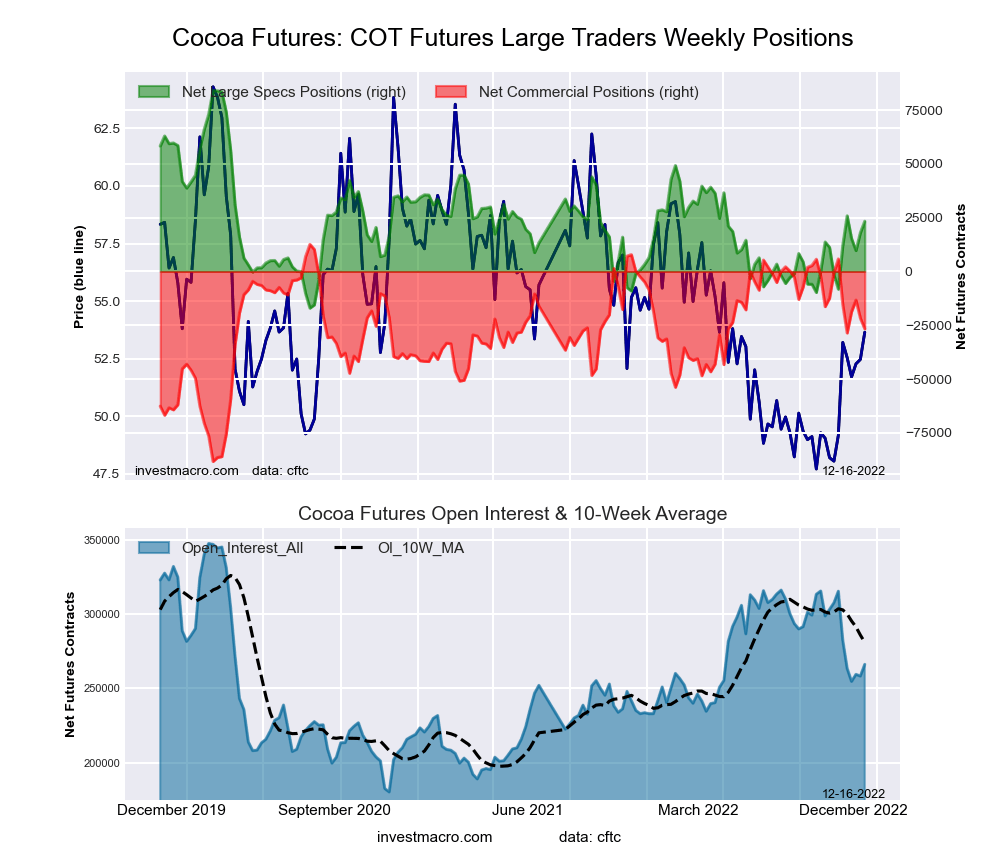 The COCOA large speculator standing this week recorded a net position of 23,317 contracts in the data reported through Tuesday. This was a weekly gain of 5,353 contracts from the previous week which had a total of 17,964 net contracts.
This week’s current strength score (the trader positioning range over the past three years, measured from 0 to 100) shows the speculators are currently Bearish with a score of 39.9 percent. The commercials are Bullish with a score of 61.1 percent and the small traders (not shown in chart) are Bearish with a score of 30.1 percent.
| COCOA Futures Statistics | SPECULATORS | COMMERCIALS | SMALL TRADERS |
| – Percent of Open Interest Longs: | 31.9 | 46.5 | 4.2 |
| – Percent of Open Interest Shorts: | 23.1 | 56.5 | 3.0 |
| – Net Position: | 23,317 | -26,669 | 3,352 |
| – Gross Longs: | 84,900 | 123,825 | 11,260 |
| – Gross Shorts: | 61,583 | 150,494 | 7,908 |
| – Long to Short Ratio: | 1.4 to 1 | 0.8 to 1 | 1.4 to 1 |
| NET POSITION TREND: | |||
| – Strength Index Score (3 Year Range Pct): | 39.9 | 61.1 | 30.1 |
| – Strength Index Reading (3 Year Range): | Bearish | Bullish | Bearish |
| NET POSITION MOVEMENT INDEX: | |||
| – 6-Week Change in Strength Index: | 31.2 | -32.2 | 9.2 |
WHEAT Futures:
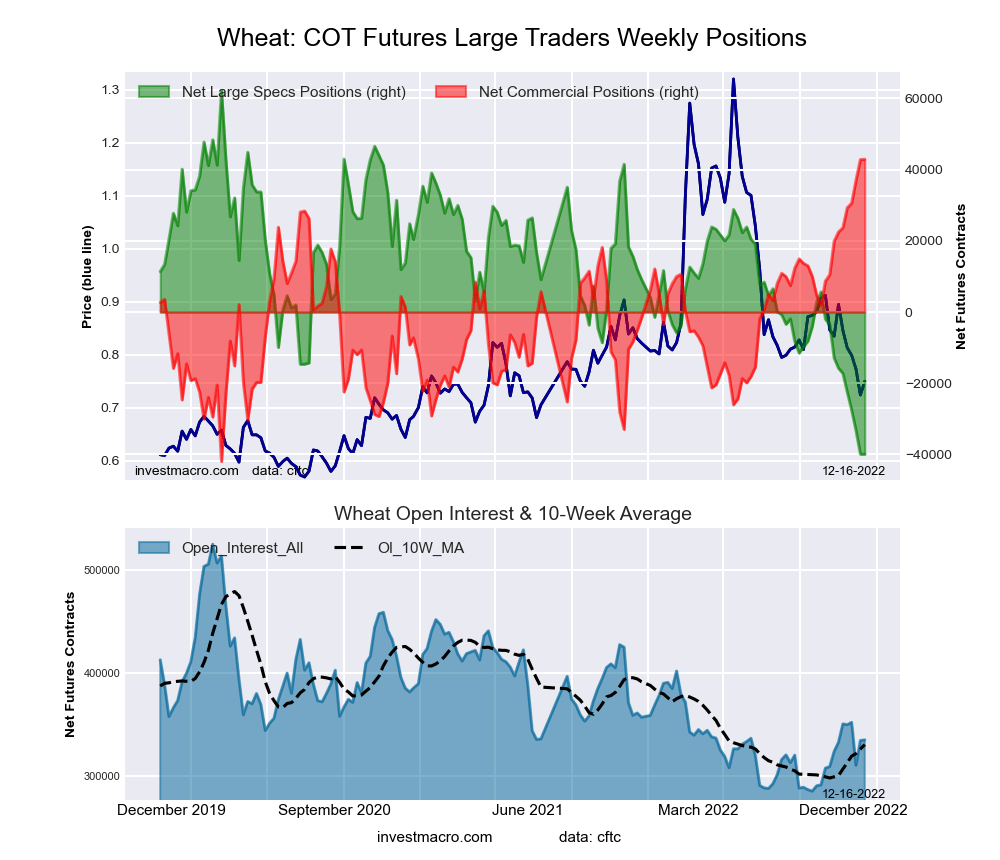 The WHEAT large speculator standing this week recorded a net position of -39,918 contracts in the data reported through Tuesday. This was a weekly fall of -21 contracts from the previous week which had a total of -39,897 net contracts.
This week’s current strength score (the trader positioning range over the past three years, measured from 0 to 100) shows the speculators are currently Bearish-Extreme with a score of 0.0 percent. The commercials are Bullish-Extreme with a score of 100.0 percent and the small traders (not shown in chart) are Bullish-Extreme with a score of 95.0 percent.
| WHEAT Futures Statistics | SPECULATORS | COMMERCIALS | SMALL TRADERS |
| – Percent of Open Interest Longs: | 28.1 | 40.9 | 9.7 |
| – Percent of Open Interest Shorts: | 40.0 | 28.2 | 10.6 |
| – Net Position: | -39,918 | 42,894 | -2,976 |
| – Gross Longs: | 94,335 | 137,316 | 32,455 |
| – Gross Shorts: | 134,253 | 94,422 | 35,431 |
| – Long to Short Ratio: | 0.7 to 1 | 1.5 to 1 | 0.9 to 1 |
| NET POSITION TREND: | |||
| – Strength Index Score (3 Year Range Pct): | 0.0 | 100.0 | 95.0 |
| – Strength Index Reading (3 Year Range): | Bearish-Extreme | Bullish-Extreme | Bullish-Extreme |
| NET POSITION MOVEMENT INDEX: | |||
| – 6-Week Change in Strength Index: | -23.7 | 24.0 | 19.5 |
Article By InvestMacro – Receive our weekly COT Newsletter
*COT Report: The COT data, released weekly to the public each Friday, is updated through the most recent Tuesday (data is 3 days old) and shows a quick view of how large speculators or non-commercials (for-profit traders) were positioned in the futures markets.
The CFTC categorizes trader positions according to commercial hedgers (traders who use futures contracts for hedging as part of the business), non-commercials (large traders who speculate to realize trading profits) and nonreportable traders (usually small traders/speculators) as well as their open interest (contracts open in the market at time of reporting). See CFTC criteria here.

- Geopolitical and macroeconomic conditions continue to pressure market sentiment Jul 20, 2026
- USD/JPY Poised to Continue Gains as Expensive Oil and Lack of Support Weigh on Yen Jul 20, 2026
- COT Metals Charts: Weekly Speculator Bets led by Copper & Steel Jul 18, 2026
- COT Bonds Charts: Weekly Speculator Bets led by 2-Year, SOFR 3M & 5-Year Bonds Jul 18, 2026
- COT Energy Charts: Weekly Speculator Bets led by Brent Oil & Heating Oil Jul 18, 2026
- COT Soft Commodities Charts: Weekly Speculator Bets led by Wheat, Corn & Soybean Meal Jul 18, 2026
- The Bank of Canada kept its interest rate unchanged. Platinum prices reached a three‑week high Jul 16, 2026
- Stock indices rose after the release of US inflation data. China’s GDP slowed sharply Jul 15, 2026
- GBP/USD Awaits Political News: What Will Happen Next Jul 15, 2026
- USD/JPY Holds at Highs: Pressure Lingers on Yen Jul 14, 2026