
By InvestMacro
Here are the latest charts and statistics for the Commitment of Traders (COT) reports data published by the Commodities Futures Trading Commission (CFTC).
The latest COT data is updated through Tuesday May 30th and shows a quick view of how large traders (for-profit speculators and commercial entities) were positioned in the futures markets.
Weekly Speculator Changes led by Soybeans & Corn
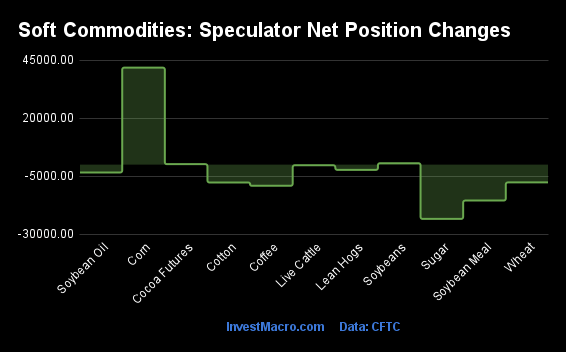
The COT soft commodities markets speculator bets were lower this week as three out of the eleven softs markets we cover had higher positioning while the other eight markets had lower speculator contracts.
Free Reports:
 Get our Weekly Commitment of Traders Reports - See where the biggest traders (Hedge Funds and Commercial Hedgers) are positioned in the futures markets on a weekly basis.
 Sign Up for Our Stock Market Newsletter – Get updated on News, Charts & Rankings of Public Companies when you join our Stocks Newsletter
Leading the gains for the softs markets was Corn (41,860 contracts) with Soybeans (609 contracts) and Cocoa (199 contracts) also showing positive weeks.
The markets with the declines in speculator bets this week were Sugar (-23,423 contracts) with Soybean Meal (-15,489 contracts), Coffee (-9,128 contracts), Cotton (-7,707 contracts), Wheat (-7,677 contracts), Lean Hogs (-2,262 contracts), Soybean Oil (-3,385 contracts) and Live Cattle (-269 contracts) also registering lower bets on the week.
Wheat Speculators continue to raise bearish bets to 279-week high
Highlighting the COT soft commodities data this week is the rising bearish level of the Wheat’s speculator’s positioning.
Wheat speculator bets continued to fall again this week for a second straight week and for the eleventh time out of the past fifteen weeks. Speculator positions have now added approximately -60,000 contracts to the bearish level over the past fifteen weeks.
The Wheat speculator standing, currently at -93,996 contracts, has fallen to the most bearish level of the past 279 weeks, dating back to January 23rd of 2018.
Wheat prices have also been on the downtrend since hitting all-time record high levels in March of 2022 and have now fallen over 50 percent from those highest levels of 2022. Wheat futures closed this week at $619.00 with the low of this week touching the lowest price since December of 2020 near 573.20
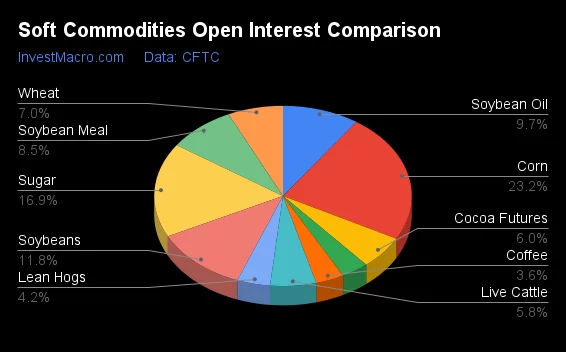
| May-30-2023 | OI | OI-Index | Spec-Net | Spec-Index | Com-Net | COM-Index | Smalls-Net | Smalls-Index |
|---|---|---|---|---|---|---|---|---|
| WTI Crude | 1,920,740 | 47 | 162,591 | 2 | -192,877 | 97 | 30,286 | 40 |
| Gold | 449,515 | 13 | 169,316 | 52 | -190,005 | 51 | 20,689 | 32 |
| Silver | 133,619 | 18 | 21,124 | 48 | -34,536 | 52 | 13,412 | 41 |
| Copper | 223,185 | 61 | -35,702 | 0 | 34,259 | 100 | 1,443 | 28 |
| Palladium | 10,658 | 64 | -6,050 | 10 | 6,472 | 91 | -422 | 16 |
| Platinum | 69,929 | 72 | 23,406 | 70 | -27,973 | 36 | 4,567 | 29 |
| Natural Gas | 1,359,496 | 79 | -106,170 | 30 | 74,969 | 69 | 31,201 | 54 |
| Brent | 148,868 | 21 | -53,294 | 0 | 48,912 | 100 | 4,382 | 68 |
| Heating Oil | 309,819 | 40 | 18,341 | 61 | -22,943 | 70 | 4,602 | 14 |
| Soybeans | 672,482 | 21 | 29,814 | 1 | -4,162 | 95 | -25,652 | 32 |
| Corn | 1,319,205 | 17 | -20,407 | 27 | 72,210 | 82 | -51,803 | 25 |
| Coffee | 202,708 | 14 | 23,620 | 52 | -23,623 | 52 | 3 | 13 |
| Sugar | 962,437 | 62 | 250,387 | 79 | -293,732 | 20 | 43,345 | 59 |
| Wheat | 395,158 | 63 | -93,996 | 0 | 88,847 | 100 | 5,149 | 91 |
Strength Scores led by Cocoa & Live Cattle
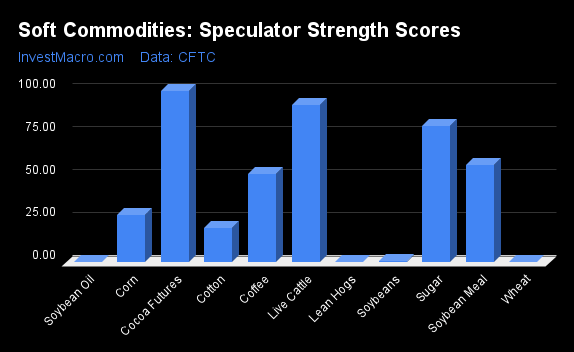
COT Strength Scores (a normalized measure of Speculator positions over a 3-Year range, from 0 to 100 where above 80 is Extreme-Bullish and below 20 is Extreme-Bearish) showed that Cocoa (100 percent) and Live Cattle (92 percent) lead the softs markets this week. Sugar (79 percent), Soybean Meal (57 percent) and Coffee (52 percent) come in as the next highest in the weekly strength scores.
On the downside, Lean Hogs (0 percent) and Soybean Oil (0 percent) come in at the lowest strength levels currently and are in Extreme-Bearish territory (below 20 percent). The next lowest strength scores are the Wheat (0 percent) and the Soybeans (1 percent).
Strength Statistics:
Corn (27.4 percent) vs Corn previous week (22.1 percent)
Sugar (79.4 percent) vs Sugar previous week (87.7 percent)
Coffee (51.6 percent) vs Coffee previous week (61.0 percent)
Soybeans (0.9 percent) vs Soybeans previous week (0.6 percent)
Soybean Oil (0.0 percent) vs Soybean Oil previous week (2.0 percent)
Soybean Meal (57.0 percent) vs Soybean Meal previous week (65.1 percent)
Live Cattle (91.8 percent) vs Live Cattle previous week (92.1 percent)
Lean Hogs (0.0 percent) vs Lean Hogs previous week (1.9 percent)
Cotton (19.7 percent) vs Cotton previous week (25.5 percent)
Cocoa (100.0 percent) vs Cocoa previous week (99.8 percent)
Wheat (0.0 percent) vs Wheat previous week (5.5 percent)
Cocoa & Cotton top the 6-Week Strength Trends
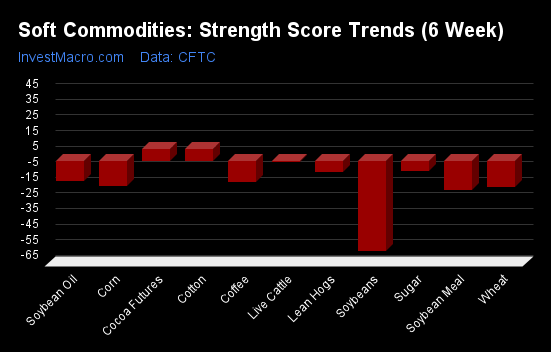
COT Strength Score Trends (or move index, calculates the 6-week changes in strength scores) showed that Cocoa (8 percent) and Cotton (8 percent) lead the past six weeks trends for soft commodities.
Soybeans (-58 percent) leads the downside trend scores currently with Soybean Meal (-19 percent), Wheat (-17 percent) and Corn (-16 percent) following next with lower trend scores.
Strength Trend Statistics:
Corn (-16.1 percent) vs Corn previous week (-21.2 percent)
Sugar (-6.7 percent) vs Sugar previous week (5.0 percent)
Coffee (-13.7 percent) vs Coffee previous week (8.1 percent)
Soybeans (-58.0 percent) vs Soybeans previous week (-59.0 percent)
Soybean Oil (-12.6 percent) vs Soybean Oil previous week (-12.5 percent)
Soybean Meal (-18.6 percent) vs Soybean Meal previous week (-3.1 percent)
Live Cattle (-0.8 percent) vs Live Cattle previous week (7.9 percent)
Lean Hogs (-7.4 percent) vs Lean Hogs previous week (-8.0 percent)
Cotton (7.6 percent) vs Cotton previous week (19.3 percent)
Cocoa (7.5 percent) vs Cocoa previous week (6.6 percent)
Wheat (-16.7 percent) vs Wheat previous week (-13.9 percent)
Individual Soft Commodities Markets:
CORN Futures:
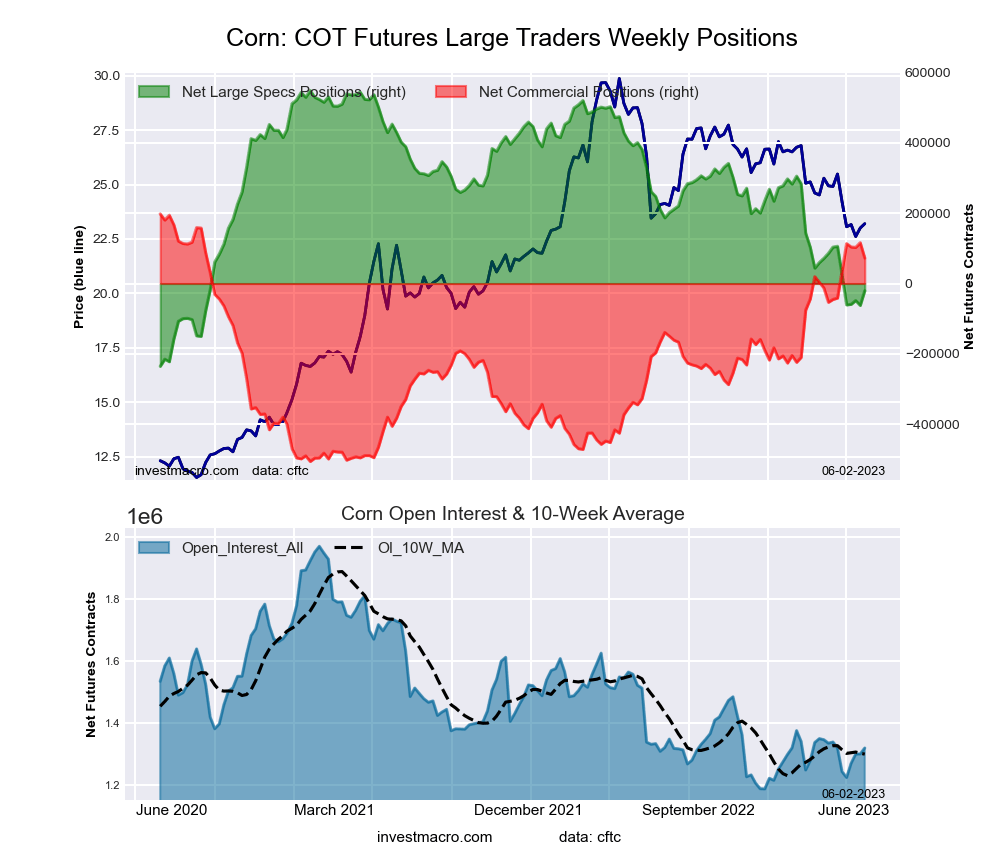 The CORN large speculator standing this week recorded a net position of -20,407 contracts in the data reported through Tuesday. This was a weekly boost of 41,860 contracts from the previous week which had a total of -62,267 net contracts.
This week’s current strength score (the trader positioning range over the past three years, measured from 0 to 100) shows the speculators are currently Bearish with a score of 27.4 percent. The commercials are Bullish-Extreme with a score of 82.2 percent and the small traders (not shown in chart) are Bearish with a score of 24.7 percent.
| CORN Futures Statistics | SPECULATORS | COMMERCIALS | SMALL TRADERS |
| – Percent of Open Interest Longs: | 20.8 | 51.9 | 8.7 |
| – Percent of Open Interest Shorts: | 22.4 | 46.5 | 12.7 |
| – Net Position: | -20,407 | 72,210 | -51,803 |
| – Gross Longs: | 274,956 | 685,222 | 115,112 |
| – Gross Shorts: | 295,363 | 613,012 | 166,915 |
| – Long to Short Ratio: | 0.9 to 1 | 1.1 to 1 | 0.7 to 1 |
| NET POSITION TREND: | |||
| – Strength Index Score (3 Year Range Pct): | 27.4 | 82.2 | 24.7 |
| – Strength Index Reading (3 Year Range): | Bearish | Bullish-Extreme | Bearish |
| NET POSITION MOVEMENT INDEX: | |||
| – 6-Week Change in Strength Index: | -16.1 | 16.1 | 10.6 |
SUGAR Futures:
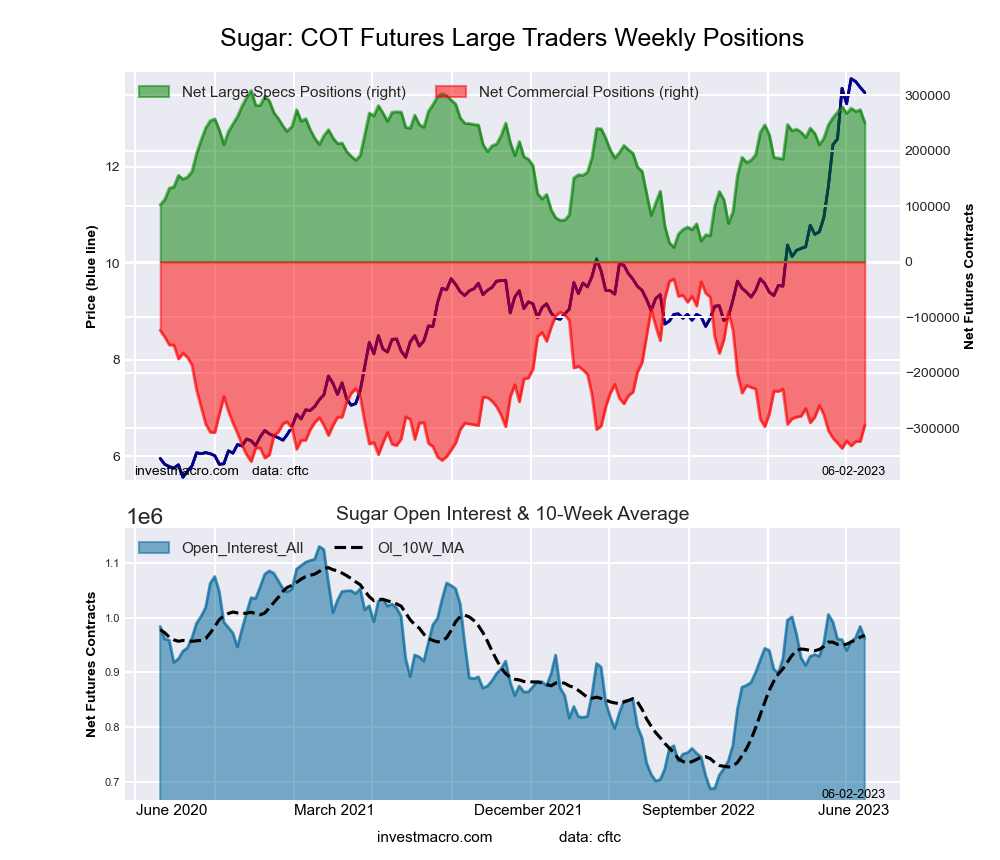 The SUGAR large speculator standing this week recorded a net position of 250,387 contracts in the data reported through Tuesday. This was a weekly lowering of -23,423 contracts from the previous week which had a total of 273,810 net contracts.
This week’s current strength score (the trader positioning range over the past three years, measured from 0 to 100) shows the speculators are currently Bullish with a score of 79.4 percent. The commercials are Bearish with a score of 20.0 percent and the small traders (not shown in chart) are Bullish with a score of 59.0 percent.
| SUGAR Futures Statistics | SPECULATORS | COMMERCIALS | SMALL TRADERS |
| – Percent of Open Interest Longs: | 34.5 | 40.2 | 9.3 |
| – Percent of Open Interest Shorts: | 8.5 | 70.7 | 4.8 |
| – Net Position: | 250,387 | -293,732 | 43,345 |
| – Gross Longs: | 332,464 | 386,730 | 89,595 |
| – Gross Shorts: | 82,077 | 680,462 | 46,250 |
| – Long to Short Ratio: | 4.1 to 1 | 0.6 to 1 | 1.9 to 1 |
| NET POSITION TREND: | |||
| – Strength Index Score (3 Year Range Pct): | 79.4 | 20.0 | 59.0 |
| – Strength Index Reading (3 Year Range): | Bullish | Bearish | Bullish |
| NET POSITION MOVEMENT INDEX: | |||
| – 6-Week Change in Strength Index: | -6.7 | 9.9 | -18.0 |
COFFEE Futures:
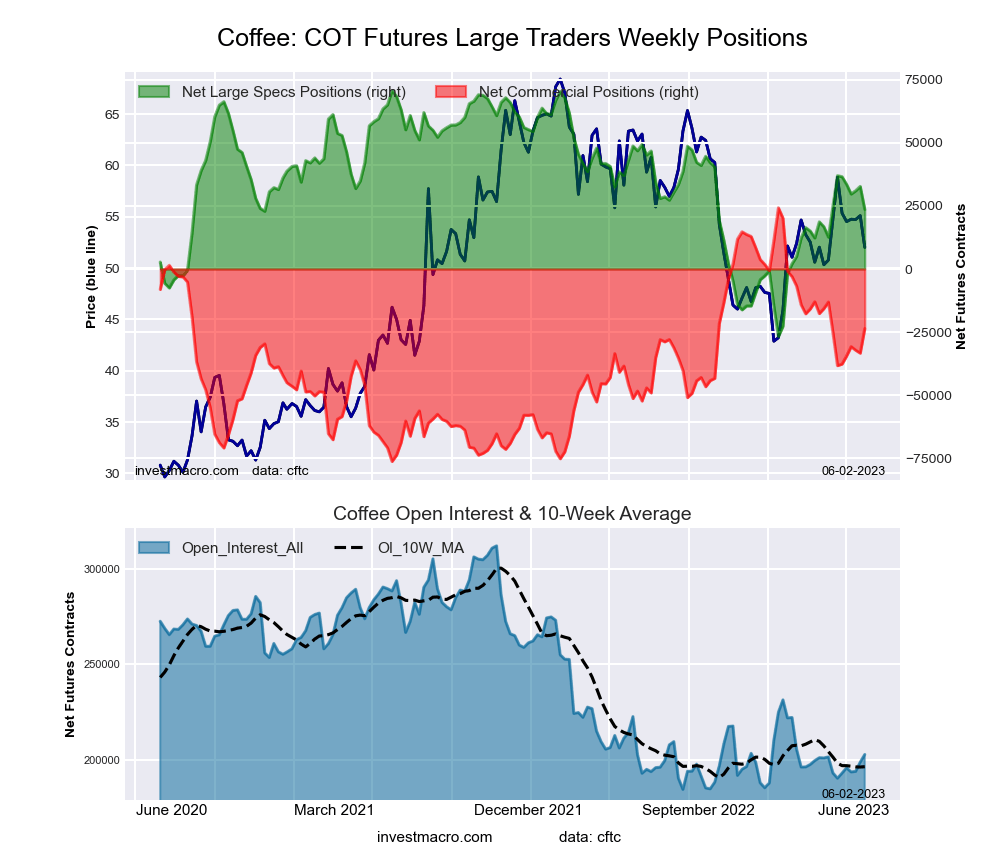 The COFFEE large speculator standing this week recorded a net position of 23,620 contracts in the data reported through Tuesday. This was a weekly fall of -9,128 contracts from the previous week which had a total of 32,748 net contracts.
This week’s current strength score (the trader positioning range over the past three years, measured from 0 to 100) shows the speculators are currently Bullish with a score of 51.6 percent. The commercials are Bullish with a score of 52.4 percent and the small traders (not shown in chart) are Bearish-Extreme with a score of 12.7 percent.
| COFFEE Futures Statistics | SPECULATORS | COMMERCIALS | SMALL TRADERS |
| – Percent of Open Interest Longs: | 23.4 | 46.9 | 3.4 |
| – Percent of Open Interest Shorts: | 11.7 | 58.5 | 3.4 |
| – Net Position: | 23,620 | -23,623 | 3 |
| – Gross Longs: | 47,353 | 95,031 | 6,827 |
| – Gross Shorts: | 23,733 | 118,654 | 6,824 |
| – Long to Short Ratio: | 2.0 to 1 | 0.8 to 1 | 1.0 to 1 |
| NET POSITION TREND: | |||
| – Strength Index Score (3 Year Range Pct): | 51.6 | 52.4 | 12.7 |
| – Strength Index Reading (3 Year Range): | Bullish | Bullish | Bearish-Extreme |
| NET POSITION MOVEMENT INDEX: | |||
| – 6-Week Change in Strength Index: | -13.7 | 14.6 | -15.8 |
SOYBEANS Futures:
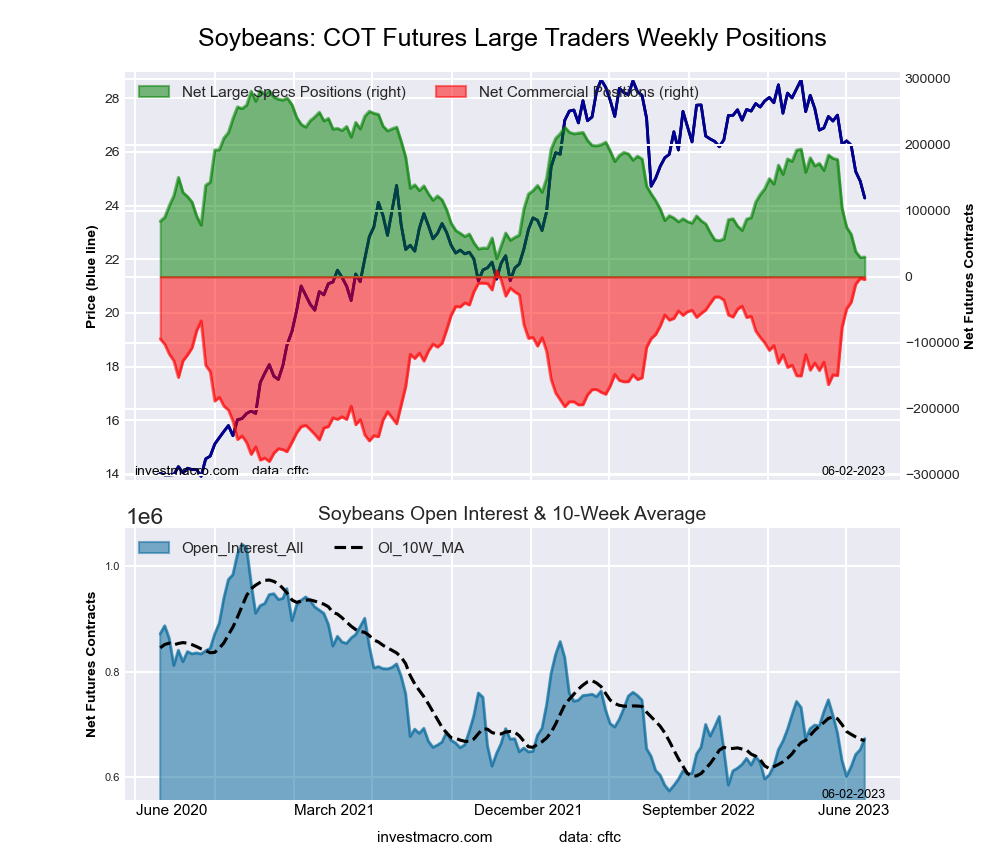 The SOYBEANS large speculator standing this week recorded a net position of 29,814 contracts in the data reported through Tuesday. This was a weekly boost of 609 contracts from the previous week which had a total of 29,205 net contracts.
This week’s current strength score (the trader positioning range over the past three years, measured from 0 to 100) shows the speculators are currently Bearish-Extreme with a score of 0.9 percent. The commercials are Bullish-Extreme with a score of 95.4 percent and the small traders (not shown in chart) are Bearish with a score of 31.7 percent.
| SOYBEANS Futures Statistics | SPECULATORS | COMMERCIALS | SMALL TRADERS |
| – Percent of Open Interest Longs: | 19.7 | 53.7 | 6.6 |
| – Percent of Open Interest Shorts: | 15.2 | 54.3 | 10.4 |
| – Net Position: | 29,814 | -4,162 | -25,652 |
| – Gross Longs: | 132,301 | 360,791 | 44,298 |
| – Gross Shorts: | 102,487 | 364,953 | 69,950 |
| – Long to Short Ratio: | 1.3 to 1 | 1.0 to 1 | 0.6 to 1 |
| NET POSITION TREND: | |||
| – Strength Index Score (3 Year Range Pct): | 0.9 | 95.4 | 31.7 |
| – Strength Index Reading (3 Year Range): | Bearish-Extreme | Bullish-Extreme | Bearish |
| NET POSITION MOVEMENT INDEX: | |||
| – 6-Week Change in Strength Index: | -58.0 | 50.3 | 4.3 |
SOYBEAN OIL Futures:
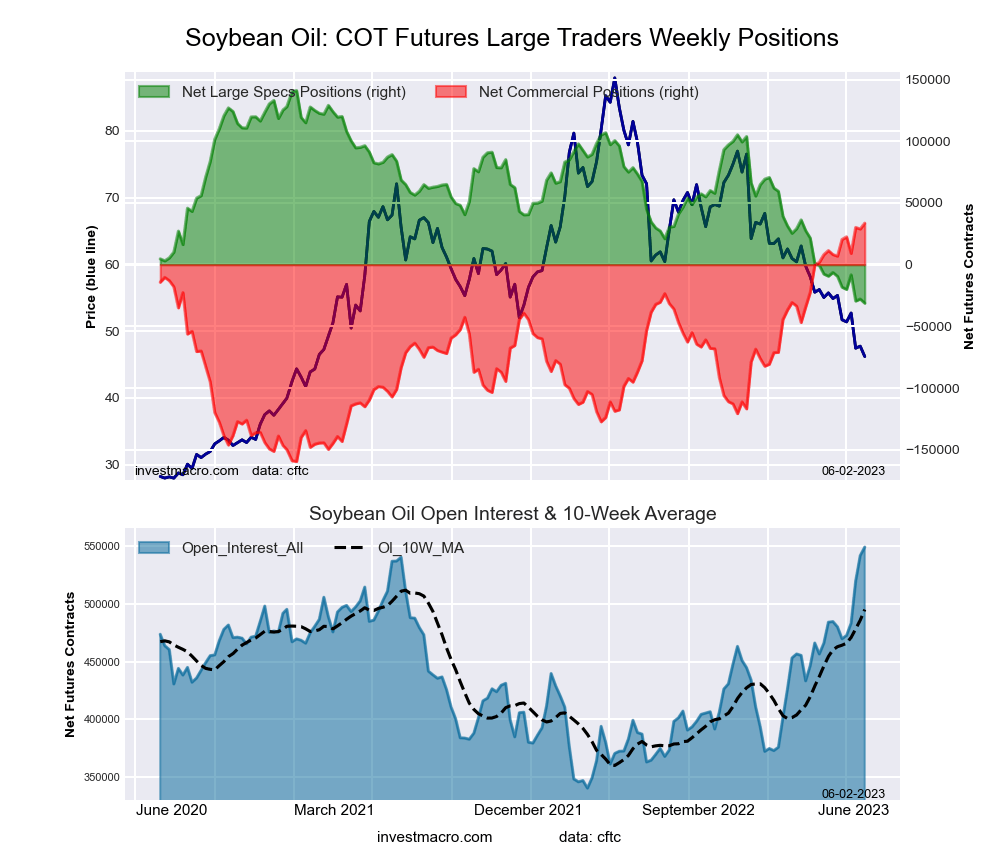 The SOYBEAN OIL large speculator standing this week recorded a net position of -31,248 contracts in the data reported through Tuesday. This was a weekly decrease of -3,385 contracts from the previous week which had a total of -27,863 net contracts.
This week’s current strength score (the trader positioning range over the past three years, measured from 0 to 100) shows the speculators are currently Bearish-Extreme with a score of 0.0 percent. The commercials are Bullish-Extreme with a score of 100.0 percent and the small traders (not shown in chart) are Bearish-Extreme with a score of 0.4 percent.
| SOYBEAN OIL Futures Statistics | SPECULATORS | COMMERCIALS | SMALL TRADERS |
| – Percent of Open Interest Longs: | 14.7 | 56.8 | 5.7 |
| – Percent of Open Interest Shorts: | 20.4 | 50.7 | 6.1 |
| – Net Position: | -31,248 | 33,635 | -2,387 |
| – Gross Longs: | 80,635 | 311,897 | 31,021 |
| – Gross Shorts: | 111,883 | 278,262 | 33,408 |
| – Long to Short Ratio: | 0.7 to 1 | 1.1 to 1 | 0.9 to 1 |
| NET POSITION TREND: | |||
| – Strength Index Score (3 Year Range Pct): | 0.0 | 100.0 | 0.4 |
| – Strength Index Reading (3 Year Range): | Bearish-Extreme | Bullish-Extreme | Bearish-Extreme |
| NET POSITION MOVEMENT INDEX: | |||
| – 6-Week Change in Strength Index: | -12.6 | 13.8 | -19.1 |
SOYBEAN MEAL Futures:
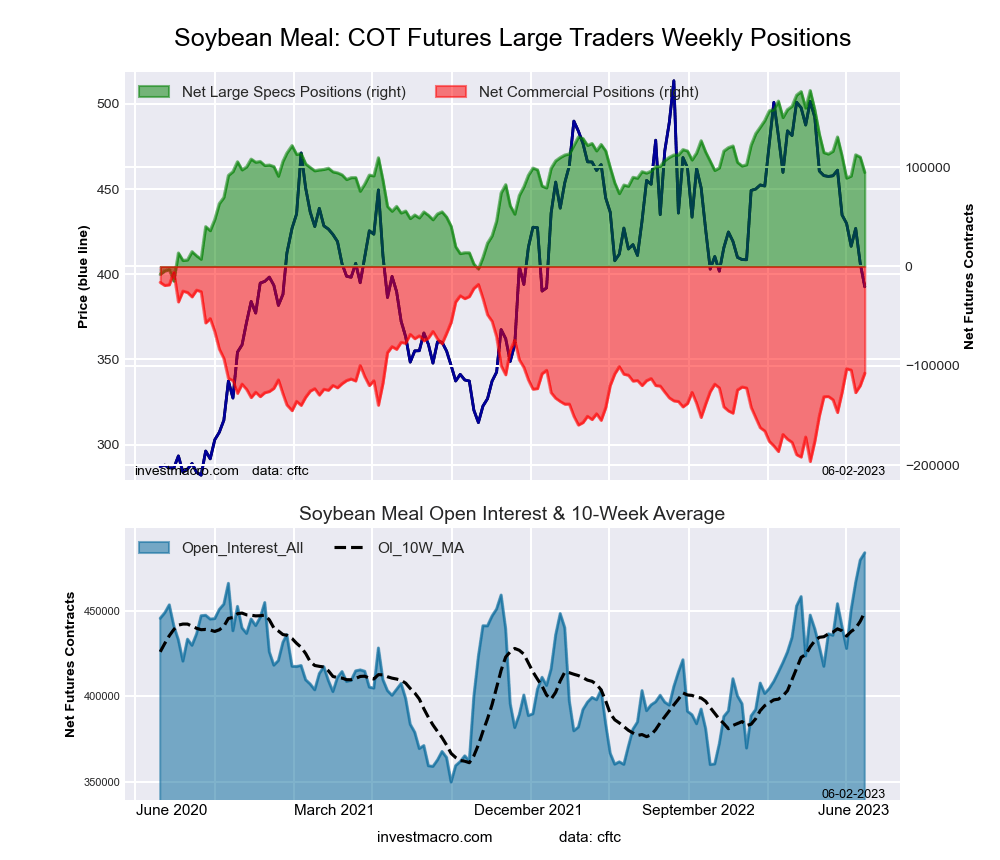 The SOYBEAN MEAL large speculator standing this week recorded a net position of 94,533 contracts in the data reported through Tuesday. This was a weekly fall of -15,489 contracts from the previous week which had a total of 110,022 net contracts.
This week’s current strength score (the trader positioning range over the past three years, measured from 0 to 100) shows the speculators are currently Bullish with a score of 57.0 percent. The commercials are Bearish with a score of 46.6 percent and the small traders (not shown in chart) are Bearish-Extreme with a score of 13.4 percent.
| SOYBEAN MEAL Futures Statistics | SPECULATORS | COMMERCIALS | SMALL TRADERS |
| – Percent of Open Interest Longs: | 25.1 | 39.5 | 9.6 |
| – Percent of Open Interest Shorts: | 5.6 | 61.7 | 6.9 |
| – Net Position: | 94,533 | -107,413 | 12,880 |
| – Gross Longs: | 121,664 | 191,186 | 46,401 |
| – Gross Shorts: | 27,131 | 298,599 | 33,521 |
| – Long to Short Ratio: | 4.5 to 1 | 0.6 to 1 | 1.4 to 1 |
| NET POSITION TREND: | |||
| – Strength Index Score (3 Year Range Pct): | 57.0 | 46.6 | 13.4 |
| – Strength Index Reading (3 Year Range): | Bullish | Bearish | Bearish-Extreme |
| NET POSITION MOVEMENT INDEX: | |||
| – 6-Week Change in Strength Index: | -18.6 | 20.7 | -16.7 |
LIVE CATTLE Futures:
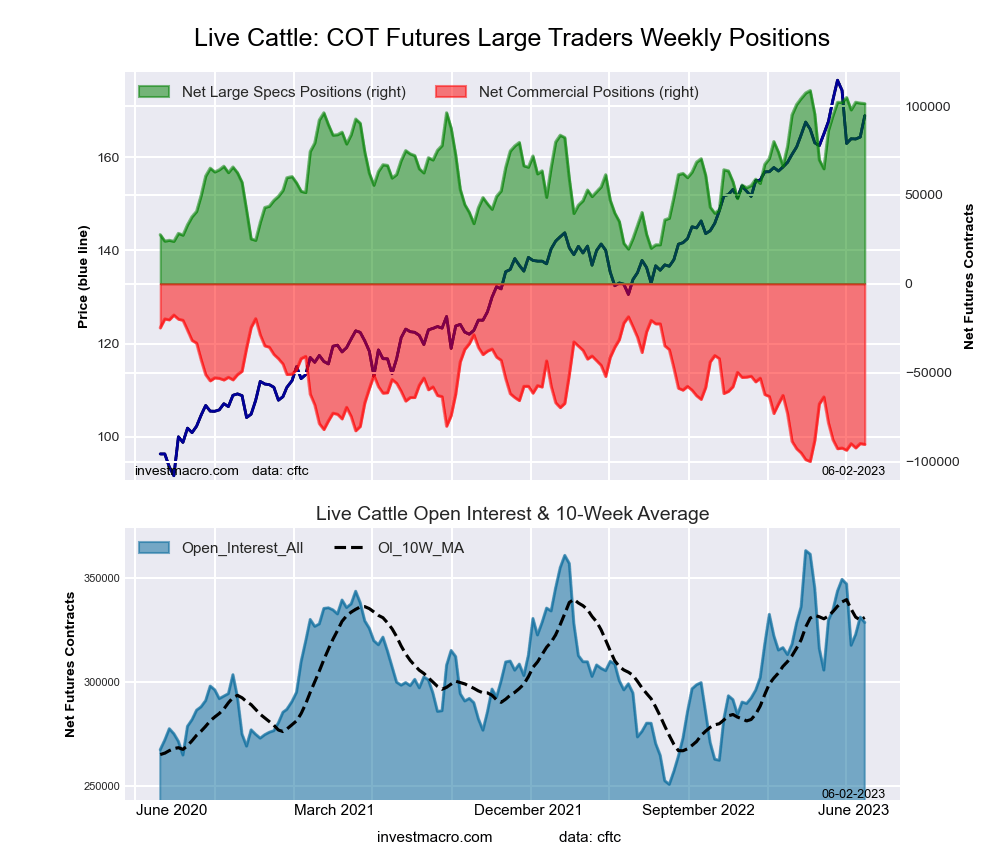 The LIVE CATTLE large speculator standing this week recorded a net position of 101,378 contracts in the data reported through Tuesday. This was a weekly decrease of -269 contracts from the previous week which had a total of 101,647 net contracts.
This week’s current strength score (the trader positioning range over the past three years, measured from 0 to 100) shows the speculators are currently Bullish-Extreme with a score of 91.8 percent. The commercials are Bearish-Extreme with a score of 11.7 percent and the small traders (not shown in chart) are Bearish with a score of 28.1 percent.
| LIVE CATTLE Futures Statistics | SPECULATORS | COMMERCIALS | SMALL TRADERS |
| – Percent of Open Interest Longs: | 46.1 | 27.3 | 9.5 |
| – Percent of Open Interest Shorts: | 15.2 | 54.8 | 12.8 |
| – Net Position: | 101,378 | -90,357 | -11,021 |
| – Gross Longs: | 151,401 | 89,705 | 31,082 |
| – Gross Shorts: | 50,023 | 180,062 | 42,103 |
| – Long to Short Ratio: | 3.0 to 1 | 0.5 to 1 | 0.7 to 1 |
| NET POSITION TREND: | |||
| – Strength Index Score (3 Year Range Pct): | 91.8 | 11.7 | 28.1 |
| – Strength Index Reading (3 Year Range): | Bullish-Extreme | Bearish-Extreme | Bearish |
| NET POSITION MOVEMENT INDEX: | |||
| – 6-Week Change in Strength Index: | -0.8 | 2.9 | -9.6 |
LEAN HOGS Futures:
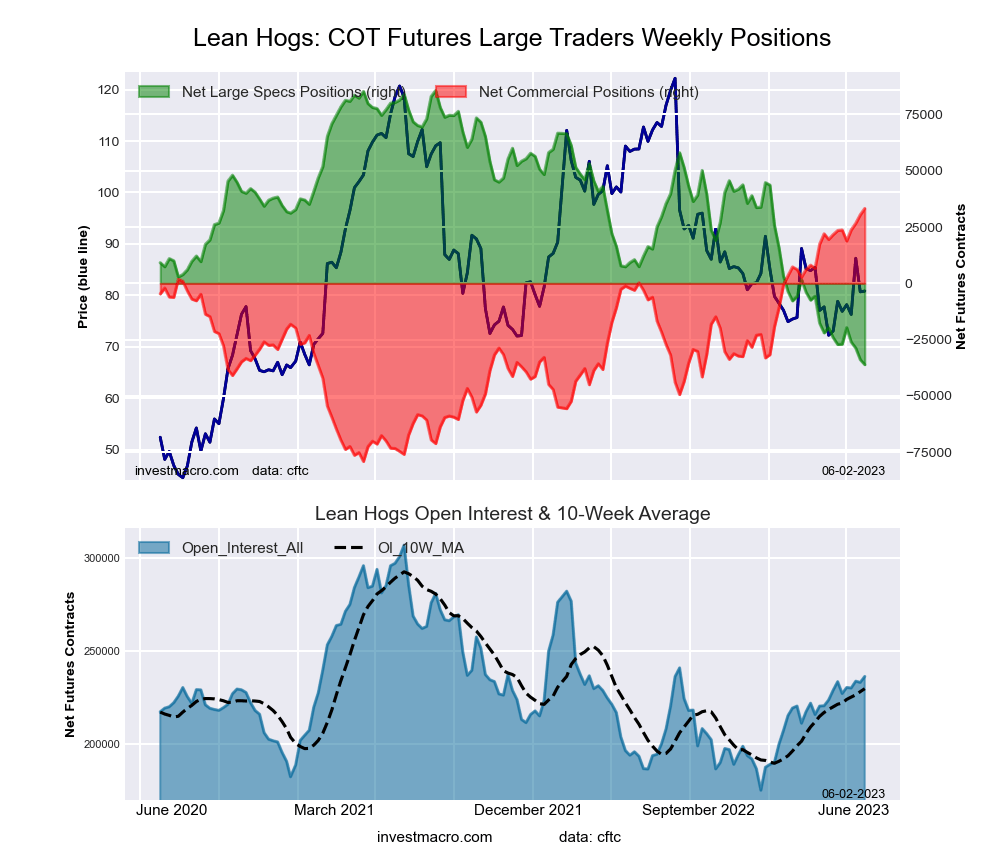 The LEAN HOGS large speculator standing this week recorded a net position of -36,114 contracts in the data reported through Tuesday. This was a weekly fall of -2,262 contracts from the previous week which had a total of -33,852 net contracts.
This week’s current strength score (the trader positioning range over the past three years, measured from 0 to 100) shows the speculators are currently Bearish-Extreme with a score of 0.0 percent. The commercials are Bullish-Extreme with a score of 100.0 percent and the small traders (not shown in chart) are Bullish-Extreme with a score of 96.3 percent.
| LEAN HOGS Futures Statistics | SPECULATORS | COMMERCIALS | SMALL TRADERS |
| – Percent of Open Interest Longs: | 23.3 | 38.1 | 9.7 |
| – Percent of Open Interest Shorts: | 38.6 | 24.0 | 8.5 |
| – Net Position: | -36,114 | 33,233 | 2,881 |
| – Gross Longs: | 54,977 | 89,961 | 22,880 |
| – Gross Shorts: | 91,091 | 56,728 | 19,999 |
| – Long to Short Ratio: | 0.6 to 1 | 1.6 to 1 | 1.1 to 1 |
| NET POSITION TREND: | |||
| – Strength Index Score (3 Year Range Pct): | 0.0 | 100.0 | 96.3 |
| – Strength Index Reading (3 Year Range): | Bearish-Extreme | Bullish-Extreme | Bullish-Extreme |
| NET POSITION MOVEMENT INDEX: | |||
| – 6-Week Change in Strength Index: | -7.4 | 8.7 | -3.7 |
COTTON Futures:
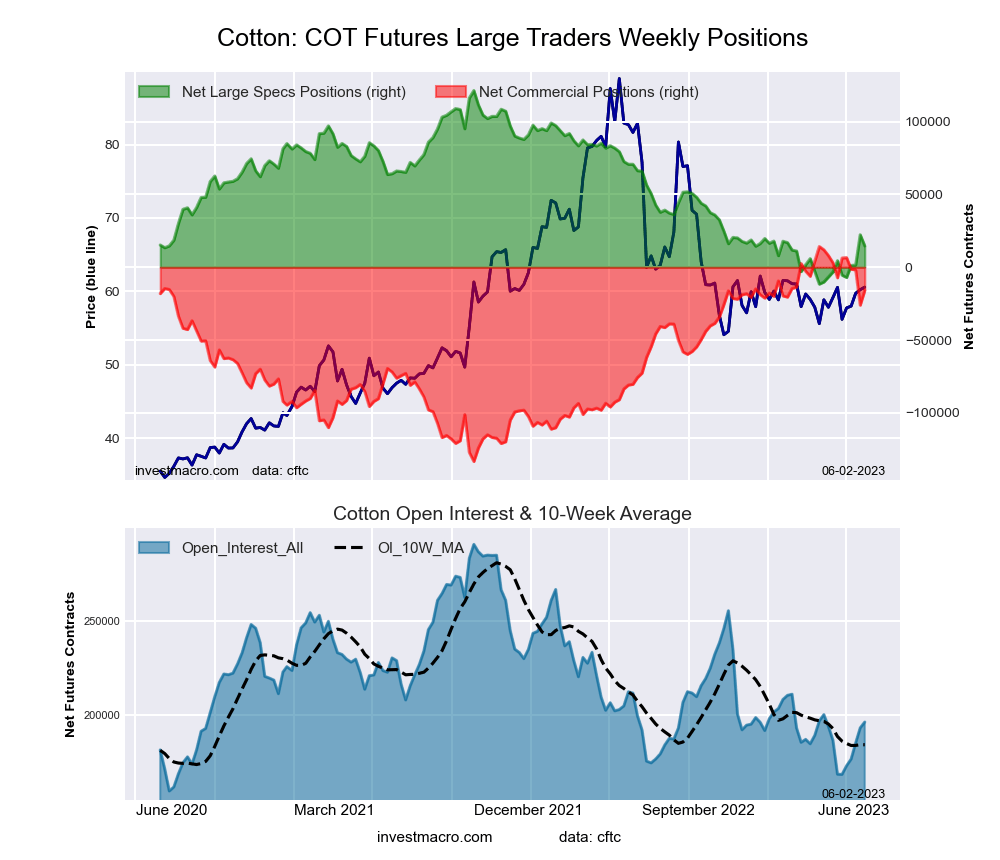 The COTTON large speculator standing this week recorded a net position of 14,612 contracts in the data reported through Tuesday. This was a weekly decline of -7,707 contracts from the previous week which had a total of 22,319 net contracts.
This week’s current strength score (the trader positioning range over the past three years, measured from 0 to 100) shows the speculators are currently Bearish-Extreme with a score of 19.7 percent. The commercials are Bullish with a score of 79.6 percent and the small traders (not shown in chart) are Bearish with a score of 23.6 percent.
| COTTON Futures Statistics | SPECULATORS | COMMERCIALS | SMALL TRADERS |
| – Percent of Open Interest Longs: | 30.0 | 48.6 | 6.1 |
| – Percent of Open Interest Shorts: | 22.5 | 56.7 | 5.5 |
| – Net Position: | 14,612 | -15,861 | 1,249 |
| – Gross Longs: | 58,770 | 95,264 | 12,016 |
| – Gross Shorts: | 44,158 | 111,125 | 10,767 |
| – Long to Short Ratio: | 1.3 to 1 | 0.9 to 1 | 1.1 to 1 |
| NET POSITION TREND: | |||
| – Strength Index Score (3 Year Range Pct): | 19.7 | 79.6 | 23.6 |
| – Strength Index Reading (3 Year Range): | Bearish-Extreme | Bullish | Bearish |
| NET POSITION MOVEMENT INDEX: | |||
| – 6-Week Change in Strength Index: | 7.6 | -5.9 | -9.2 |
COCOA Futures:
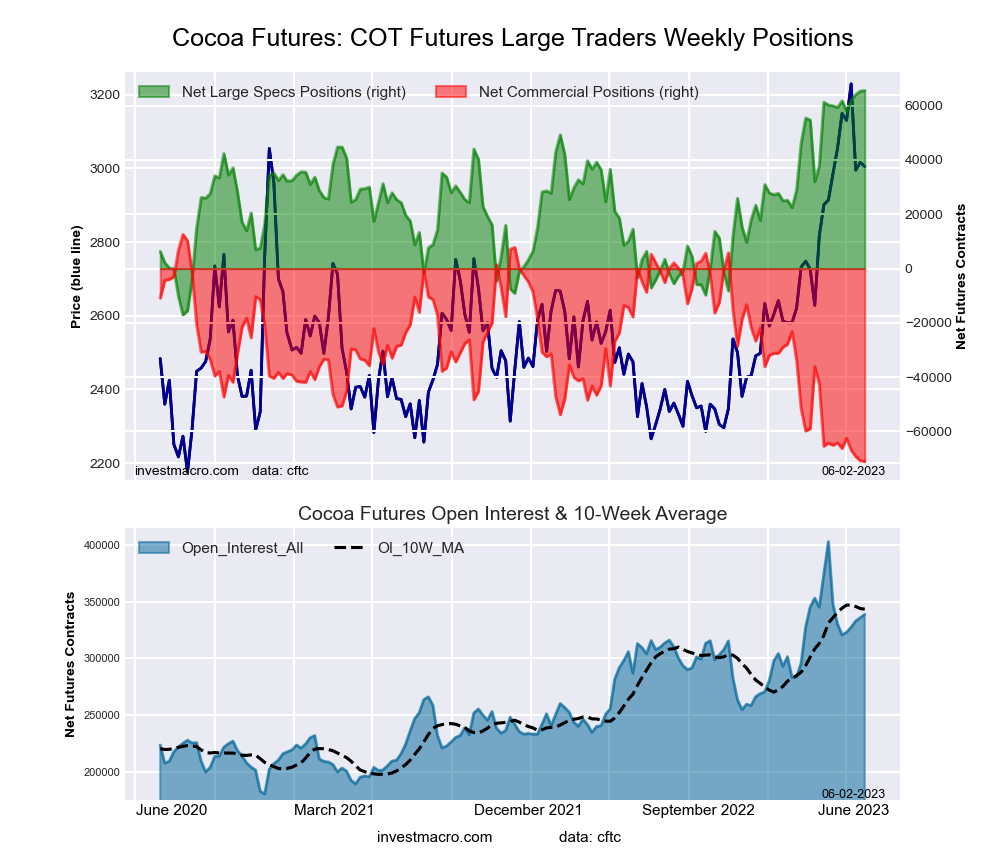 The COCOA large speculator standing this week recorded a net position of 65,573 contracts in the data reported through Tuesday. This was a weekly lift of 199 contracts from the previous week which had a total of 65,374 net contracts.
This week’s current strength score (the trader positioning range over the past three years, measured from 0 to 100) shows the speculators are currently Bullish-Extreme with a score of 100.0 percent. The commercials are Bearish-Extreme with a score of 0.0 percent and the small traders (not shown in chart) are Bullish with a score of 51.4 percent.
| COCOA Futures Statistics | SPECULATORS | COMMERCIALS | SMALL TRADERS |
| – Percent of Open Interest Longs: | 42.0 | 29.7 | 4.9 |
| – Percent of Open Interest Shorts: | 22.7 | 50.7 | 3.3 |
| – Net Position: | 65,573 | -71,049 | 5,476 |
| – Gross Longs: | 142,385 | 100,654 | 16,614 |
| – Gross Shorts: | 76,812 | 171,703 | 11,138 |
| – Long to Short Ratio: | 1.9 to 1 | 0.6 to 1 | 1.5 to 1 |
| NET POSITION TREND: | |||
| – Strength Index Score (3 Year Range Pct): | 100.0 | 0.0 | 51.4 |
| – Strength Index Reading (3 Year Range): | Bullish-Extreme | Bearish-Extreme | Bullish |
| NET POSITION MOVEMENT INDEX: | |||
| – 6-Week Change in Strength Index: | 7.5 | -8.3 | 6.9 |
WHEAT Futures:
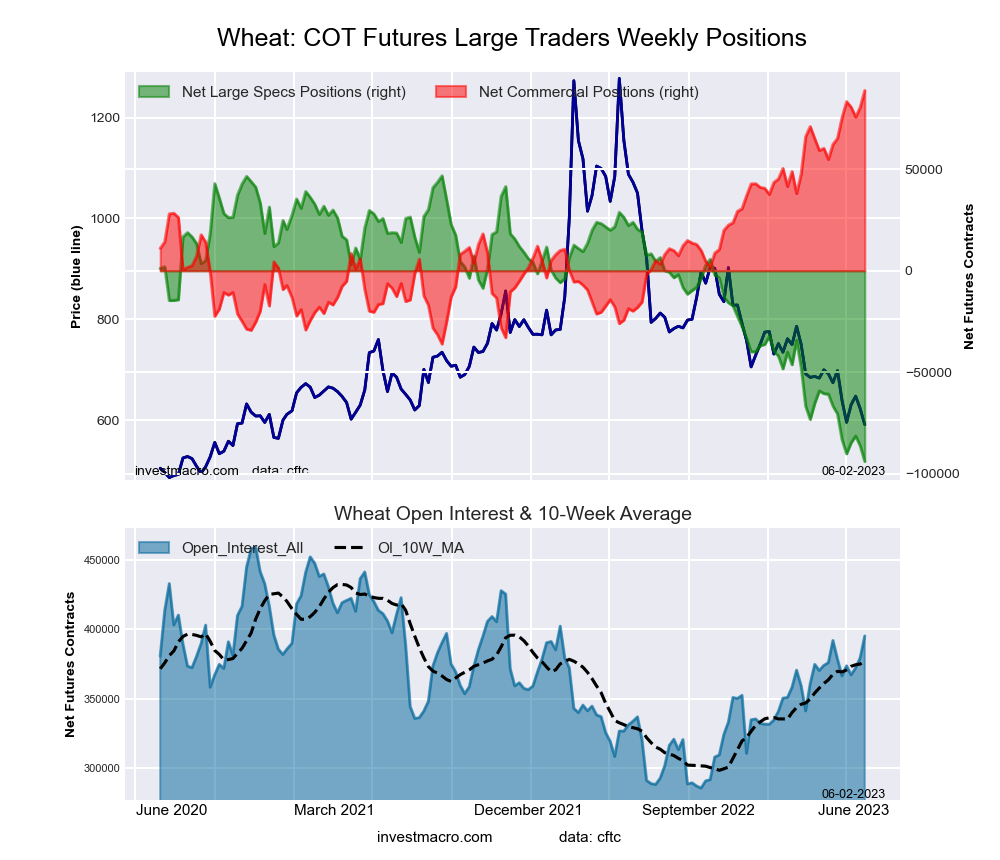 The WHEAT large speculator standing this week recorded a net position of -93,996 contracts in the data reported through Tuesday. This was a weekly decrease of -7,677 contracts from the previous week which had a total of -86,319 net contracts.
This week’s current strength score (the trader positioning range over the past three years, measured from 0 to 100) shows the speculators are currently Bearish-Extreme with a score of 0.0 percent. The commercials are Bullish-Extreme with a score of 100.0 percent and the small traders (not shown in chart) are Bullish-Extreme with a score of 90.8 percent.
| WHEAT Futures Statistics | SPECULATORS | COMMERCIALS | SMALL TRADERS |
| – Percent of Open Interest Longs: | 27.2 | 39.1 | 9.9 |
| – Percent of Open Interest Shorts: | 51.0 | 16.7 | 8.6 |
| – Net Position: | -93,996 | 88,847 | 5,149 |
| – Gross Longs: | 107,338 | 154,656 | 39,165 |
| – Gross Shorts: | 201,334 | 65,809 | 34,016 |
| – Long to Short Ratio: | 0.5 to 1 | 2.4 to 1 | 1.2 to 1 |
| NET POSITION TREND: | |||
| – Strength Index Score (3 Year Range Pct): | 0.0 | 100.0 | 90.8 |
| – Strength Index Reading (3 Year Range): | Bearish-Extreme | Bullish-Extreme | Bullish-Extreme |
| NET POSITION MOVEMENT INDEX: | |||
| – 6-Week Change in Strength Index: | -16.7 | 18.9 | -0.5 |
Article By InvestMacro – Receive our weekly COT Newsletter
*COT Report: The COT data, released weekly to the public each Friday, is updated through the most recent Tuesday (data is 3 days old) and shows a quick view of how large speculators or non-commercials (for-profit traders) were positioned in the futures markets.
The CFTC categorizes trader positions according to commercial hedgers (traders who use futures contracts for hedging as part of the business), non-commercials (large traders who speculate to realize trading profits) and nonreportable traders (usually small traders/speculators) as well as their open interest (contracts open in the market at time of reporting). See CFTC criteria here.

- COT Metals Charts: Weekly Speculator Bets led by Copper & Steel Jul 18, 2026
- COT Bonds Charts: Weekly Speculator Bets led by 2-Year, SOFR 3M & 5-Year Bonds Jul 18, 2026
- COT Energy Charts: Weekly Speculator Bets led by Brent Oil & Heating Oil Jul 18, 2026
- COT Soft Commodities Charts: Weekly Speculator Bets led by Wheat, Corn & Soybean Meal Jul 18, 2026
- The Bank of Canada kept its interest rate unchanged. Platinum prices reached a three‑week high Jul 16, 2026
- Stock indices rose after the release of US inflation data. China’s GDP slowed sharply Jul 15, 2026
- GBP/USD Awaits Political News: What Will Happen Next Jul 15, 2026
- USD/JPY Holds at Highs: Pressure Lingers on Yen Jul 14, 2026
- Oil prices jumped 4% amid a new wave of escalation between the US and Iran Jul 13, 2026
- EUR/USD: US Inflation Will Determine Everything Jul 13, 2026