
By InvestMacro
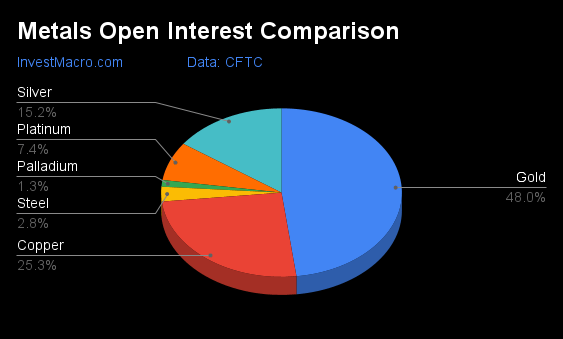
Here are the latest charts and statistics for the Commitment of Traders (COT) data published by the Commodities Futures Trading Commission (CFTC).
The latest COT data is updated through Tuesday June 6th and shows a quick view of how large traders (for-profit speculators and commercial entities) were positioned in the futures markets.
Weekly Speculator Changes led by Copper & Gold

The COT metals markets speculator bets were higher this week as five out of the six metals markets we cover had higher positioning while the other one markets had lower speculator contracts.
Free Reports:
 Get our Weekly Commitment of Traders Reports - See where the biggest traders (Hedge Funds and Commercial Hedgers) are positioned in the futures markets on a weekly basis.
 Download Our Metatrader 4 Indicators – Put Our Free MetaTrader 4 Custom Indicators on your charts when you join our Weekly Newsletter
Leading the gains for the metals was Copper (9,746 contracts) with Gold (6,325 contracts), Steel (2,593 contracts), Platinum (1,207 contracts) and Silver (351 contracts) also showing positive weeks.
The market with declines in speculator bets for the week was Palladium with a total change of -552 contracts on the week.
| Jun-06-2023 | OI | OI-Index | Spec-Net | Spec-Index | Com-Net | COM-Index | Smalls-Net | Smalls-Index |
|---|---|---|---|---|---|---|---|---|
| Gold | 436,301 | 7 | 175,641 | 54 | -198,187 | 47 | 22,546 | 36 |
| Silver | 137,871 | 23 | 21,475 | 49 | -34,065 | 53 | 12,590 | 36 |
| Copper | 229,756 | 66 | -25,956 | 8 | 24,610 | 92 | 1,346 | 27 |
| Palladium | 11,541 | 76 | -6,602 | 5 | 7,192 | 97 | -590 | 6 |
| Platinum | 67,537 | 65 | 24,613 | 72 | -28,747 | 34 | 4,134 | 24 |
Strength Scores led by Platinum & Steel

COT Strength Scores (a normalized measure of Speculator positions over a 3-Year range, from 0 to 100 where above 80 is Extreme-Bullish and below 20 is Extreme-Bearish) showed that Platinum (72 percent) and Steel (65 percent) lead the metals markets this week.
On the downside, Palladium (5 percent) and Copper (8 percent) come in at the lowest strength level currently and are in Extreme-Bearish territory (below 20 percent).
Strength Statistics:
Gold (54.4 percent) vs Gold previous week (51.6 percent)
Silver (48.9 percent) vs Silver previous week (48.4 percent)
Copper (8.4 percent) vs Copper previous week (0.0 percent)
Platinum (72.4 percent) vs Platinum previous week (69.6 percent)
Palladium (4.6 percent) vs Palladium previous week (9.7 percent)
Steel (65.3 percent) vs Palladium previous week (57.8 percent)
Steel tops the 6-Week Strength Trends

COT Strength Score Trends (or move index, calculates the 6-week changes in strength scores) showed that Steel (8 percent) leads the past six weeks trends for metals. Platinum (-12 percent) is the next highest positive mover in the latest trends data.
Silver (-13 percent) and Platinum (-12 percent) lead the downside trend scores currently.
Move Statistics:
Gold (-4.2 percent) vs Gold previous week (-9.1 percent)
Silver (-13.0 percent) vs Silver previous week (-7.8 percent)
Copper (-7.7 percent) vs Copper previous week (-38.6 percent)
Platinum (-11.5 percent) vs Platinum previous week (-2.1 percent)
Palladium (-6.7 percent) vs Palladium previous week (-3.8 percent)
Steel (8.3 percent) vs Steel previous week (-1.5 percent)
Individual Markets:
Gold Comex Futures:
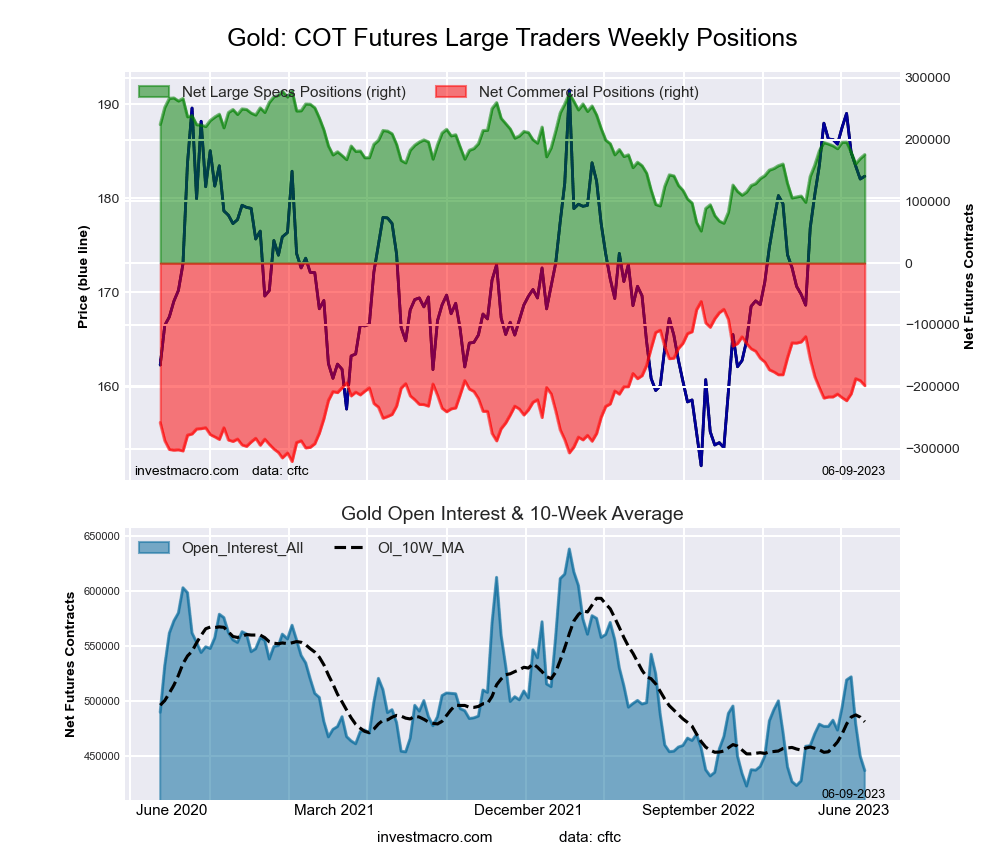 The Gold Comex Futures large speculator standing this week reached a net position of 175,641 contracts in the data reported through Tuesday. This was a weekly advance of 6,325 contracts from the previous week which had a total of 169,316 net contracts.
This week’s current strength score (the trader positioning range over the past three years, measured from 0 to 100) shows the speculators are currently Bullish with a score of 54.4 percent. The commercials are Bearish with a score of 47.4 percent and the small traders (not shown in chart) are Bearish with a score of 36.5 percent.
| Gold Futures Statistics | SPECULATORS | COMMERCIALS | SMALL TRADERS |
| – Percent of Open Interest Longs: | 54.4 | 26.7 | 10.9 |
| – Percent of Open Interest Shorts: | 14.2 | 72.1 | 5.7 |
| – Net Position: | 175,641 | -198,187 | 22,546 |
| – Gross Longs: | 237,467 | 116,363 | 47,595 |
| – Gross Shorts: | 61,826 | 314,550 | 25,049 |
| – Long to Short Ratio: | 3.8 to 1 | 0.4 to 1 | 1.9 to 1 |
| NET POSITION TREND: | |||
| – Strength Index Score (3 Year Range Pct): | 54.4 | 47.4 | 36.5 |
| – Strength Index Reading (3 Year Range): | Bullish | Bearish | Bearish |
| NET POSITION MOVEMENT INDEX: | |||
| – 6-Week Change in Strength Index: | -4.2 | 5.3 | -10.3 |
Silver Comex Futures:
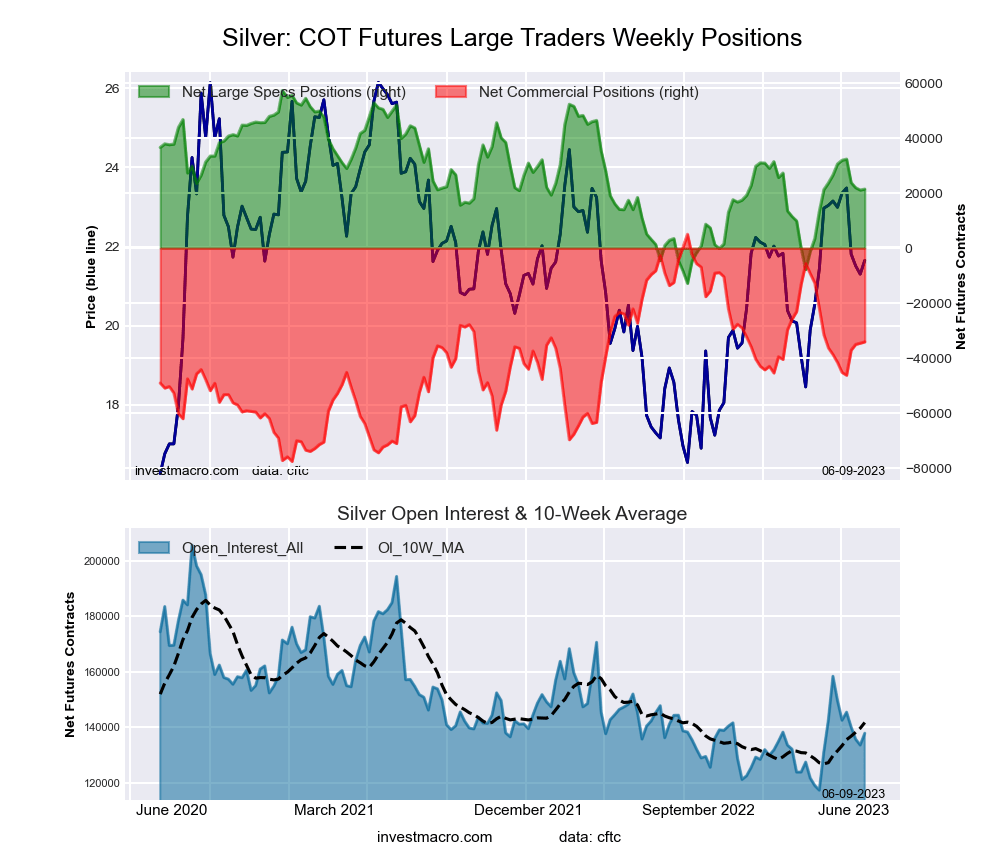 The Silver Comex Futures large speculator standing this week reached a net position of 21,475 contracts in the data reported through Tuesday. This was a weekly gain of 351 contracts from the previous week which had a total of 21,124 net contracts.
This week’s current strength score (the trader positioning range over the past three years, measured from 0 to 100) shows the speculators are currently Bearish with a score of 48.9 percent. The commercials are Bullish with a score of 52.6 percent and the small traders (not shown in chart) are Bearish with a score of 36.3 percent.
| Silver Futures Statistics | SPECULATORS | COMMERCIALS | SMALL TRADERS |
| – Percent of Open Interest Longs: | 38.5 | 31.0 | 18.8 |
| – Percent of Open Interest Shorts: | 23.0 | 55.7 | 9.6 |
| – Net Position: | 21,475 | -34,065 | 12,590 |
| – Gross Longs: | 53,149 | 42,785 | 25,871 |
| – Gross Shorts: | 31,674 | 76,850 | 13,281 |
| – Long to Short Ratio: | 1.7 to 1 | 0.6 to 1 | 1.9 to 1 |
| NET POSITION TREND: | |||
| – Strength Index Score (3 Year Range Pct): | 48.9 | 52.6 | 36.3 |
| – Strength Index Reading (3 Year Range): | Bearish | Bullish | Bearish |
| NET POSITION MOVEMENT INDEX: | |||
| – 6-Week Change in Strength Index: | -13.0 | 9.0 | 9.3 |
Copper Grade #1 Futures:
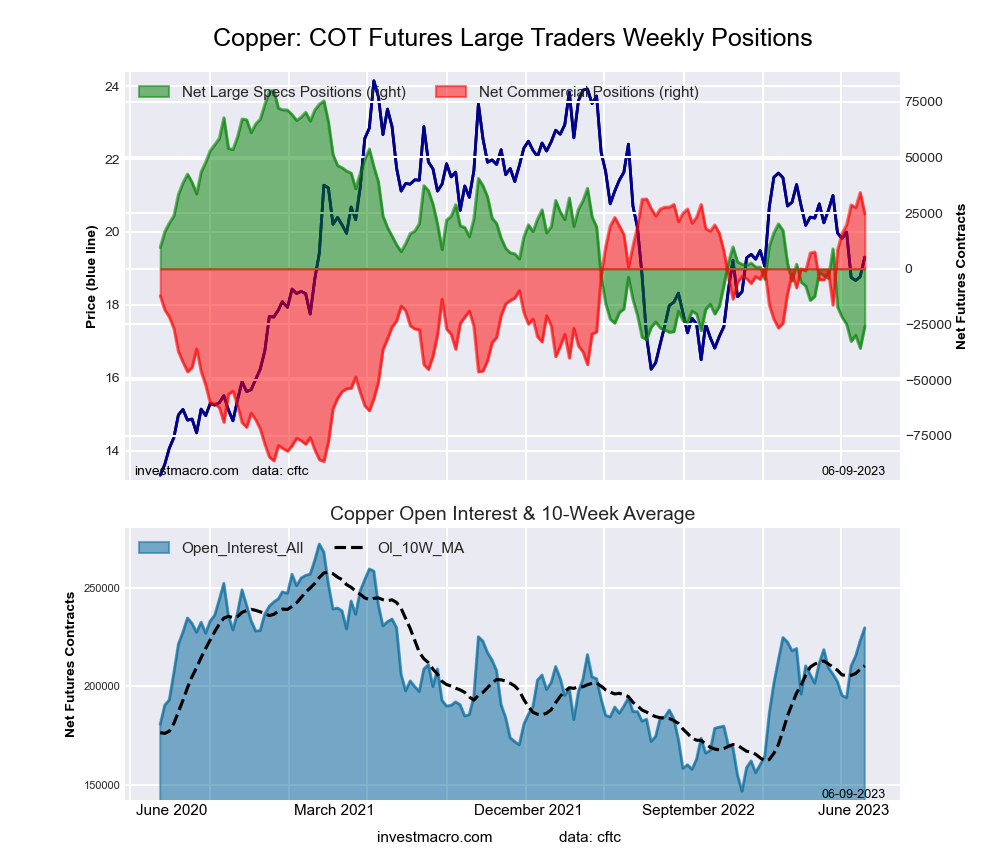 The Copper Grade #1 Futures large speculator standing this week reached a net position of -25,956 contracts in the data reported through Tuesday. This was a weekly increase of 9,746 contracts from the previous week which had a total of -35,702 net contracts.
This week’s current strength score (the trader positioning range over the past three years, measured from 0 to 100) shows the speculators are currently Bearish-Extreme with a score of 8.4 percent. The commercials are Bullish-Extreme with a score of 92.0 percent and the small traders (not shown in chart) are Bearish with a score of 27.0 percent.
| Copper Futures Statistics | SPECULATORS | COMMERCIALS | SMALL TRADERS |
| – Percent of Open Interest Longs: | 24.7 | 46.1 | 7.1 |
| – Percent of Open Interest Shorts: | 36.0 | 35.4 | 6.5 |
| – Net Position: | -25,956 | 24,610 | 1,346 |
| – Gross Longs: | 56,660 | 105,982 | 16,315 |
| – Gross Shorts: | 82,616 | 81,372 | 14,969 |
| – Long to Short Ratio: | 0.7 to 1 | 1.3 to 1 | 1.1 to 1 |
| NET POSITION TREND: | |||
| – Strength Index Score (3 Year Range Pct): | 8.4 | 92.0 | 27.0 |
| – Strength Index Reading (3 Year Range): | Bearish-Extreme | Bullish-Extreme | Bearish |
| NET POSITION MOVEMENT INDEX: | |||
| – 6-Week Change in Strength Index: | -7.7 | 13.5 | -46.6 |
Platinum Futures:
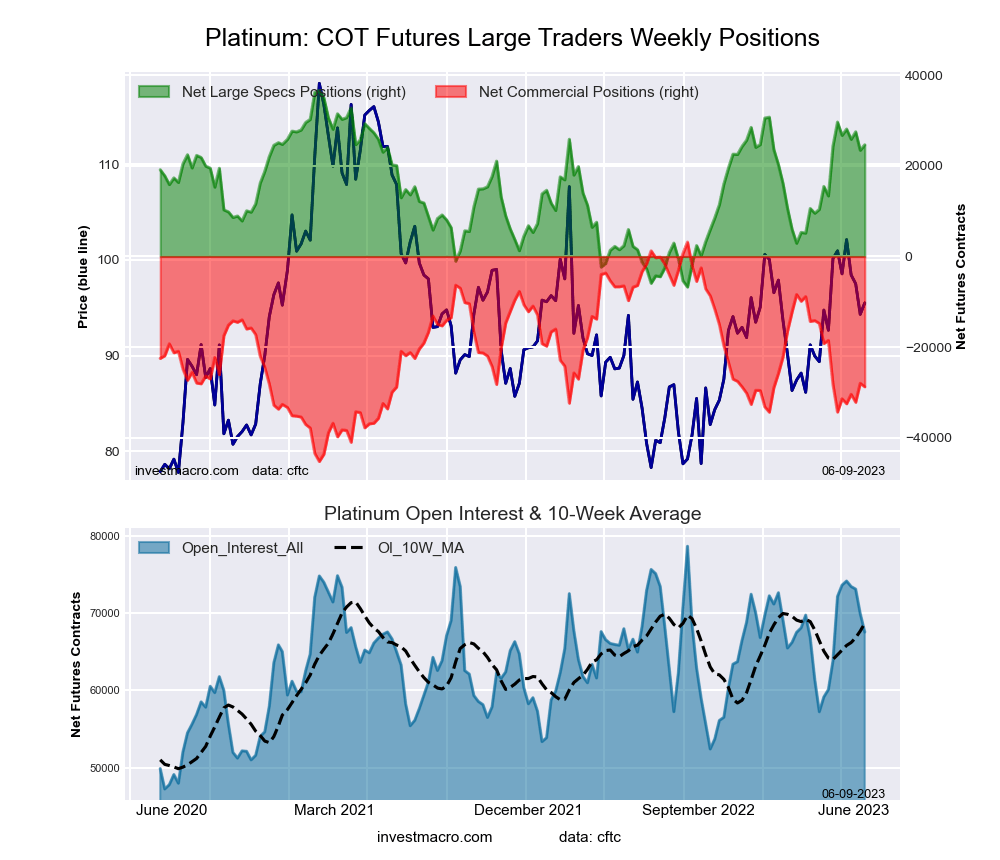 The Platinum Futures large speculator standing this week reached a net position of 24,613 contracts in the data reported through Tuesday. This was a weekly lift of 1,207 contracts from the previous week which had a total of 23,406 net contracts.
This week’s current strength score (the trader positioning range over the past three years, measured from 0 to 100) shows the speculators are currently Bullish with a score of 72.4 percent. The commercials are Bearish with a score of 34.0 percent and the small traders (not shown in chart) are Bearish with a score of 23.5 percent.
| Platinum Futures Statistics | SPECULATORS | COMMERCIALS | SMALL TRADERS |
| – Percent of Open Interest Longs: | 52.1 | 31.6 | 10.6 |
| – Percent of Open Interest Shorts: | 15.7 | 74.2 | 4.5 |
| – Net Position: | 24,613 | -28,747 | 4,134 |
| – Gross Longs: | 35,201 | 21,339 | 7,140 |
| – Gross Shorts: | 10,588 | 50,086 | 3,006 |
| – Long to Short Ratio: | 3.3 to 1 | 0.4 to 1 | 2.4 to 1 |
| NET POSITION TREND: | |||
| – Strength Index Score (3 Year Range Pct): | 72.4 | 34.0 | 23.5 |
| – Strength Index Reading (3 Year Range): | Bullish | Bearish | Bearish |
| NET POSITION MOVEMENT INDEX: | |||
| – 6-Week Change in Strength Index: | -11.5 | 11.5 | -7.5 |
Palladium Futures:
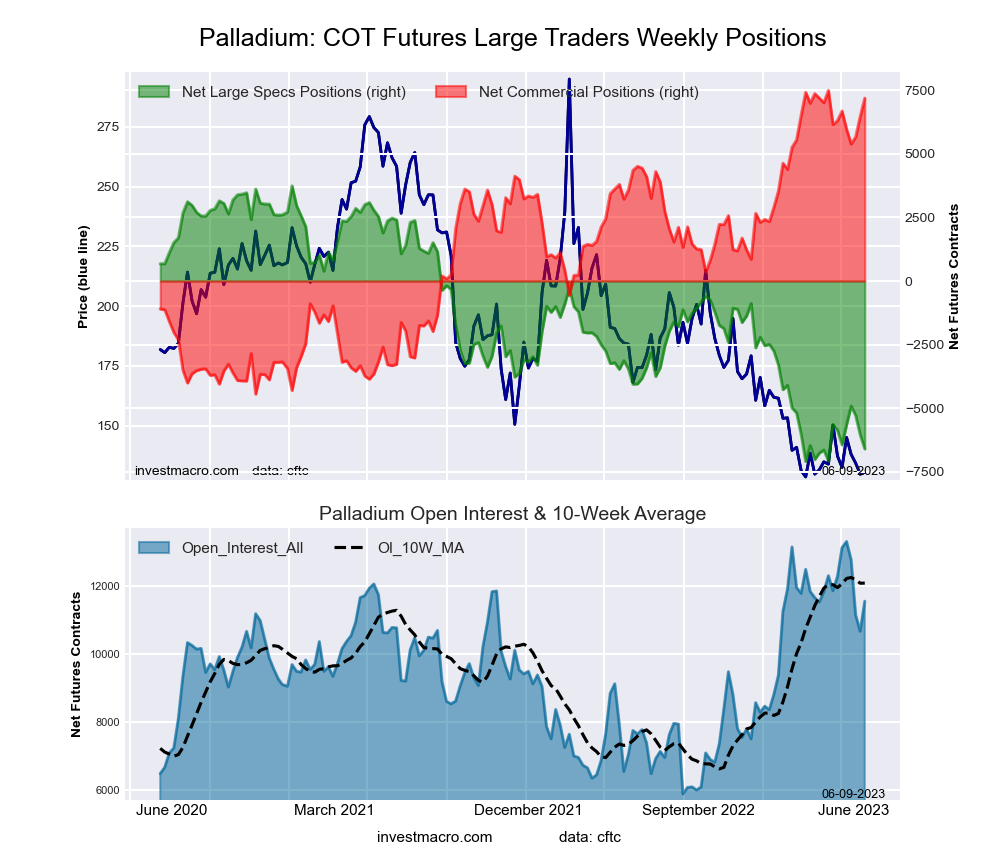 The Palladium Futures large speculator standing this week reached a net position of -6,602 contracts in the data reported through Tuesday. This was a weekly reduction of -552 contracts from the previous week which had a total of -6,050 net contracts.
This week’s current strength score (the trader positioning range over the past three years, measured from 0 to 100) shows the speculators are currently Bearish-Extreme with a score of 4.6 percent. The commercials are Bullish-Extreme with a score of 97.5 percent and the small traders (not shown in chart) are Bearish-Extreme with a score of 6.2 percent.
| Palladium Futures Statistics | SPECULATORS | COMMERCIALS | SMALL TRADERS |
| – Percent of Open Interest Longs: | 17.5 | 69.2 | 11.3 |
| – Percent of Open Interest Shorts: | 74.7 | 6.9 | 16.4 |
| – Net Position: | -6,602 | 7,192 | -590 |
| – Gross Longs: | 2,023 | 7,992 | 1,299 |
| – Gross Shorts: | 8,625 | 800 | 1,889 |
| – Long to Short Ratio: | 0.2 to 1 | 10.0 to 1 | 0.7 to 1 |
| NET POSITION TREND: | |||
| – Strength Index Score (3 Year Range Pct): | 4.6 | 97.5 | 6.2 |
| – Strength Index Reading (3 Year Range): | Bearish-Extreme | Bullish-Extreme | Bearish-Extreme |
| NET POSITION MOVEMENT INDEX: | |||
| – 6-Week Change in Strength Index: | -6.7 | 7.4 | -9.5 |
Steel Futures Futures:
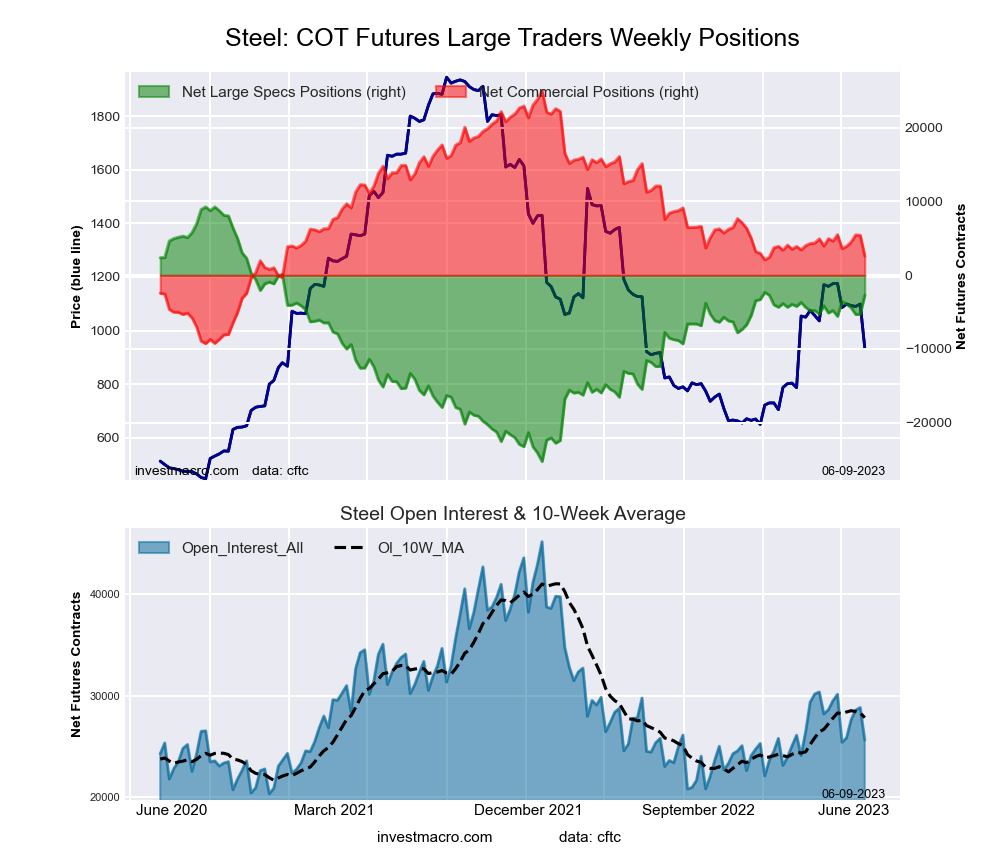 The Steel Futures large speculator standing this week reached a net position of -2,706 contracts in the data reported through Tuesday. This was a weekly rise of 2,593 contracts from the previous week which had a total of -5,299 net contracts.
This week’s current strength score (the trader positioning range over the past three years, measured from 0 to 100) shows the speculators are currently Bullish with a score of 65.3 percent. The commercials are Bearish with a score of 34.6 percent and the small traders (not shown in chart) are Bearish with a score of 34.8 percent.
| Steel Futures Statistics | SPECULATORS | COMMERCIALS | SMALL TRADERS |
| – Percent of Open Interest Longs: | 8.8 | 81.6 | 1.4 |
| – Percent of Open Interest Shorts: | 19.3 | 71.5 | 0.9 |
| – Net Position: | -2,706 | 2,593 | 113 |
| – Gross Longs: | 2,251 | 20,912 | 353 |
| – Gross Shorts: | 4,957 | 18,319 | 240 |
| – Long to Short Ratio: | 0.5 to 1 | 1.1 to 1 | 1.5 to 1 |
| NET POSITION TREND: | |||
| – Strength Index Score (3 Year Range Pct): | 65.3 | 34.6 | 34.8 |
| – Strength Index Reading (3 Year Range): | Bullish | Bearish | Bearish |
| NET POSITION MOVEMENT INDEX: | |||
| – 6-Week Change in Strength Index: | 8.3 | -8.5 | 6.2 |
Article By InvestMacro – Receive our weekly COT Newsletter
*COT Report: The COT data, released weekly to the public each Friday, is updated through the most recent Tuesday (data is 3 days old) and shows a quick view of how large speculators or non-commercials (for-profit traders) were positioned in the futures markets.
The CFTC categorizes trader positions according to commercial hedgers (traders who use futures contracts for hedging as part of the business), non-commercials (large traders who speculate to realize trading profits) and nonreportable traders (usually small traders/speculators) as well as their open interest (contracts open in the market at time of reporting). See CFTC criteria here.

- COT Metals Charts: Weekly Speculator Bets led by Copper & Steel Jul 18, 2026
- COT Bonds Charts: Weekly Speculator Bets led by 2-Year, SOFR 3M & 5-Year Bonds Jul 18, 2026
- COT Energy Charts: Weekly Speculator Bets led by Brent Oil & Heating Oil Jul 18, 2026
- COT Soft Commodities Charts: Weekly Speculator Bets led by Wheat, Corn & Soybean Meal Jul 18, 2026
- The Bank of Canada kept its interest rate unchanged. Platinum prices reached a three‑week high Jul 16, 2026
- Stock indices rose after the release of US inflation data. China’s GDP slowed sharply Jul 15, 2026
- GBP/USD Awaits Political News: What Will Happen Next Jul 15, 2026
- USD/JPY Holds at Highs: Pressure Lingers on Yen Jul 14, 2026
- Oil prices jumped 4% amid a new wave of escalation between the US and Iran Jul 13, 2026
- EUR/USD: US Inflation Will Determine Everything Jul 13, 2026