
By InvestMacro
Here are the latest charts and statistics for the Commitment of Traders (COT) data published by the Commodities Futures Trading Commission (CFTC).
The latest COT data is updated through Tuesday May 9th and shows a quick view of how large market participants (for-profit speculators and commercial traders) were positioned in the futures markets. All currency positions are in direct relation to the US dollar where, for example, a bet for the euro is a bet that the euro will rise versus the dollar while a bet against the euro will be a bet that the euro will decline versus the dollar.
Weekly Speculator Changes led by Mexican Peso & Canadian Dollar
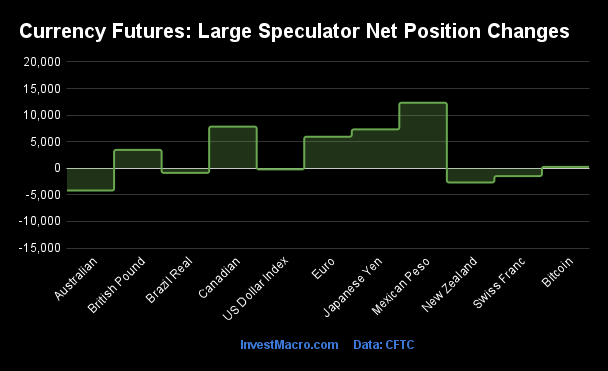
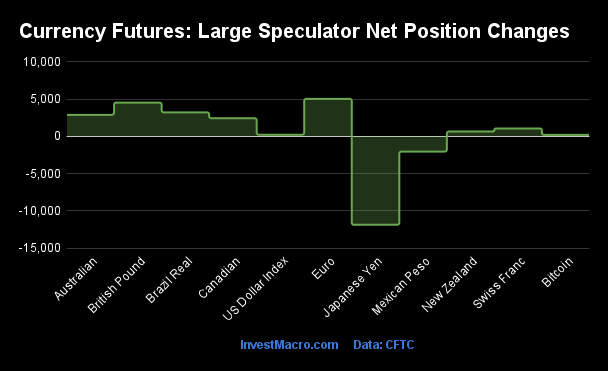
The COT currency market speculator bets were higher this week as six out of the eleven currency markets we cover had higher positioning while the other five markets had lower speculator contracts.
Leading the gains for the currency markets was the Mexican Peso (12,322 contracts) with the Canadian Dollar (7,833 contracts), the Japanese Yen (7,309 contracts), EuroFX (5,933 contracts), British Pound (3,463 contracts) and Bitcoin (255 contracts) also showing positive weeks.
The currencies seeing declines in speculator bets on the week were the Australian Dollar (-4,183 contracts) with the New Zealand Dollar (-2,664 contracts), Swiss Franc (-1,468 contracts), Brazilian Real (-867 contracts) and the US Dollar Index (-194 contracts) also registering lower bets on the week.
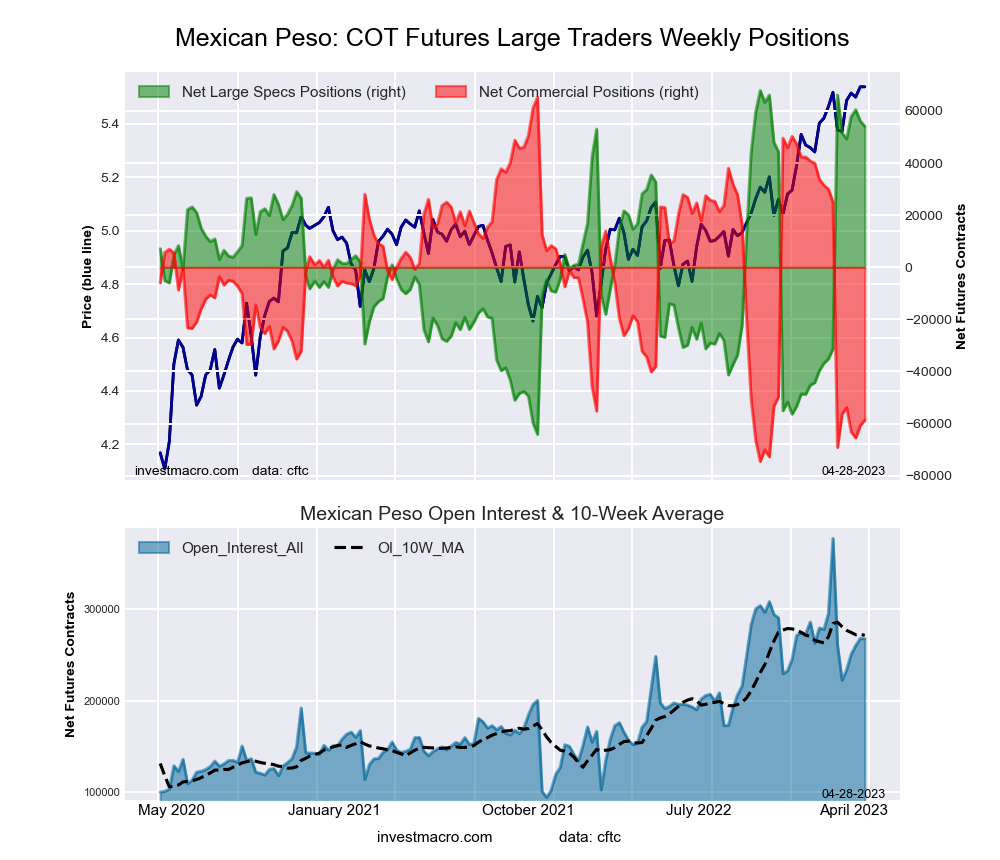
Mexican Peso positions hit 165-week high as peso cruises higher
Highlighting the COT currency data this week is the continued rise in the Mexican peso positioning. Large speculators boosted their bullish bets for the Mexican peso this week for the second straight week and for the fourth time out of the past six weeks.
Peso bets have now improved by a total of +101,284 contracts over the past nine weeks, going from a net position of -31,252 contracts on March 7th to this week’s total net position of +70,032 contracts. This boost in speculator sentiment has brought the current net position to the highest level in 165 weeks, dating back to the height of the pandemic in March of 2020.
Helping the peso positioning has been the rising interest rates in Mexico that recently reached the 11.25 percent level at the latest central bank meeting in March. There is speculation of another 25 basis point increase in May as well. This has given Mexico a rising interest rate differential with the US central bank that is seen as mostly likely holding its key interest rate in June with an 84 percent probability, according to the CME Fed Tool.
The Mexican peso exchange rate versus the US dollar has been in a sharp uptrend to start 2023. The MXN futures (front month) price closed this week at 0.5642 compared to the 2023 opening price around the 0.5070 exchange rate. The MXN futures have gained in six out of the past eight weeks and, this week, reached its highest level since September 2017.
| May-09-2023 | OI | OI-Index | Spec-Net | Spec-Index | Com-Net | COM-Index | Smalls-Net | Smalls-Index |
|---|---|---|---|---|---|---|---|---|
| USD Index | 32,175 | 28 | 11,156 | 44 | -12,626 | 56 | 1,470 | 33 |
| EUR | 794,721 | 90 | 179,422 | 88 | -234,260 | 11 | 54,838 | 66 |
| GBP | 242,576 | 63 | 4,528 | 73 | -11,528 | 26 | 7,000 | 72 |
| JPY | 192,574 | 42 | -61,015 | 31 | 69,162 | 69 | -8,147 | 37 |
| CHF | 43,389 | 47 | -4,467 | 43 | 4,759 | 53 | -292 | 57 |
| CAD | 159,364 | 37 | -42,263 | 15 | 41,957 | 85 | 306 | 23 |
| AUD | 165,532 | 62 | -49,193 | 39 | 56,897 | 61 | -7,704 | 34 |
| NZD | 41,583 | 39 | -4,581 | 41 | 4,283 | 57 | 298 | 54 |
| MXN | 255,441 | 57 | 70,032 | 100 | -76,533 | 0 | 6,501 | 96 |
| RUB | 20,930 | 4 | 7,543 | 31 | -7,150 | 69 | -393 | 24 |
| BRL | 49,208 | 38 | 34,594 | 80 | -36,504 | 20 | 1,910 | 59 |
| Bitcoin | 13,102 | 56 | 423 | 84 | -1,131 | 0 | 708 | 29 |
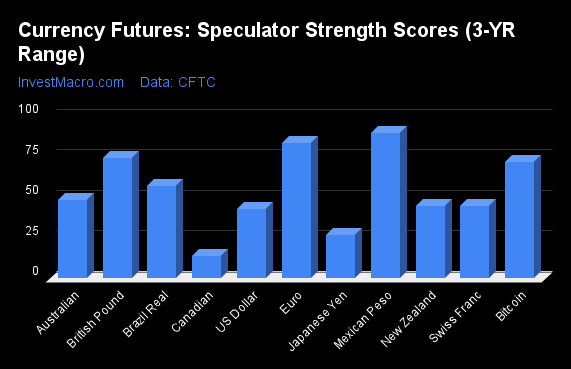
Strength Scores led by Mexican Peso & EuroFX
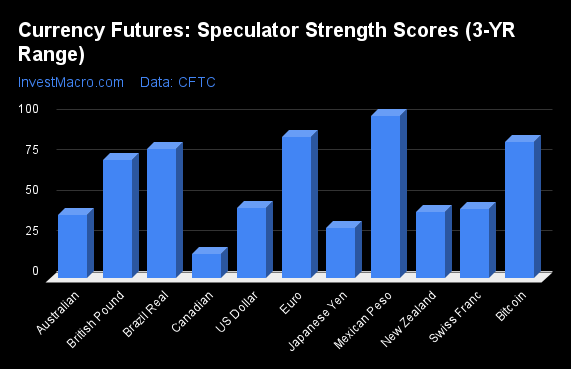
COT Strength Scores (a normalized measure of Speculator positions over a 3-Year range, from 0 to 100 where above 80 is Extreme-Bullish and below 20 is Extreme-Bearish) showed that the Mexican Peso (100 percent) and the EuroFX (88 percent) lead the currency markets this week. Bitcoin (84 percent), Brazilian Real (80 percent) and the British Pound (73 percent) come in as the next highest in the weekly strength scores.
On the downside, the Canadian Dollar (15 percent) comes in at the lowest strength levels currently and is in Extreme-Bearish territory (below 20 percent). The next lowest strength scores are the Japanese Yen (31 percent), Australian Dollar (39 percent) and the New Zealand Dollar (41 percent).
Strength Statistics:
US Dollar Index (43.5 percent) vs US Dollar Index previous week (43.9 percent)
EuroFX (87.5 percent) vs EuroFX previous week (85.3 percent)
British Pound Sterling (72.9 percent) vs British Pound Sterling previous week (69.9 percent)
Japanese Yen (31.3 percent) vs Japanese Yen previous week (26.8 percent)
Swiss Franc (42.8 percent) vs Swiss Franc previous week (46.7 percent)
Canadian Dollar (15.1 percent) vs Canadian Dollar previous week (7.8 percent)
Australian Dollar (39.2 percent) vs Australian Dollar previous week (43.1 percent)
New Zealand Dollar (41.2 percent) vs New Zealand Dollar previous week (48.4 percent)
Mexican Peso (100.0 percent) vs Mexican Peso previous week (90.8 percent)
Brazilian Real (79.8 percent) vs Brazilian Real previous week (80.9 percent)
Bitcoin (84.3 percent) vs Bitcoin previous week (79.9 percent)
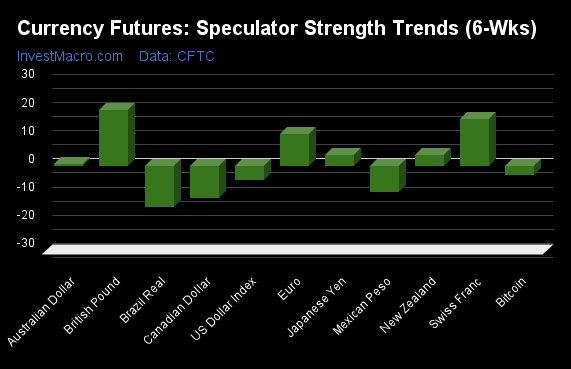
British Pound & Mexican Peso top the 6-Week Strength Trends
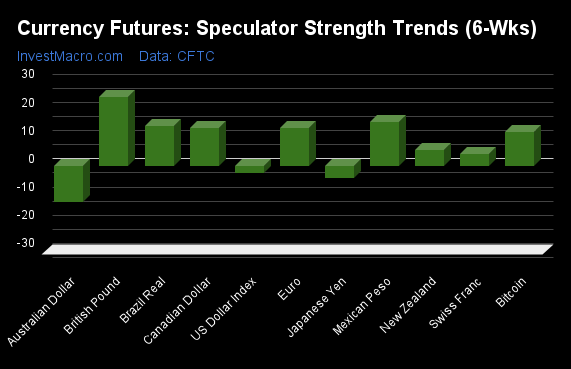
COT Strength Score Trends (or move index, calculates the 6-week changes in strength scores) showed that the British Pound (25 percent) and the Mexican Peso (15 percent) lead the past six weeks trends for the currencies. The Canadian Dollar (14 percent), the Brazilian Real (14 percent) and the EuroFX (13 percent) are the next highest positive movers in the latest trends data.
The Australian Dollar (-13 percent) leads the downside trend scores currently with the Japanese Yen (-4 percent), US Dollar Index (-3 percent) and the Swiss Franc (4 percent) following next with lower trend scores.
Strength Trend Statistics:
US Dollar Index (-2.6 percent) vs US Dollar Index previous week (-4.7 percent)
EuroFX (13.3 percent) vs EuroFX previous week (11.0 percent)
British Pound Sterling (24.6 percent) vs British Pound Sterling previous week (18.5 percent)
Japanese Yen (-4.3 percent) vs Japanese Yen previous week (-1.2 percent)
Swiss Franc (4.2 percent) vs Swiss Franc previous week (11.4 percent)
Canadian Dollar (13.6 percent) vs Canadian Dollar previous week (6.3 percent)
Australian Dollar (-12.8 percent) vs Australian Dollar previous week (-6.1 percent)
New Zealand Dollar (5.5 percent) vs New Zealand Dollar previous week (18.6 percent)
Mexican Peso (15.5 percent) vs Mexican Peso previous week (4.6 percent)
Brazilian Real (14.1 percent) vs Brazilian Real previous week (13.5 percent)
Bitcoin (12.2 percent) vs Bitcoin previous week (13.8 percent)
Individual COT Forex Markets:
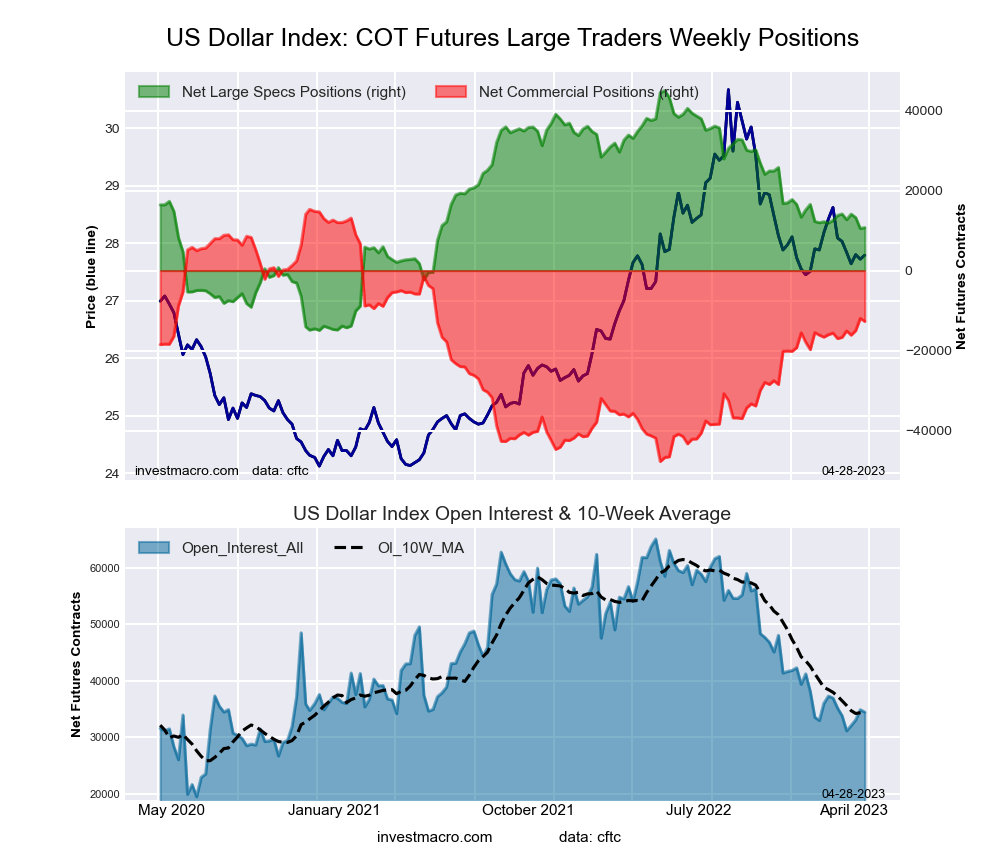
US Dollar Index Futures:
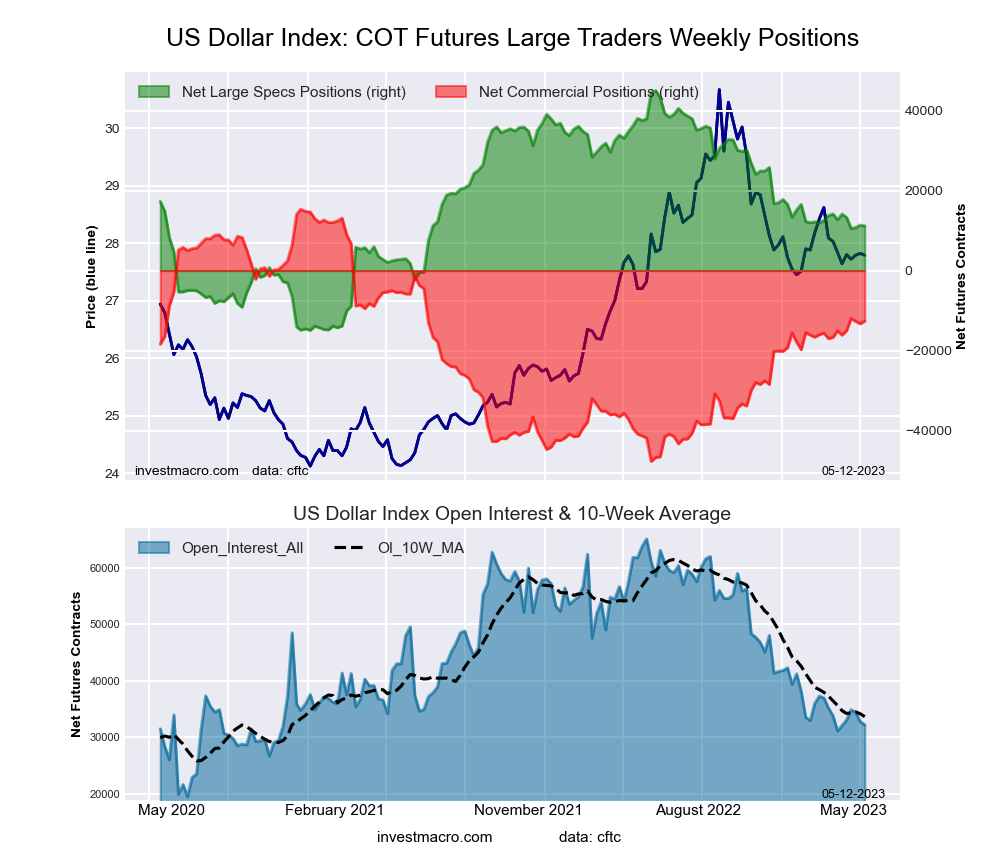 The US Dollar Index large speculator standing this week resulted in a net position of 11,156 contracts in the data reported through Tuesday. This was a weekly reduction of -194 contracts from the previous week which had a total of 11,350 net contracts.
This week’s current strength score (the trader positioning range over the past three years, measured from 0 to 100) shows the speculators are currently Bearish with a score of 43.5 percent. The commercials are Bullish with a score of 55.7 percent and the small traders (not shown in chart) are Bearish with a score of 32.6 percent.
| US DOLLAR INDEX Statistics | SPECULATORS | COMMERCIALS | SMALL TRADERS |
| – Percent of Open Interest Longs: | 67.3 | 12.1 | 15.3 |
| – Percent of Open Interest Shorts: | 32.6 | 51.4 | 10.7 |
| – Net Position: | 11,156 | -12,626 | 1,470 |
| – Gross Longs: | 21,656 | 3,902 | 4,923 |
| – Gross Shorts: | 10,500 | 16,528 | 3,453 |
| – Long to Short Ratio: | 2.1 to 1 | 0.2 to 1 | 1.4 to 1 |
| NET POSITION TREND: | |||
| – Strength Index Score (3 Year Range Pct): | 43.5 | 55.7 | 32.6 |
| – Strength Index Reading (3 Year Range): | Bearish | Bullish | Bearish |
| NET POSITION MOVEMENT INDEX: | |||
| – 6-Week Change in Strength Index: | -2.6 | 3.9 | -9.8 |
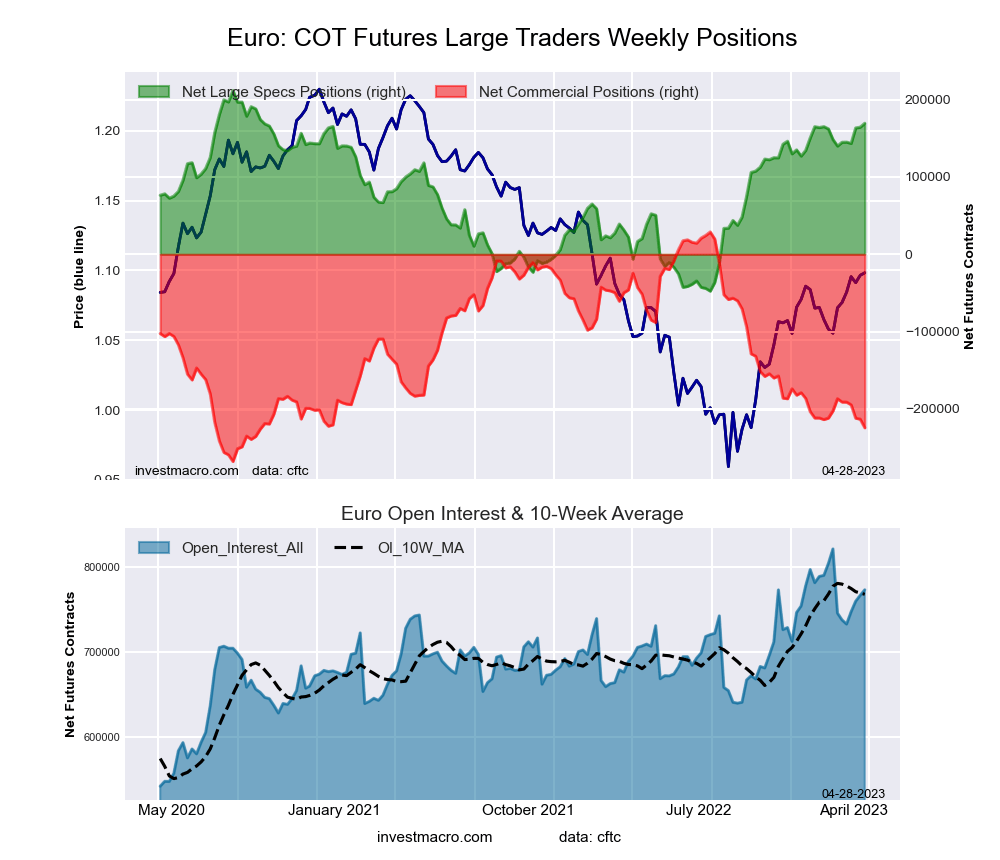
Euro Currency Futures:
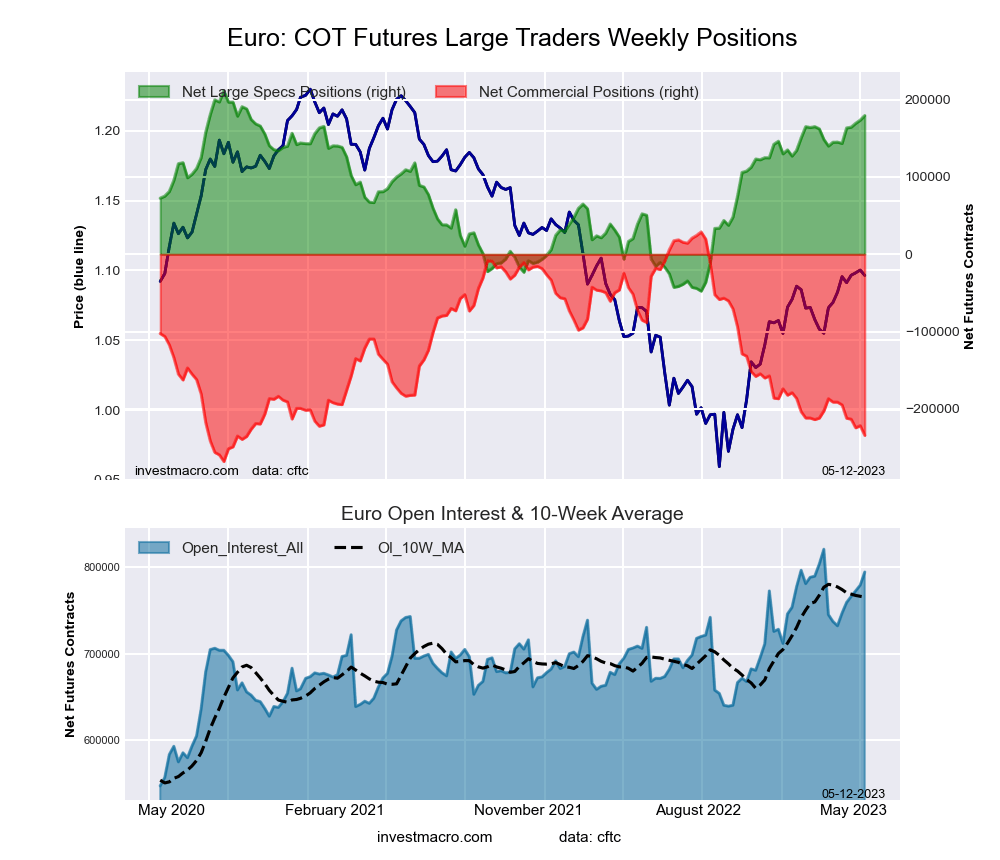 The Euro Currency large speculator standing this week resulted in a net position of 179,422 contracts in the data reported through Tuesday. This was a weekly increase of 5,933 contracts from the previous week which had a total of 173,489 net contracts.
This week’s current strength score (the trader positioning range over the past three years, measured from 0 to 100) shows the speculators are currently Bullish-Extreme with a score of 87.5 percent. The commercials are Bearish-Extreme with a score of 11.4 percent and the small traders (not shown in chart) are Bullish with a score of 66.5 percent.
| EURO Currency Statistics | SPECULATORS | COMMERCIALS | SMALL TRADERS |
| – Percent of Open Interest Longs: | 32.8 | 52.6 | 12.1 |
| – Percent of Open Interest Shorts: | 10.2 | 82.1 | 5.2 |
| – Net Position: | 179,422 | -234,260 | 54,838 |
| – Gross Longs: | 260,335 | 418,410 | 96,515 |
| – Gross Shorts: | 80,913 | 652,670 | 41,677 |
| – Long to Short Ratio: | 3.2 to 1 | 0.6 to 1 | 2.3 to 1 |
| NET POSITION TREND: | |||
| – Strength Index Score (3 Year Range Pct): | 87.5 | 11.4 | 66.5 |
| – Strength Index Reading (3 Year Range): | Bullish-Extreme | Bearish-Extreme | Bullish |
| NET POSITION MOVEMENT INDEX: | |||
| – 6-Week Change in Strength Index: | 13.3 | -14.5 | 13.7 |
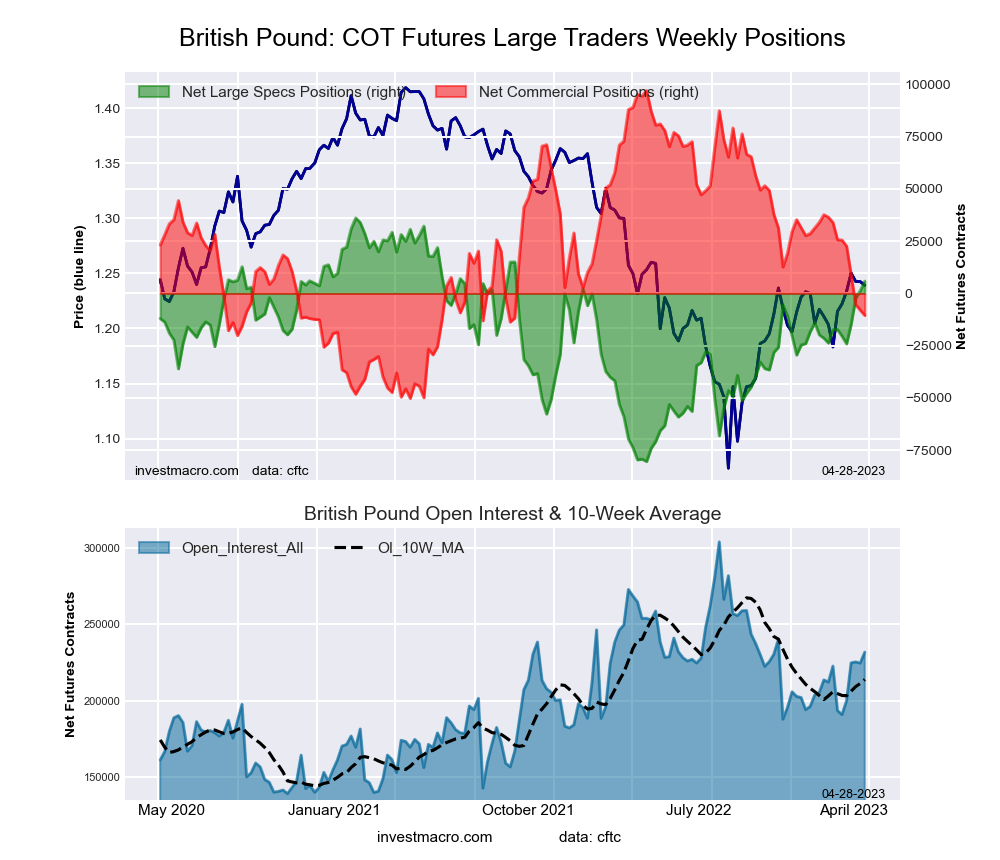
British Pound Sterling Futures:
 The British Pound Sterling large speculator standing this week resulted in a net position of 4,528 contracts in the data reported through Tuesday. This was a weekly advance of 3,463 contracts from the previous week which had a total of 1,065 net contracts.
This week’s current strength score (the trader positioning range over the past three years, measured from 0 to 100) shows the speculators are currently Bullish with a score of 72.9 percent. The commercials are Bearish with a score of 26.3 percent and the small traders (not shown in chart) are Bullish with a score of 71.8 percent.
| BRITISH POUND Statistics | SPECULATORS | COMMERCIALS | SMALL TRADERS |
| – Percent of Open Interest Longs: | 29.5 | 52.3 | 12.8 |
| – Percent of Open Interest Shorts: | 27.6 | 57.1 | 9.9 |
| – Net Position: | 4,528 | -11,528 | 7,000 |
| – Gross Longs: | 71,561 | 126,935 | 31,057 |
| – Gross Shorts: | 67,033 | 138,463 | 24,057 |
| – Long to Short Ratio: | 1.1 to 1 | 0.9 to 1 | 1.3 to 1 |
| NET POSITION TREND: | |||
| – Strength Index Score (3 Year Range Pct): | 72.9 | 26.3 | 71.8 |
| – Strength Index Reading (3 Year Range): | Bullish | Bearish | Bullish |
| NET POSITION MOVEMENT INDEX: | |||
| – 6-Week Change in Strength Index: | 24.6 | -23.2 | 10.8 |
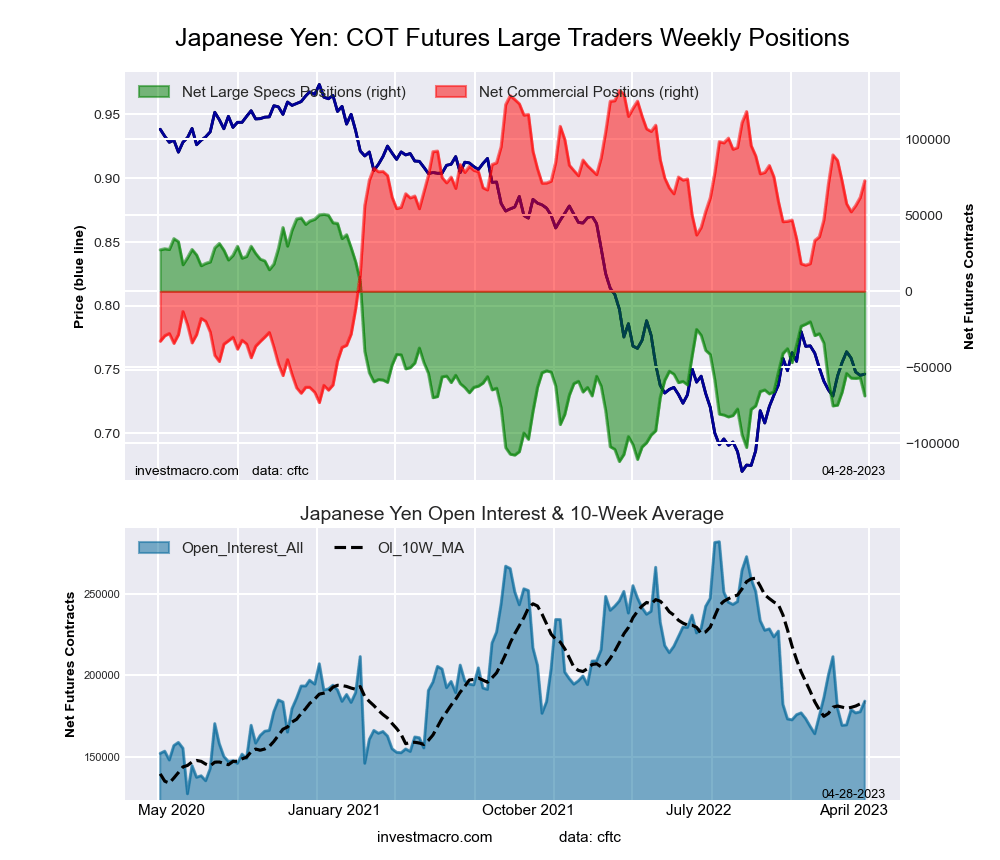
Japanese Yen Futures:
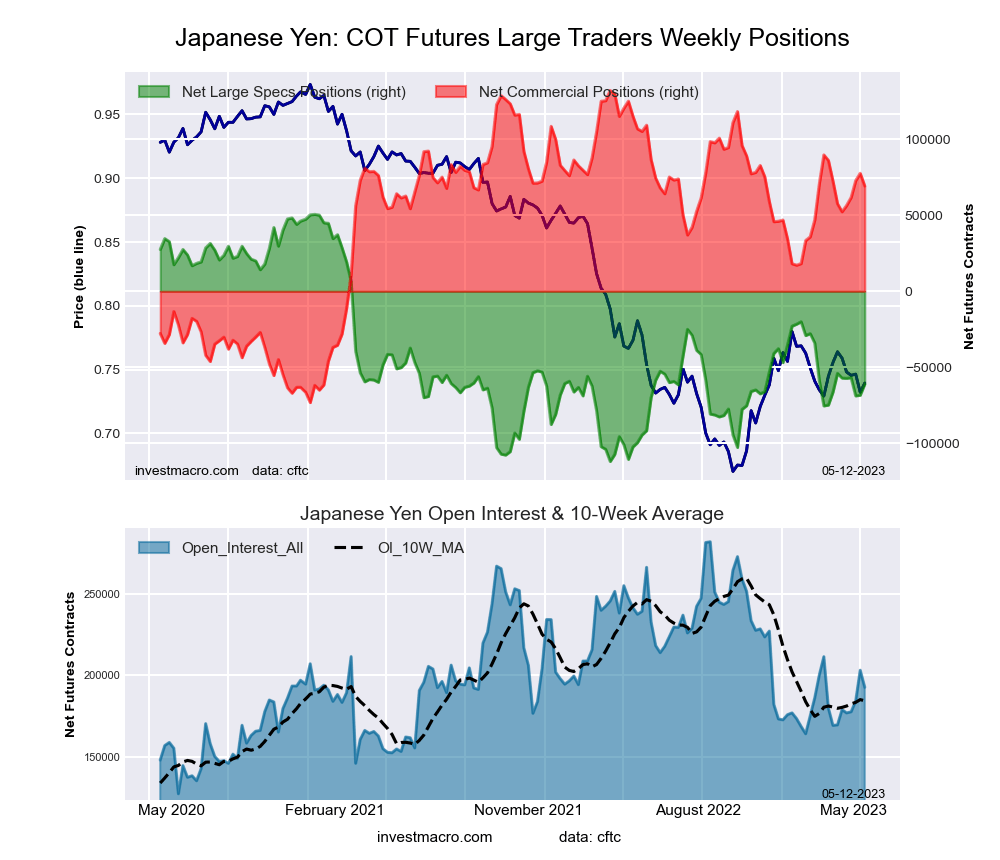 The Japanese Yen large speculator standing this week resulted in a net position of -61,015 contracts in the data reported through Tuesday. This was a weekly rise of 7,309 contracts from the previous week which had a total of -68,324 net contracts.
This week’s current strength score (the trader positioning range over the past three years, measured from 0 to 100) shows the speculators are currently Bearish with a score of 31.3 percent. The commercials are Bullish with a score of 69.4 percent and the small traders (not shown in chart) are Bearish with a score of 36.9 percent.
| JAPANESE YEN Statistics | SPECULATORS | COMMERCIALS | SMALL TRADERS |
| – Percent of Open Interest Longs: | 11.5 | 71.7 | 15.1 |
| – Percent of Open Interest Shorts: | 43.2 | 35.7 | 19.4 |
| – Net Position: | -61,015 | 69,162 | -8,147 |
| – Gross Longs: | 22,229 | 137,992 | 29,150 |
| – Gross Shorts: | 83,244 | 68,830 | 37,297 |
| – Long to Short Ratio: | 0.3 to 1 | 2.0 to 1 | 0.8 to 1 |
| NET POSITION TREND: | |||
| – Strength Index Score (3 Year Range Pct): | 31.3 | 69.4 | 36.9 |
| – Strength Index Reading (3 Year Range): | Bearish | Bullish | Bearish |
| NET POSITION MOVEMENT INDEX: | |||
| – 6-Week Change in Strength Index: | -4.3 | 5.7 | -9.3 |
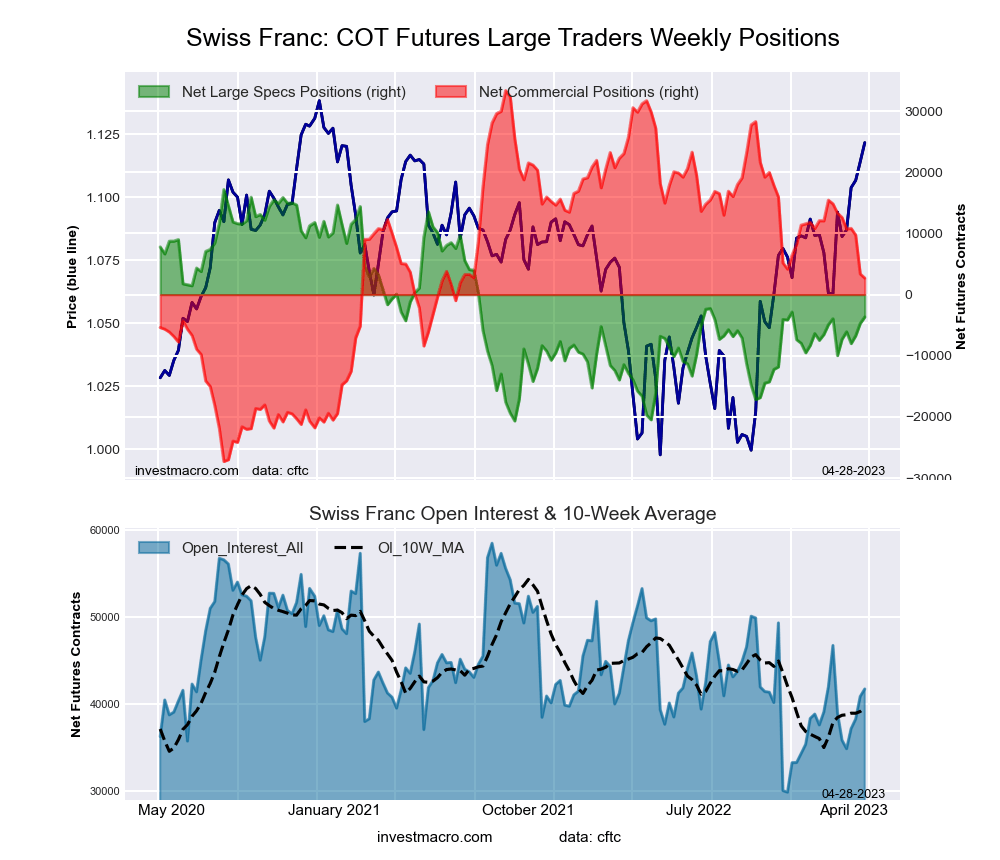
Swiss Franc Futures:
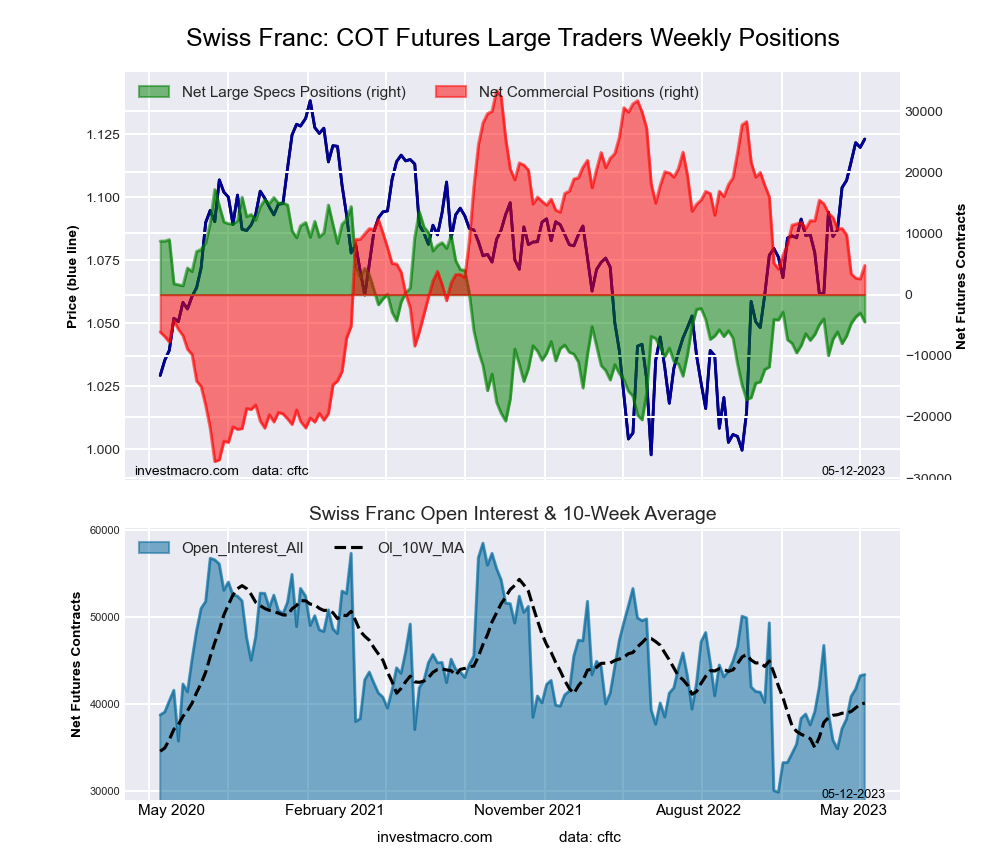 The Swiss Franc large speculator standing this week resulted in a net position of -4,467 contracts in the data reported through Tuesday. This was a weekly fall of -1,468 contracts from the previous week which had a total of -2,999 net contracts.
This week’s current strength score (the trader positioning range over the past three years, measured from 0 to 100) shows the speculators are currently Bearish with a score of 42.8 percent. The commercials are Bullish with a score of 52.8 percent and the small traders (not shown in chart) are Bullish with a score of 56.5 percent.
| SWISS FRANC Statistics | SPECULATORS | COMMERCIALS | SMALL TRADERS |
| – Percent of Open Interest Longs: | 16.3 | 44.8 | 33.8 |
| – Percent of Open Interest Shorts: | 26.6 | 33.8 | 34.5 |
| – Net Position: | -4,467 | 4,759 | -292 |
| – Gross Longs: | 7,056 | 19,431 | 14,657 |
| – Gross Shorts: | 11,523 | 14,672 | 14,949 |
| – Long to Short Ratio: | 0.6 to 1 | 1.3 to 1 | 1.0 to 1 |
| NET POSITION TREND: | |||
| – Strength Index Score (3 Year Range Pct): | 42.8 | 52.8 | 56.5 |
| – Strength Index Reading (3 Year Range): | Bearish | Bullish | Bullish |
| NET POSITION MOVEMENT INDEX: | |||
| – 6-Week Change in Strength Index: | 4.2 | -9.9 | 14.8 |
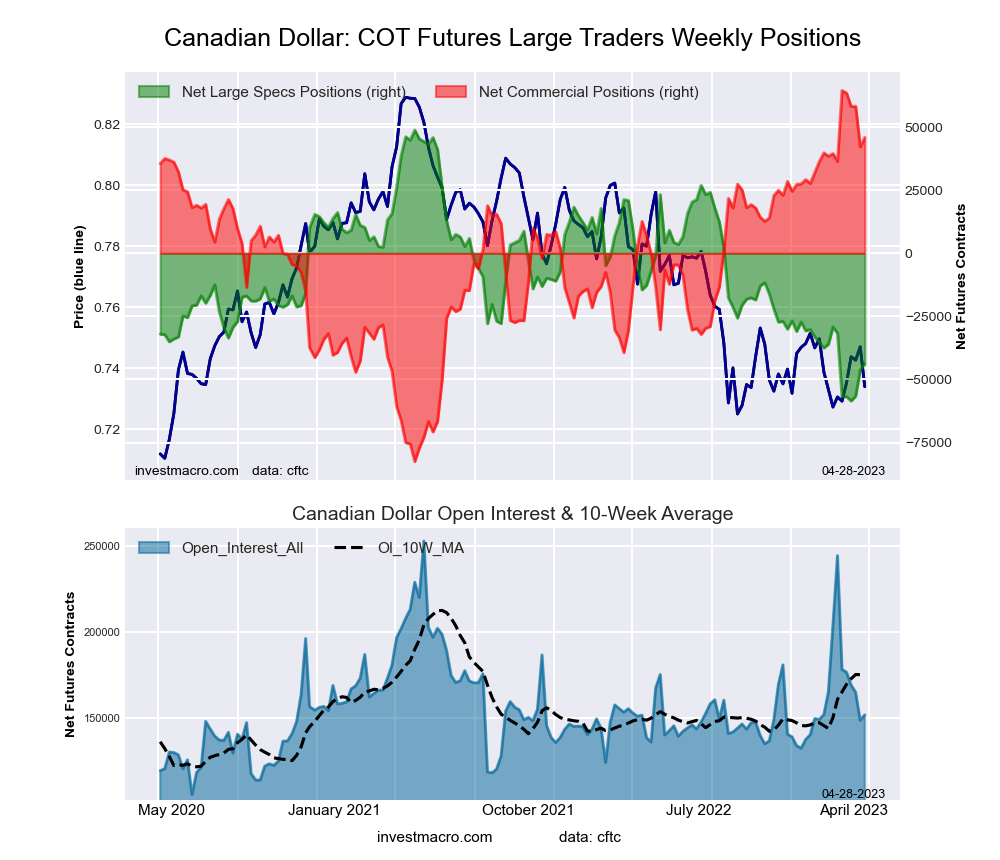
Canadian Dollar Futures:
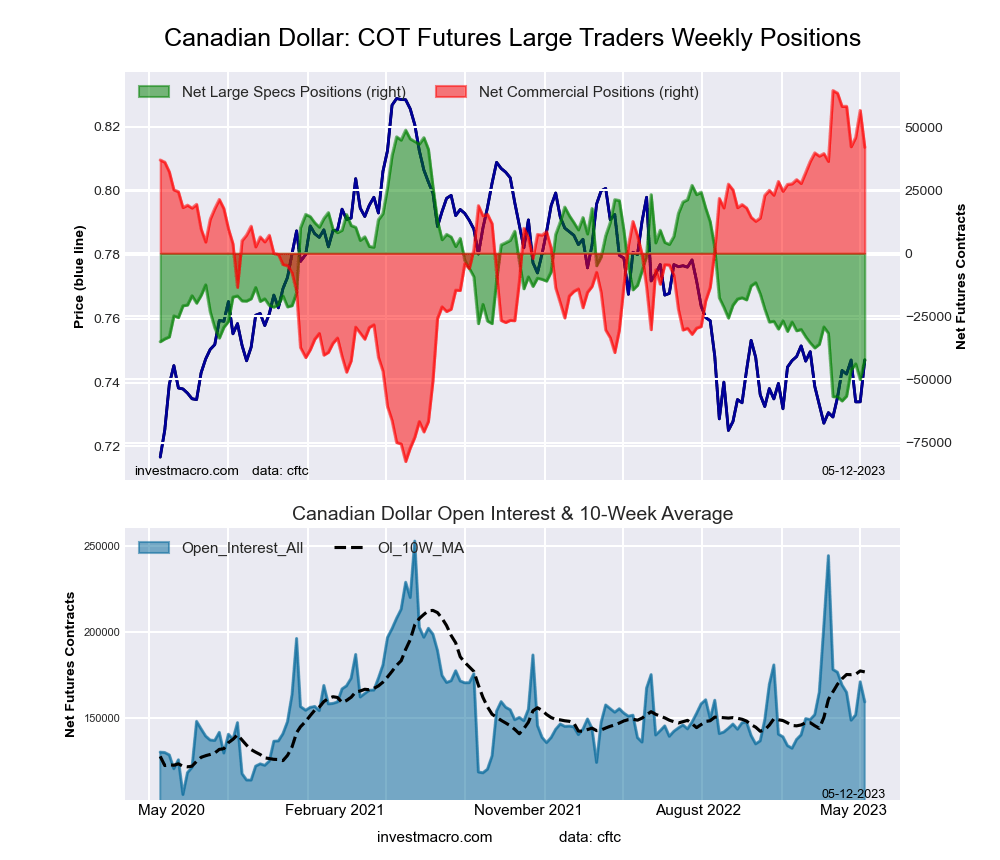 The Canadian Dollar large speculator standing this week resulted in a net position of -42,263 contracts in the data reported through Tuesday. This was a weekly gain of 7,833 contracts from the previous week which had a total of -50,096 net contracts.
This week’s current strength score (the trader positioning range over the past three years, measured from 0 to 100) shows the speculators are currently Bearish-Extreme with a score of 15.1 percent. The commercials are Bullish-Extreme with a score of 84.7 percent and the small traders (not shown in chart) are Bearish with a score of 23.5 percent.
| CANADIAN DOLLAR Statistics | SPECULATORS | COMMERCIALS | SMALL TRADERS |
| – Percent of Open Interest Longs: | 18.6 | 59.4 | 19.6 |
| – Percent of Open Interest Shorts: | 45.1 | 33.1 | 19.4 |
| – Net Position: | -42,263 | 41,957 | 306 |
| – Gross Longs: | 29,609 | 94,662 | 31,226 |
| – Gross Shorts: | 71,872 | 52,705 | 30,920 |
| – Long to Short Ratio: | 0.4 to 1 | 1.8 to 1 | 1.0 to 1 |
| NET POSITION TREND: | |||
| – Strength Index Score (3 Year Range Pct): | 15.1 | 84.7 | 23.5 |
| – Strength Index Reading (3 Year Range): | Bearish-Extreme | Bullish-Extreme | Bearish |
| NET POSITION MOVEMENT INDEX: | |||
| – 6-Week Change in Strength Index: | 13.6 | -14.6 | 15.3 |
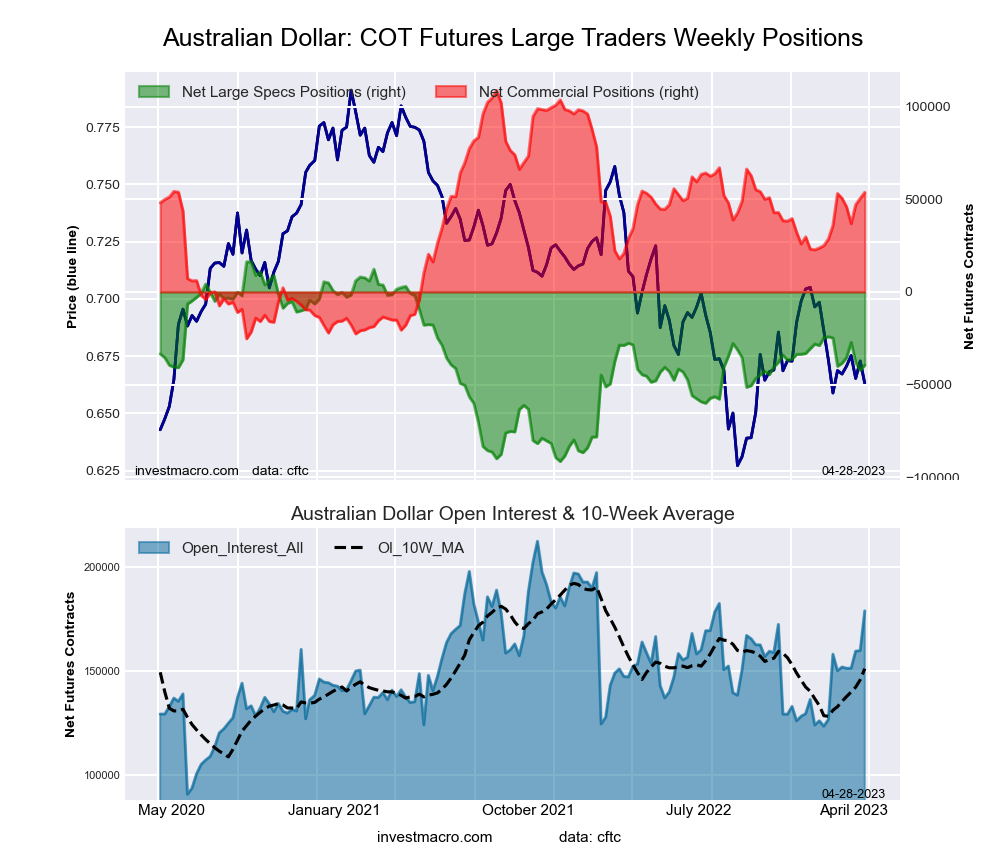
Australian Dollar Futures:
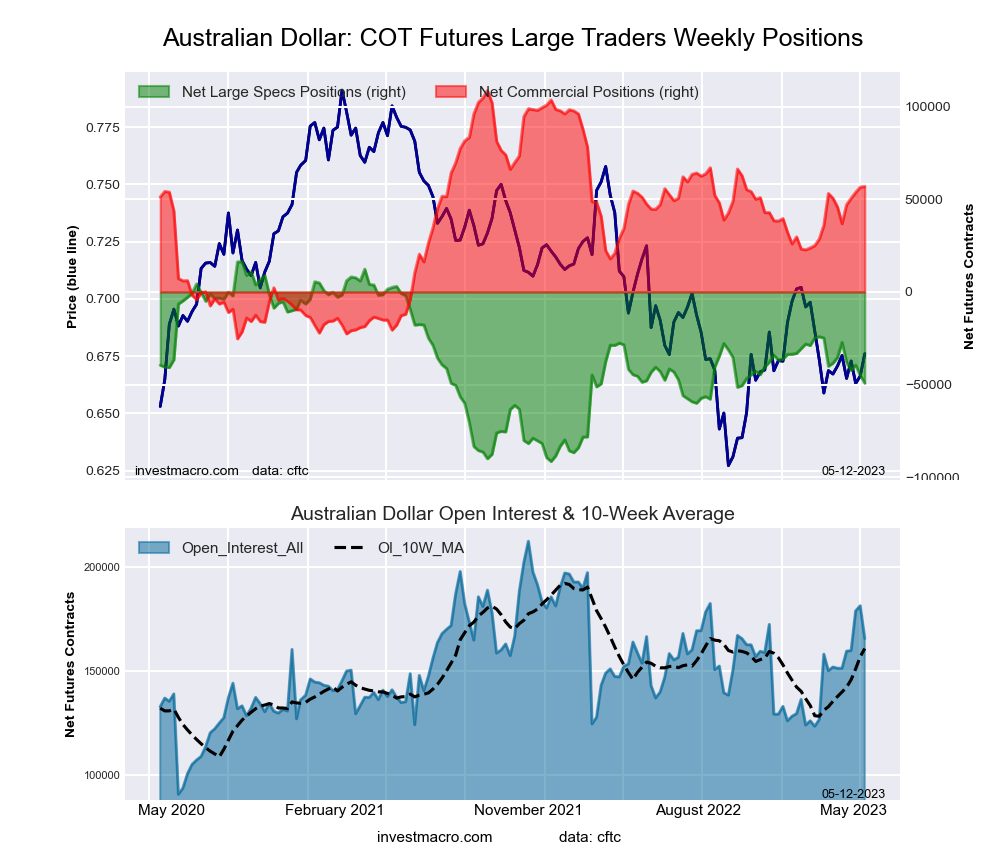 The Australian Dollar large speculator standing this week resulted in a net position of -49,193 contracts in the data reported through Tuesday. This was a weekly lowering of -4,183 contracts from the previous week which had a total of -45,010 net contracts.
This week’s current strength score (the trader positioning range over the past three years, measured from 0 to 100) shows the speculators are currently Bearish with a score of 39.2 percent. The commercials are Bullish with a score of 61.3 percent and the small traders (not shown in chart) are Bearish with a score of 33.6 percent.
| AUSTRALIAN DOLLAR Statistics | SPECULATORS | COMMERCIALS | SMALL TRADERS |
| – Percent of Open Interest Longs: | 24.9 | 59.6 | 11.7 |
| – Percent of Open Interest Shorts: | 54.6 | 25.3 | 16.4 |
| – Net Position: | -49,193 | 56,897 | -7,704 |
| – Gross Longs: | 41,225 | 98,698 | 19,371 |
| – Gross Shorts: | 90,418 | 41,801 | 27,075 |
| – Long to Short Ratio: | 0.5 to 1 | 2.4 to 1 | 0.7 to 1 |
| NET POSITION TREND: | |||
| – Strength Index Score (3 Year Range Pct): | 39.2 | 61.3 | 33.6 |
| – Strength Index Reading (3 Year Range): | Bearish | Bullish | Bearish |
| NET POSITION MOVEMENT INDEX: | |||
| – 6-Week Change in Strength Index: | -12.8 | 8.3 | 6.8 |
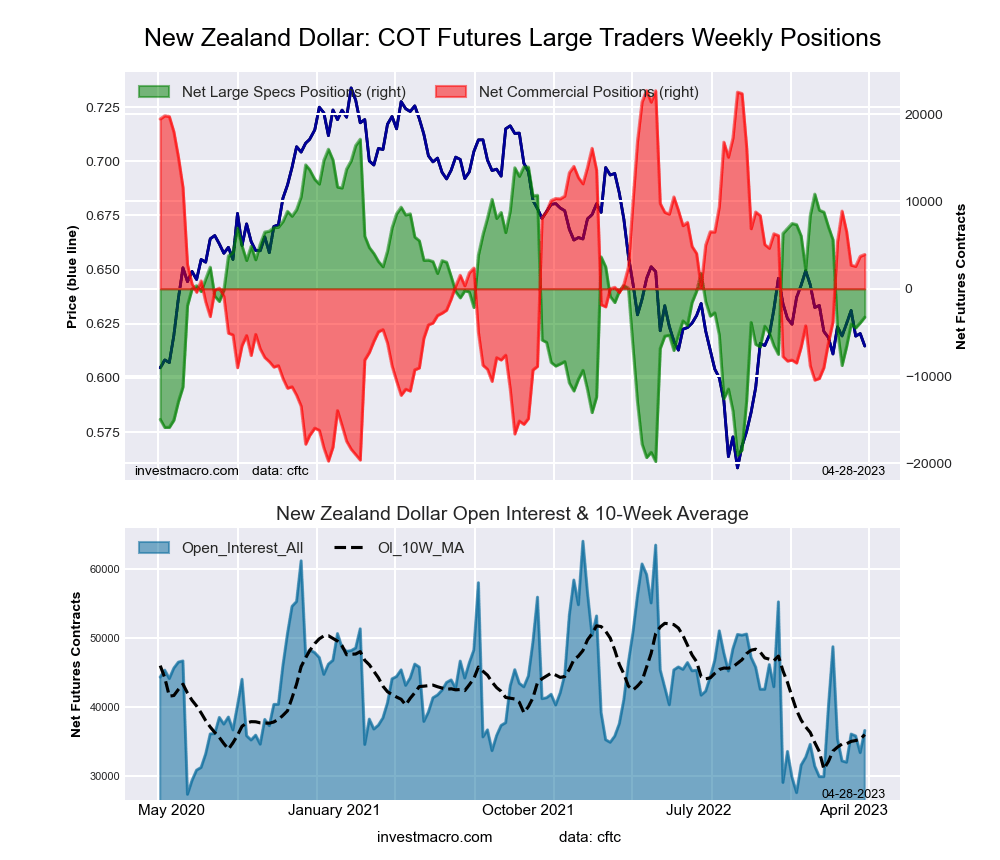
New Zealand Dollar Futures:
 The New Zealand Dollar large speculator standing this week resulted in a net position of -4,581 contracts in the data reported through Tuesday. This was a weekly decrease of -2,664 contracts from the previous week which had a total of -1,917 net contracts.
This week’s current strength score (the trader positioning range over the past three years, measured from 0 to 100) shows the speculators are currently Bearish with a score of 41.2 percent. The commercials are Bullish with a score of 56.6 percent and the small traders (not shown in chart) are Bullish with a score of 53.5 percent.
| NEW ZEALAND DOLLAR Statistics | SPECULATORS | COMMERCIALS | SMALL TRADERS |
| – Percent of Open Interest Longs: | 42.0 | 48.6 | 8.9 |
| – Percent of Open Interest Shorts: | 53.0 | 38.3 | 8.1 |
| – Net Position: | -4,581 | 4,283 | 298 |
| – Gross Longs: | 17,461 | 20,224 | 3,681 |
| – Gross Shorts: | 22,042 | 15,941 | 3,383 |
| – Long to Short Ratio: | 0.8 to 1 | 1.3 to 1 | 1.1 to 1 |
| NET POSITION TREND: | |||
| – Strength Index Score (3 Year Range Pct): | 41.2 | 56.6 | 53.5 |
| – Strength Index Reading (3 Year Range): | Bearish | Bullish | Bullish |
| NET POSITION MOVEMENT INDEX: | |||
| – 6-Week Change in Strength Index: | 5.5 | -5.4 | 2.9 |
Mexican Peso Futures:
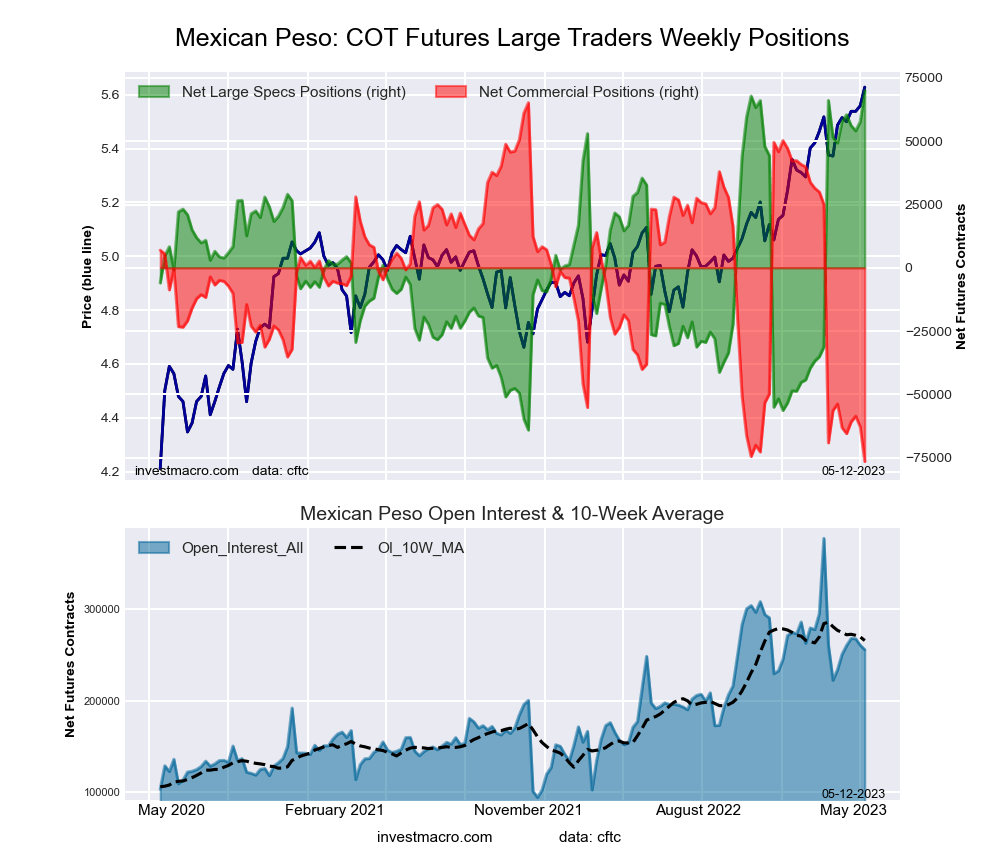 The Mexican Peso large speculator standing this week resulted in a net position of 70,032 contracts in the data reported through Tuesday. This was a weekly boost of 12,322 contracts from the previous week which had a total of 57,710 net contracts.
This week’s current strength score (the trader positioning range over the past three years, measured from 0 to 100) shows the speculators are currently Bullish-Extreme with a score of 100.0 percent. The commercials are Bearish-Extreme with a score of 0.0 percent and the small traders (not shown in chart) are Bullish-Extreme with a score of 95.8 percent.
| MEXICAN PESO Statistics | SPECULATORS | COMMERCIALS | SMALL TRADERS |
| – Percent of Open Interest Longs: | 50.0 | 46.2 | 3.5 |
| – Percent of Open Interest Shorts: | 22.6 | 76.1 | 0.9 |
| – Net Position: | 70,032 | -76,533 | 6,501 |
| – Gross Longs: | 127,763 | 117,890 | 8,859 |
| – Gross Shorts: | 57,731 | 194,423 | 2,358 |
| – Long to Short Ratio: | 2.2 to 1 | 0.6 to 1 | 3.8 to 1 |
| NET POSITION TREND: | |||
| – Strength Index Score (3 Year Range Pct): | 100.0 | 0.0 | 95.8 |
| – Strength Index Reading (3 Year Range): | Bullish-Extreme | Bearish-Extreme | Bullish-Extreme |
| NET POSITION MOVEMENT INDEX: | |||
| – 6-Week Change in Strength Index: | 15.5 | -16.0 | 11.2 |
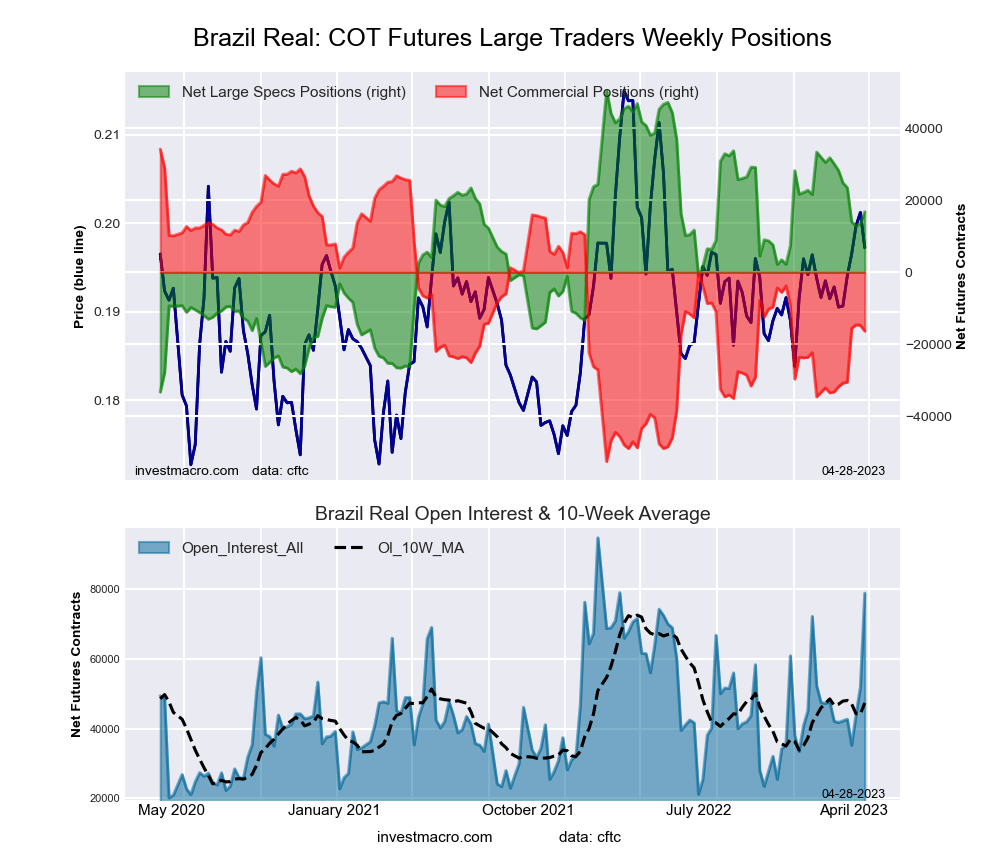
Brazilian Real Futures:
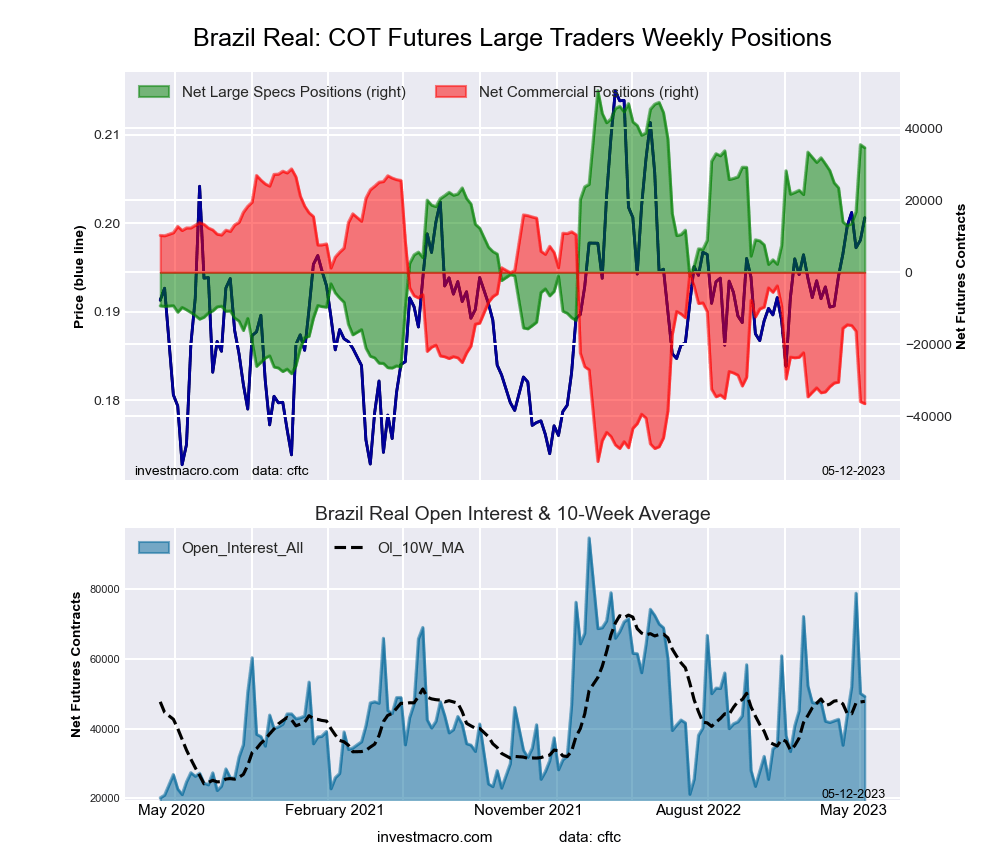 The Brazilian Real large speculator standing this week resulted in a net position of 34,594 contracts in the data reported through Tuesday. This was a weekly decrease of -867 contracts from the previous week which had a total of 35,461 net contracts.
This week’s current strength score (the trader positioning range over the past three years, measured from 0 to 100) shows the speculators are currently Bullish with a score of 79.8 percent. The commercials are Bearish-Extreme with a score of 19.8 percent and the small traders (not shown in chart) are Bullish with a score of 59.2 percent.
| BRAZIL REAL Statistics | SPECULATORS | COMMERCIALS | SMALL TRADERS |
| – Percent of Open Interest Longs: | 77.6 | 14.4 | 7.8 |
| – Percent of Open Interest Shorts: | 7.3 | 88.6 | 3.9 |
| – Net Position: | 34,594 | -36,504 | 1,910 |
| – Gross Longs: | 38,196 | 7,097 | 3,841 |
| – Gross Shorts: | 3,602 | 43,601 | 1,931 |
| – Long to Short Ratio: | 10.6 to 1 | 0.2 to 1 | 2.0 to 1 |
| NET POSITION TREND: | |||
| – Strength Index Score (3 Year Range Pct): | 79.8 | 19.8 | 59.2 |
| – Strength Index Reading (3 Year Range): | Bullish | Bearish-Extreme | Bullish |
| NET POSITION MOVEMENT INDEX: | |||
| – 6-Week Change in Strength Index: | 14.1 | -7.4 | -40.8 |
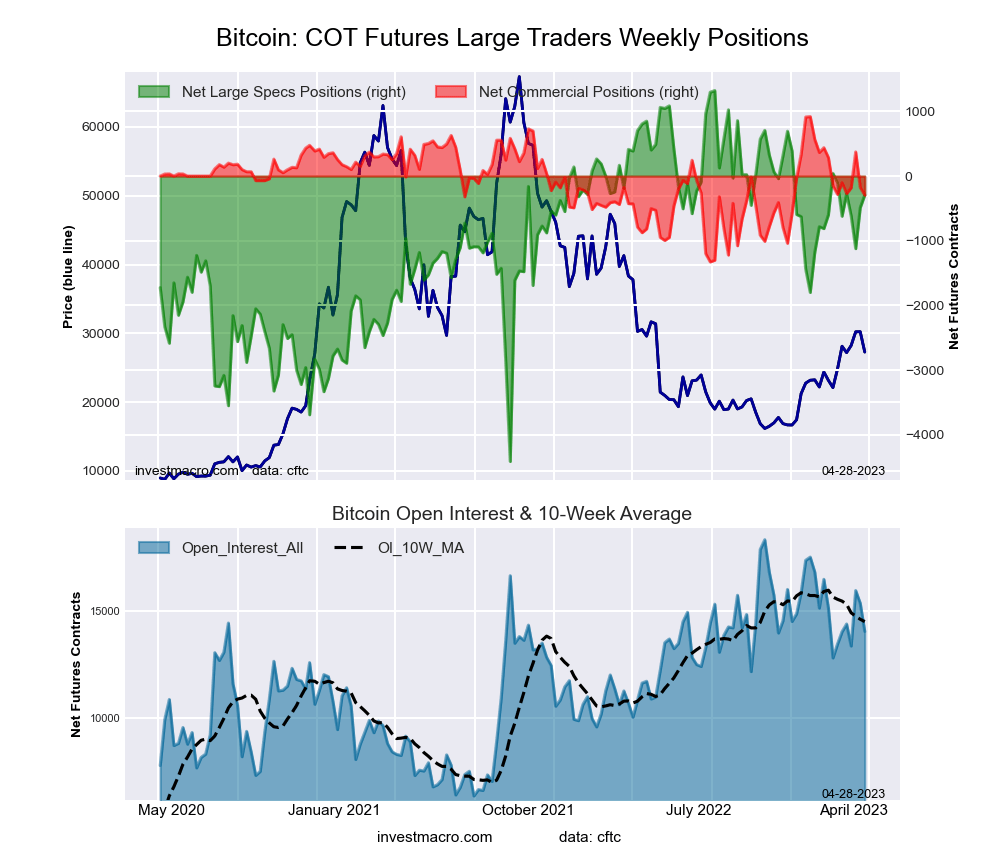
Bitcoin Futures:
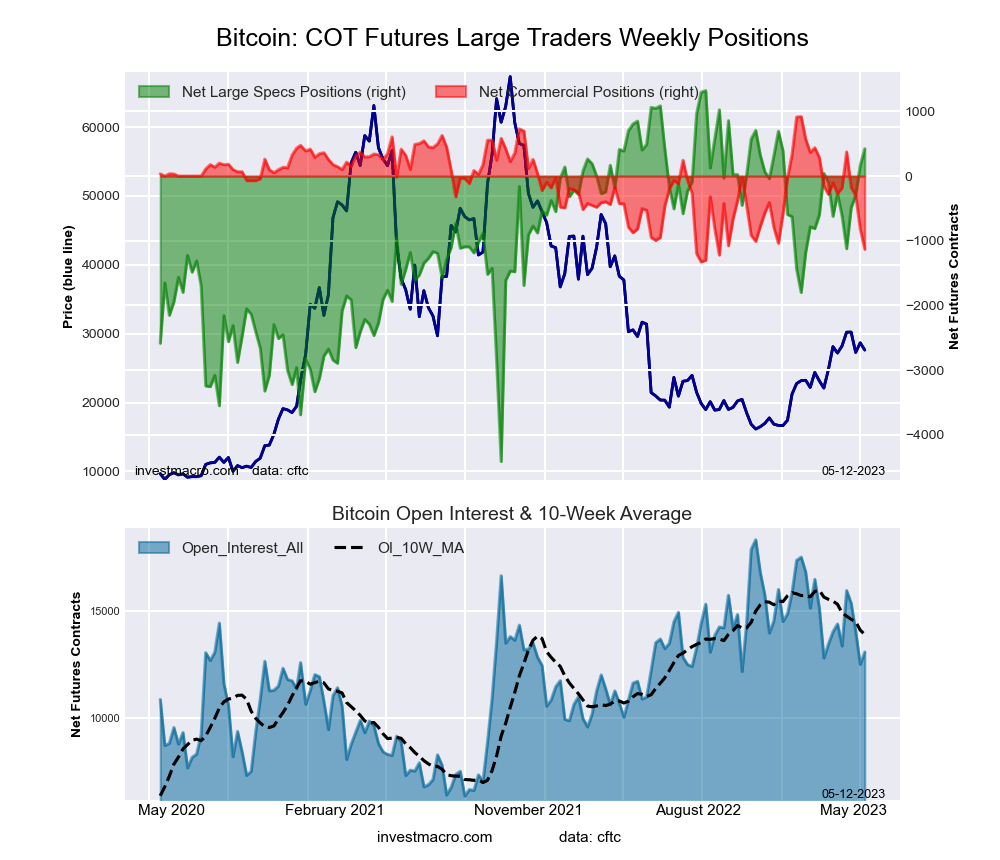 The Bitcoin large speculator standing this week resulted in a net position of 423 contracts in the data reported through Tuesday. This was a weekly rise of 255 contracts from the previous week which had a total of 168 net contracts.
This week’s current strength score (the trader positioning range over the past three years, measured from 0 to 100) shows the speculators are currently Bullish-Extreme with a score of 84.3 percent. The commercials are Bearish-Extreme with a score of 8.7 percent and the small traders (not shown in chart) are Bearish with a score of 29.0 percent.
| BITCOIN Statistics | SPECULATORS | COMMERCIALS | SMALL TRADERS |
| – Percent of Open Interest Longs: | 76.5 | 1.8 | 10.2 |
| – Percent of Open Interest Shorts: | 73.3 | 10.4 | 4.8 |
| – Net Position: | 423 | -1,131 | 708 |
| – Gross Longs: | 10,027 | 233 | 1,334 |
| – Gross Shorts: | 9,604 | 1,364 | 626 |
| – Long to Short Ratio: | 1.0 to 1 | 0.2 to 1 | 2.1 to 1 |
| NET POSITION TREND: | |||
| – Strength Index Score (3 Year Range Pct): | 84.3 | 8.7 | 29.0 |
| – Strength Index Reading (3 Year Range): | Bullish-Extreme | Bearish-Extreme | Bearish |
| NET POSITION MOVEMENT INDEX: | |||
| – 6-Week Change in Strength Index: | 12.2 | -38.3 | 3.7 |
Article By InvestMacro – Receive our weekly COT Newsletter
*COT Report: The COT data, released weekly to the public each Friday, is updated through the most recent Tuesday (data is 3 days old) and shows a quick view of how large speculators or non-commercials (for-profit traders) were positioned in the futures markets.
The CFTC categorizes trader positions according to commercial hedgers (traders who use futures contracts for hedging as part of the business), non-commercials (large traders who speculate to realize trading profits) and nonreportable traders (usually small traders/speculators) as well as their open interest (contracts open in the market at time of reporting). See CFTC criteria here.


