
By InvestMacro

Here are the latest charts and statistics for the Commitment of Traders (COT) data published by the Commodities Futures Trading Commission (CFTC).
The latest COT data is updated through Tuesday July 25th and shows a quick view of how large traders (for-profit speculators and commercial entities) were positioned in the futures markets.
Weekly Speculator Changes led by DowJones-Mini & S&P500-Mini
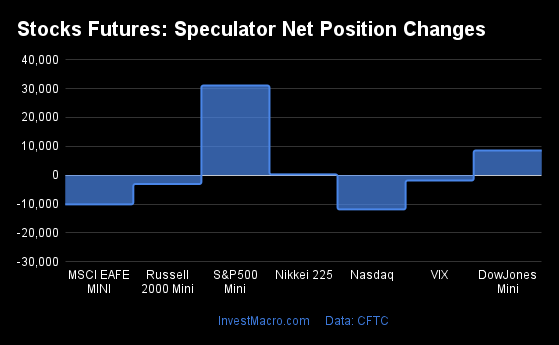
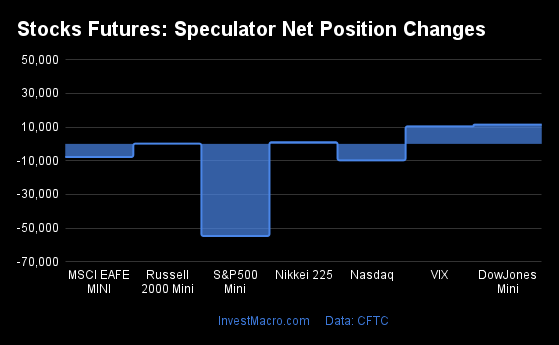
The COT stock markets speculator bets were lower this week as three out of the seven stock markets we cover had higher positioning while the other four markets had lower speculator contracts.
Leading the gains for the stock markets was the S&P500-Mini (31,070 contracts) with the DowJones-Mini (8,557 contracts) and the Nikkei 225 (265 contracts) also showing positive weeks.
The markets with the declines in speculator bets this week were the MSCI EAFE-Mini (-10,114 contracts) with the Nasdaq-Mini (-11,871 contracts), VIX (-1,853 contracts) and Russell-Mini (-3,067 contracts) also registering lower bets on the week.
| Jul-25-2023 | OI | OI-Index | Spec-Net | Spec-Index | Com-Net | COM-Index | Smalls-Net | Smalls-Index |
|---|---|---|---|---|---|---|---|---|
| S&P500-Mini | 2,243,361 | 24 | -232,615 | 30 | 215,413 | 70 | 17,202 | 50 |
| Nikkei 225 | 16,314 | 17 | -2,599 | 52 | 1,803 | 47 | 796 | 38 |
| Nasdaq-Mini | 260,623 | 37 | -10,672 | 71 | 7,629 | 28 | 3,043 | 59 |
| DowJones-Mini | 111,965 | 84 | 1,416 | 78 | 234 | 34 | -1,650 | 36 |
| VIX | 397,695 | 71 | -42,142 | 89 | 46,392 | 9 | -4,250 | 74 |
| Nikkei 225 Yen | 51,636 | 38 | 9,187 | 62 | 15,906 | 54 | -25,093 | 26 |
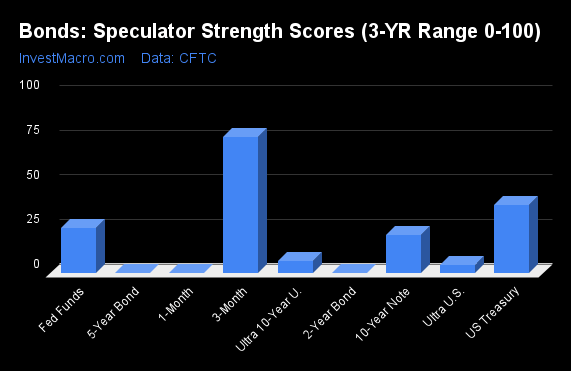
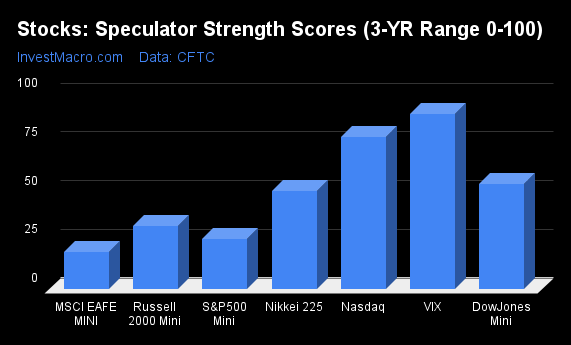
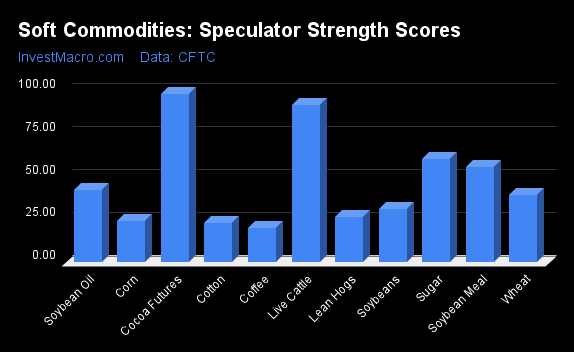
Strength Scores led by VIX & DowJones-Mini

COT Strength Scores (a normalized measure of Speculator positions over a 3-Year range, from 0 to 100 where above 80 is Extreme-Bullish and below 20 is Extreme-Bearish) showed that the VIX (89 percent) and the DowJones-Mini (78 percent) lead the stock markets this week. The Nasdaq-Mini (71 percent) comes in as the next highest in the weekly strength scores.
On the downside, the MSCI EAFE-Mini (6 percent) comes in at the lowest strength level currently and is in Extreme-Bearish territory (below 20 percent). The next lowest strength score is the S&P500-Mini (30 percent).
Strength Statistics:
VIX (88.7 percent) vs VIX previous week (90.1 percent)
S&P500-Mini (30.1 percent) vs S&P500-Mini previous week (25.4 percent)
DowJones-Mini (77.9 percent) vs DowJones-Mini previous week (53.7 percent)
Nasdaq-Mini (71.1 percent) vs Nasdaq-Mini previous week (77.9 percent)
Russell2000-Mini (30.7 percent) vs Russell2000-Mini previous week (32.5 percent)
Nikkei USD (52.1 percent) vs Nikkei USD previous week (50.4 percent)
EAFE-Mini (6.4 percent) vs EAFE-Mini previous week (18.8 percent)
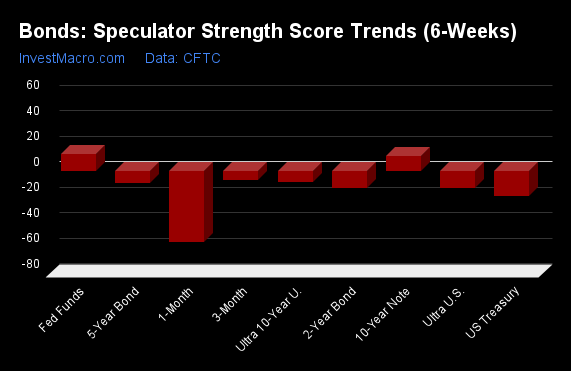
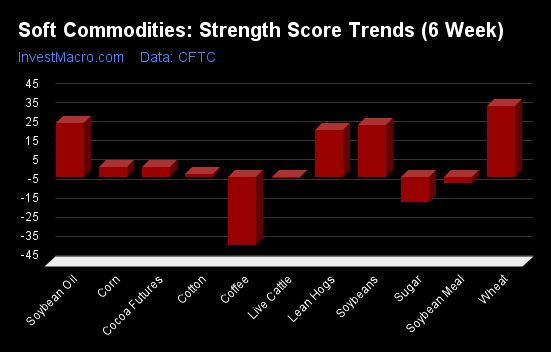
DowJones-Mini & Nikkei 225 top the 6-Week Strength Trends
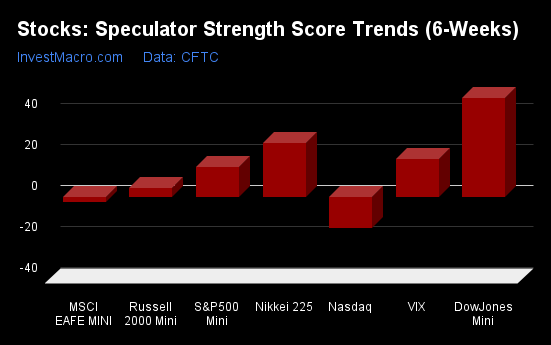
COT Strength Score Trends (or move index, calculates the 6-week changes in strength scores) showed that the DowJones-Mini (48 percent) leads the past six weeks trends for the stock markets. The Nikkei 225 (26 percent), the VIX (19 percent) and the S&P500-Mini (15 percent) are the next highest positive movers in the latest trends data.
The Nasdaq-Mini (-15 percent) leads the downside trend scores currently with the EAFE-Mini (-3 percent) coming in as the next market with lower trend scores.
Strength Trend Statistics:
VIX (18.5 percent) vs VIX previous week (12.8 percent)
S&P500-Mini (14.7 percent) vs S&P500-Mini previous week (12.1 percent)
DowJones-Mini (48.1 percent) vs DowJones-Mini previous week (44.2 percent)
Nasdaq-Mini (-15.1 percent) vs Nasdaq-Mini previous week (-4.4 percent)
Russell2000-Mini (4.3 percent) vs Russell2000-Mini previous week (-1.9 percent)
Nikkei USD (26.2 percent) vs Nikkei USD previous week (28.8 percent)
EAFE-Mini (-2.8 percent) vs EAFE-Mini previous week (-1.9 percent)
Individual Stock Market Charts:
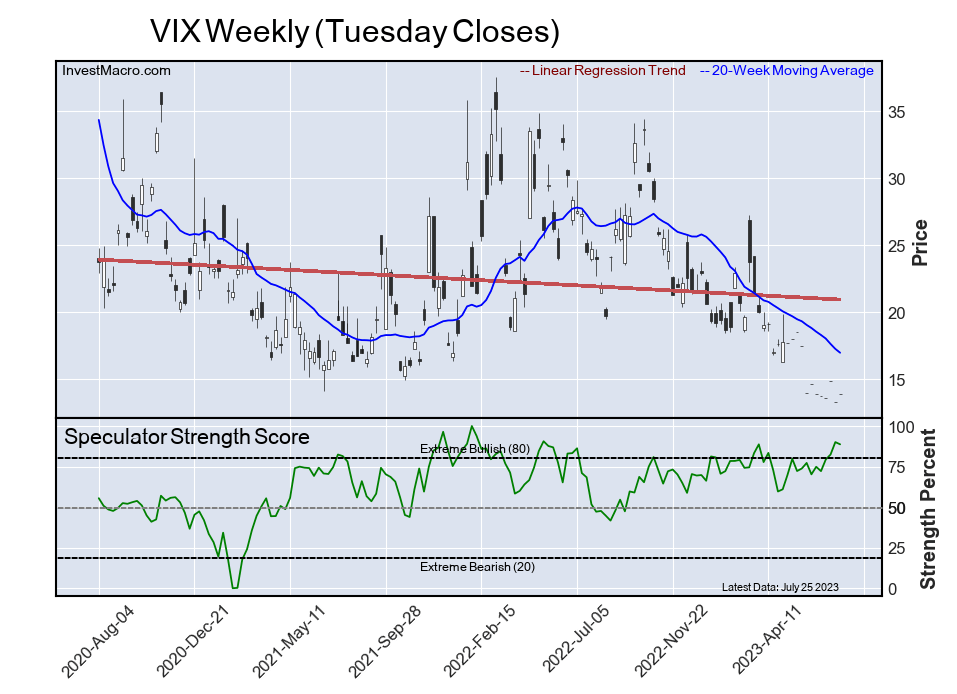
VIX Volatility Futures:
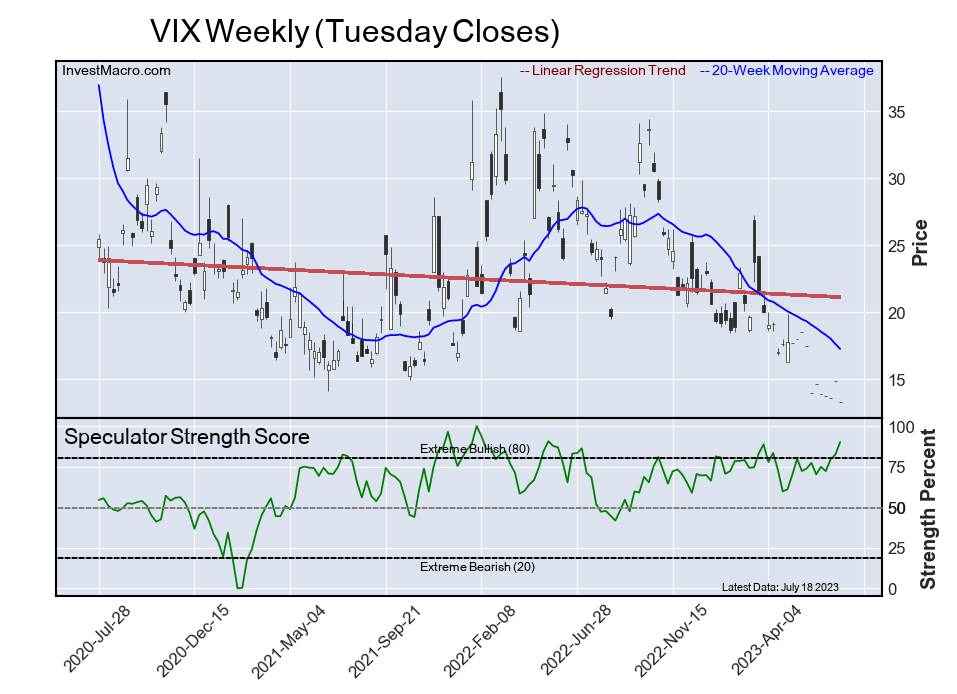
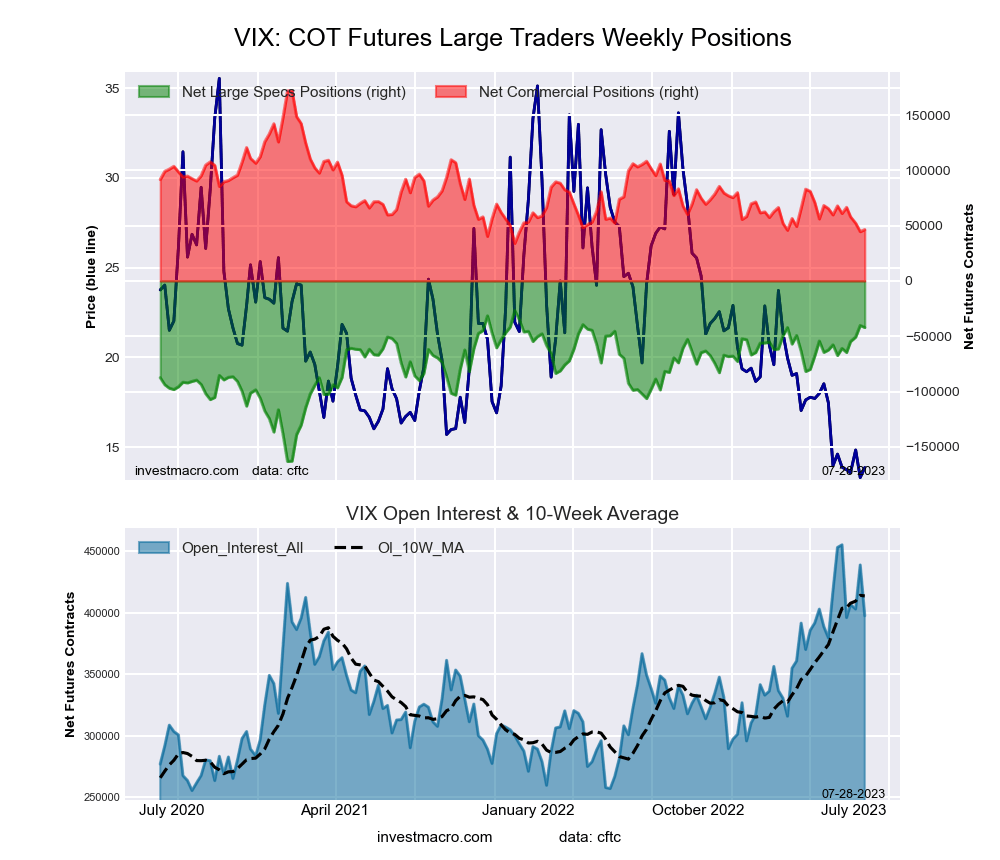 The VIX Volatility large speculator standing this week totaled a net position of -42,142 contracts in the data reported through Tuesday. This was a weekly decrease of -1,853 contracts from the previous week which had a total of -40,289 net contracts.
This week’s current strength score (the trader positioning range over the past three years, measured from 0 to 100) shows the speculators are currently Bullish-Extreme with a score of 88.7 percent. The commercials are Bearish-Extreme with a score of 9.0 percent and the small traders (not shown in chart) are Bullish with a score of 74.2 percent.
Price Trend-Following Model: Downtrend
Our weekly trend-following model classifies the current market price position as: Downtrend. The current action for the model is considered to be: Hold – Maintain Short Position.
| VIX Volatility Futures Statistics | SPECULATORS | COMMERCIALS | SMALL TRADERS |
| – Percent of Open Interest Longs: | 24.7 | 46.2 | 6.0 |
| – Percent of Open Interest Shorts: | 35.3 | 34.5 | 7.0 |
| – Net Position: | -42,142 | 46,392 | -4,250 |
| – Gross Longs: | 98,339 | 183,709 | 23,761 |
| – Gross Shorts: | 140,481 | 137,317 | 28,011 |
| – Long to Short Ratio: | 0.7 to 1 | 1.3 to 1 | 0.8 to 1 |
| NET POSITION TREND: | |||
| – Strength Index Score (3 Year Range Pct): | 88.7 | 9.0 | 74.2 |
| – Strength Index Reading (3 Year Range): | Bullish-Extreme | Bearish-Extreme | Bullish |
| NET POSITION MOVEMENT INDEX: | |||
| – 6-Week Change in Strength Index: | 18.5 | -15.5 | -19.3 |
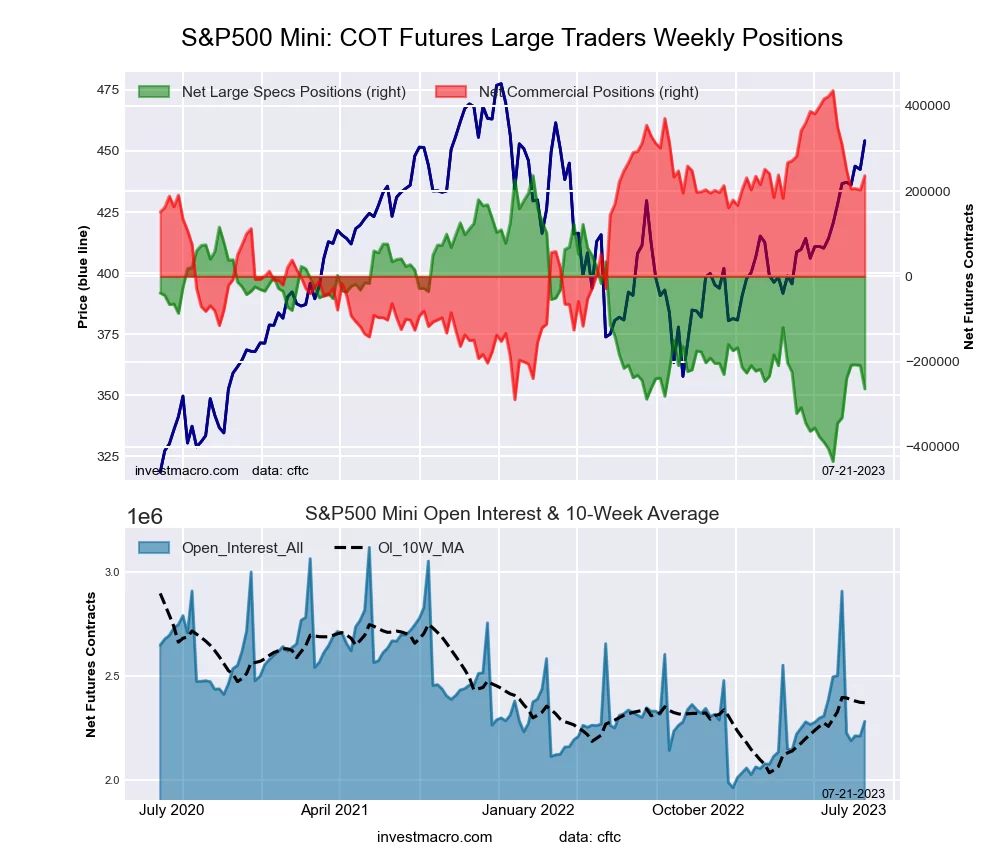
S&P500 Mini Futures:
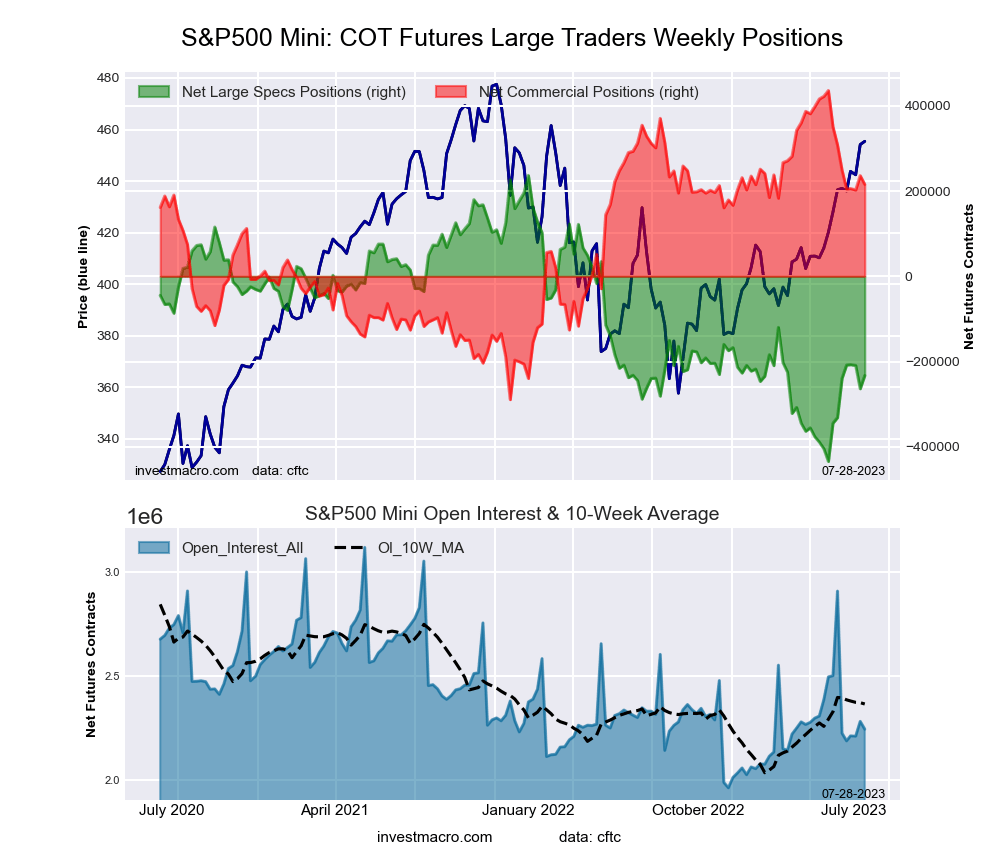 The S&P500 Mini large speculator standing this week totaled a net position of -232,615 contracts in the data reported through Tuesday. This was a weekly increase of 31,070 contracts from the previous week which had a total of -263,685 net contracts.
This week’s current strength score (the trader positioning range over the past three years, measured from 0 to 100) shows the speculators are currently Bearish with a score of 30.1 percent. The commercials are Bullish with a score of 69.6 percent and the small traders (not shown in chart) are Bullish with a score of 50.3 percent.
Price Trend-Following Model: Strong Uptrend
Our weekly trend-following model classifies the current market price position as: Strong Uptrend. The current action for the model is considered to be: Hold – Maintain Long Position.
| S&P500 Mini Futures Statistics | SPECULATORS | COMMERCIALS | SMALL TRADERS |
| – Percent of Open Interest Longs: | 10.6 | 75.4 | 11.5 |
| – Percent of Open Interest Shorts: | 21.0 | 65.8 | 10.8 |
| – Net Position: | -232,615 | 215,413 | 17,202 |
| – Gross Longs: | 238,333 | 1,692,161 | 258,370 |
| – Gross Shorts: | 470,948 | 1,476,748 | 241,168 |
| – Long to Short Ratio: | 0.5 to 1 | 1.1 to 1 | 1.1 to 1 |
| NET POSITION TREND: | |||
| – Strength Index Score (3 Year Range Pct): | 30.1 | 69.6 | 50.3 |
| – Strength Index Reading (3 Year Range): | Bearish | Bullish | Bullish |
| NET POSITION MOVEMENT INDEX: | |||
| – 6-Week Change in Strength Index: | 14.7 | -12.8 | -2.2 |
Dow Jones Mini Futures:
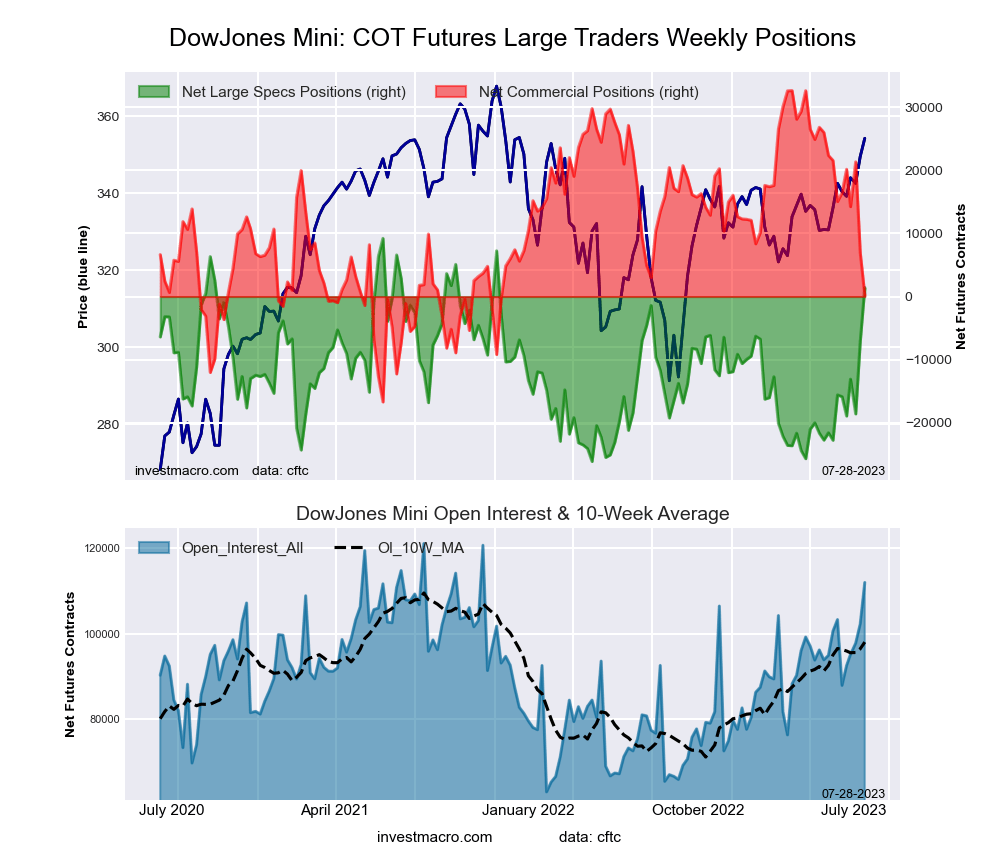 The Dow Jones Mini large speculator standing this week totaled a net position of 1,416 contracts in the data reported through Tuesday. This was a weekly gain of 8,557 contracts from the previous week which had a total of -7,141 net contracts.
This week’s current strength score (the trader positioning range over the past three years, measured from 0 to 100) shows the speculators are currently Bullish with a score of 77.9 percent. The commercials are Bearish with a score of 34.3 percent and the small traders (not shown in chart) are Bearish with a score of 35.8 percent.
Price Trend-Following Model: Strong Uptrend
Our weekly trend-following model classifies the current market price position as: Strong Uptrend. The current action for the model is considered to be: Hold – Maintain Long Position.
| Dow Jones Mini Futures Statistics | SPECULATORS | COMMERCIALS | SMALL TRADERS |
| – Percent of Open Interest Longs: | 31.7 | 51.0 | 12.7 |
| – Percent of Open Interest Shorts: | 30.4 | 50.8 | 14.2 |
| – Net Position: | 1,416 | 234 | -1,650 |
| – Gross Longs: | 35,445 | 57,124 | 14,218 |
| – Gross Shorts: | 34,029 | 56,890 | 15,868 |
| – Long to Short Ratio: | 1.0 to 1 | 1.0 to 1 | 0.9 to 1 |
| NET POSITION TREND: | |||
| – Strength Index Score (3 Year Range Pct): | 77.9 | 34.3 | 35.8 |
| – Strength Index Reading (3 Year Range): | Bullish | Bearish | Bearish |
| NET POSITION MOVEMENT INDEX: | |||
| – 6-Week Change in Strength Index: | 48.1 | -30.0 | -10.6 |
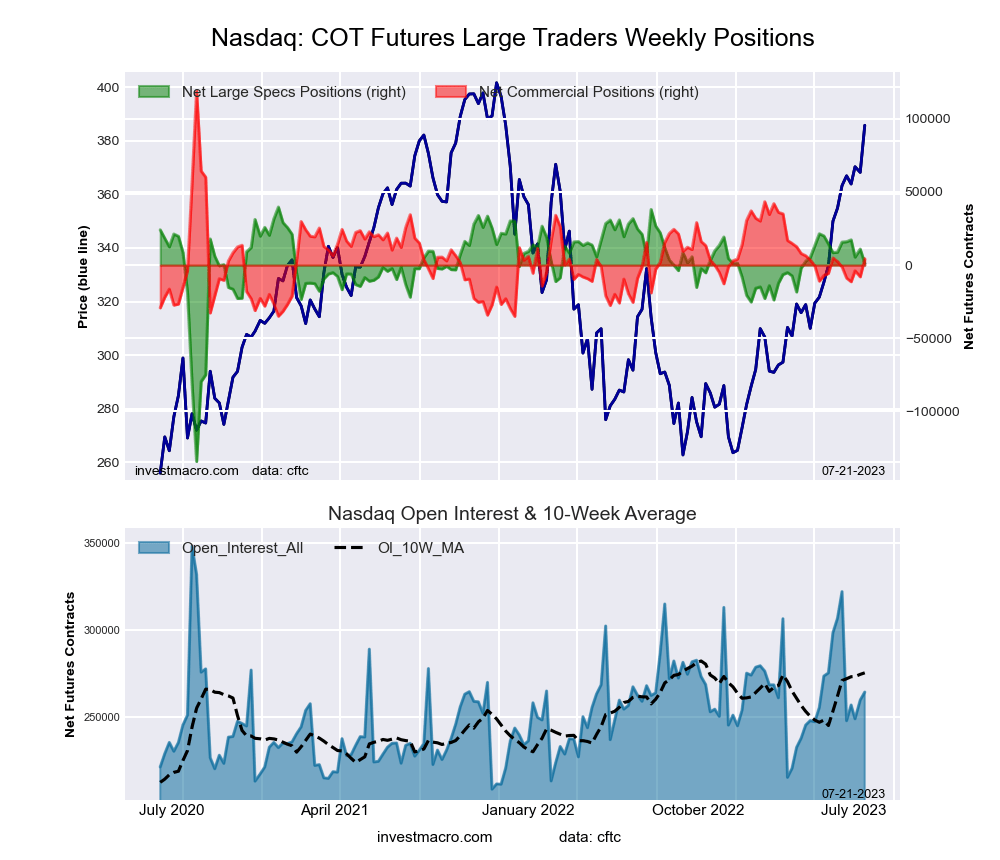
Nasdaq Mini Futures:
 The Nasdaq Mini large speculator standing this week totaled a net position of -10,672 contracts in the data reported through Tuesday. This was a weekly lowering of -11,871 contracts from the previous week which had a total of 1,199 net contracts.
This week’s current strength score (the trader positioning range over the past three years, measured from 0 to 100) shows the speculators are currently Bullish with a score of 71.1 percent. The commercials are Bearish with a score of 27.6 percent and the small traders (not shown in chart) are Bullish with a score of 59.0 percent.
Price Trend-Following Model: Uptrend
Our weekly trend-following model classifies the current market price position as: Uptrend. The current action for the model is considered to be: Hold – Maintain Long Position.
| Nasdaq Mini Futures Statistics | SPECULATORS | COMMERCIALS | SMALL TRADERS |
| – Percent of Open Interest Longs: | 25.4 | 56.2 | 16.3 |
| – Percent of Open Interest Shorts: | 29.5 | 53.3 | 15.1 |
| – Net Position: | -10,672 | 7,629 | 3,043 |
| – Gross Longs: | 66,261 | 146,469 | 42,387 |
| – Gross Shorts: | 76,933 | 138,840 | 39,344 |
| – Long to Short Ratio: | 0.9 to 1 | 1.1 to 1 | 1.1 to 1 |
| NET POSITION TREND: | |||
| – Strength Index Score (3 Year Range Pct): | 71.1 | 27.6 | 59.0 |
| – Strength Index Reading (3 Year Range): | Bullish | Bearish | Bullish |
| NET POSITION MOVEMENT INDEX: | |||
| – 6-Week Change in Strength Index: | -15.1 | 5.8 | 32.6 |
Russell 2000 Mini Futures:
 The Russell 2000 Mini large speculator standing this week totaled a net position of -68,769 contracts in the data reported through Tuesday. This was a weekly decline of -3,067 contracts from the previous week which had a total of -65,702 net contracts.
This week’s current strength score (the trader positioning range over the past three years, measured from 0 to 100) shows the speculators are currently Bearish with a score of 30.7 percent. The commercials are Bullish with a score of 66.2 percent and the small traders (not shown in chart) are Bearish with a score of 42.4 percent.
Price Trend-Following Model: Strong Uptrend
Our weekly trend-following model classifies the current market price position as: Strong Uptrend. The current action for the model is considered to be: Hold – Maintain Long Position.
| Russell 2000 Mini Futures Statistics | SPECULATORS | COMMERCIALS | SMALL TRADERS |
| – Percent of Open Interest Longs: | 10.4 | 82.3 | 5.8 |
| – Percent of Open Interest Shorts: | 23.5 | 70.2 | 4.9 |
| – Net Position: | -68,769 | 63,644 | 5,125 |
| – Gross Longs: | 54,699 | 433,206 | 30,730 |
| – Gross Shorts: | 123,468 | 369,562 | 25,605 |
| – Long to Short Ratio: | 0.4 to 1 | 1.2 to 1 | 1.2 to 1 |
| NET POSITION TREND: | |||
| – Strength Index Score (3 Year Range Pct): | 30.7 | 66.2 | 42.4 |
| – Strength Index Reading (3 Year Range): | Bearish | Bullish | Bearish |
| NET POSITION MOVEMENT INDEX: | |||
| – 6-Week Change in Strength Index: | 4.3 | -3.9 | -0.4 |
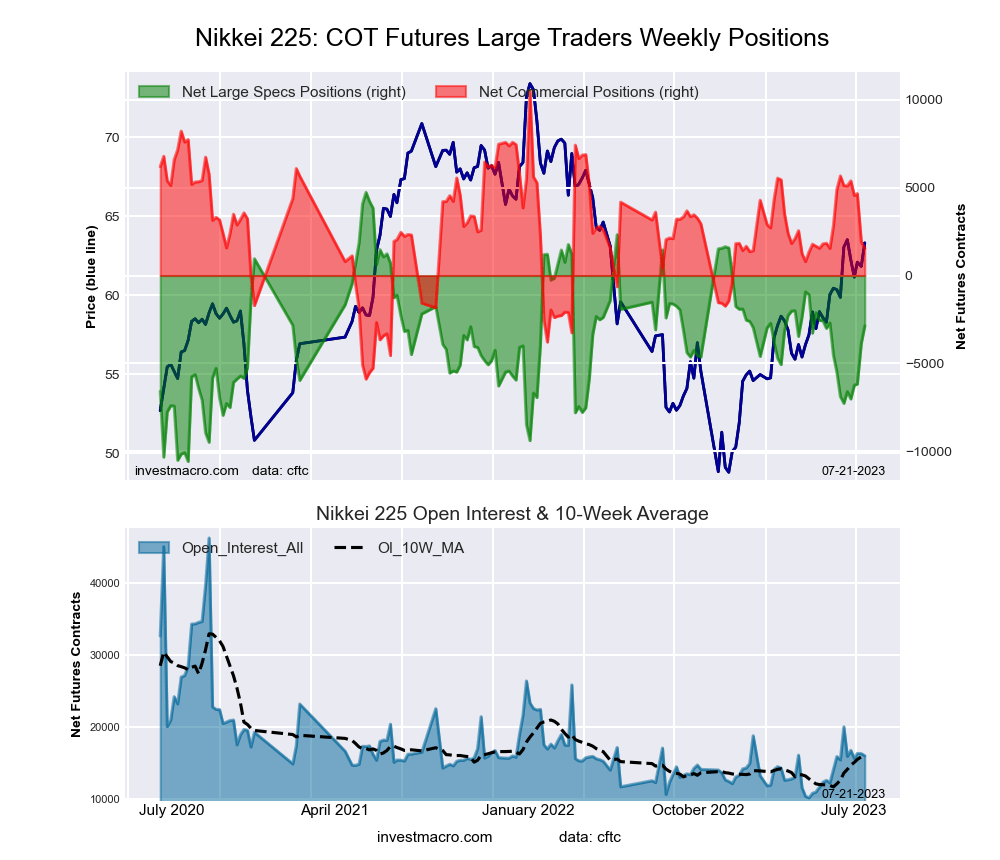
Nikkei Stock Average (USD) Futures:
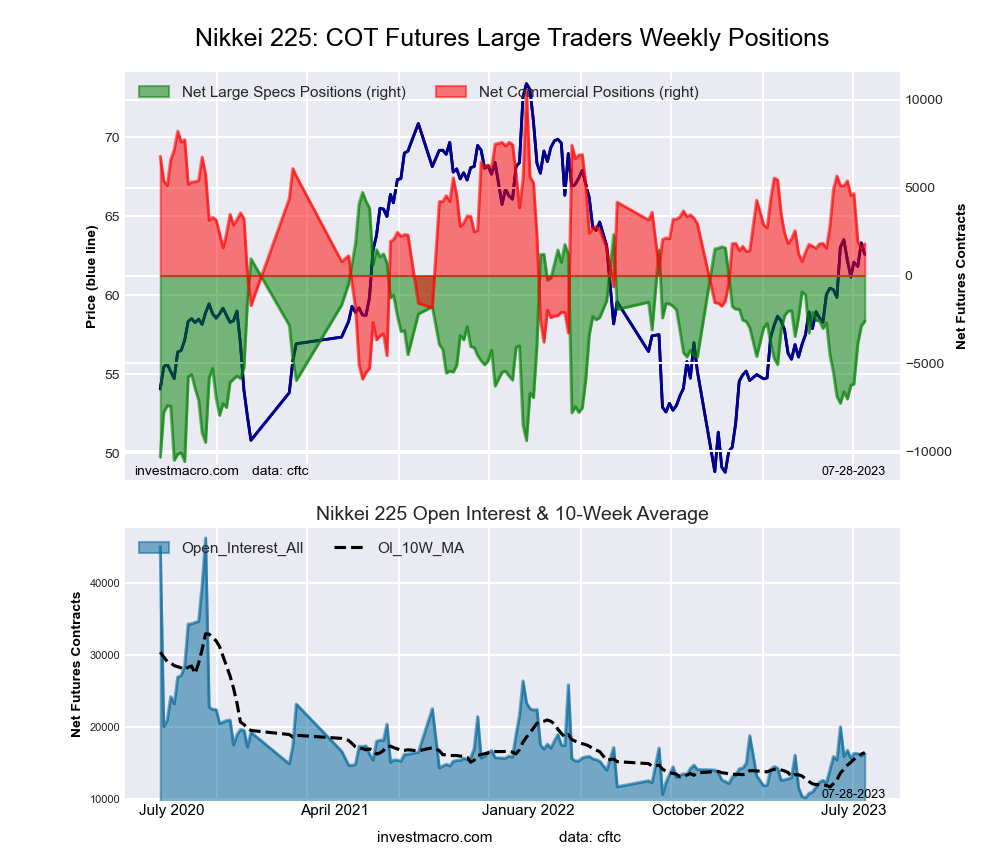 The Nikkei Stock Average (USD) large speculator standing this week totaled a net position of -2,599 contracts in the data reported through Tuesday. This was a weekly lift of 265 contracts from the previous week which had a total of -2,864 net contracts.
This week’s current strength score (the trader positioning range over the past three years, measured from 0 to 100) shows the speculators are currently Bullish with a score of 52.1 percent. The commercials are Bearish with a score of 46.9 percent and the small traders (not shown in chart) are Bearish with a score of 38.3 percent.
Price Trend-Following Model: Uptrend
Our weekly trend-following model classifies the current market price position as: Uptrend. The current action for the model is considered to be: Hold – Maintain Long Position.
| Nikkei Stock Average Futures Statistics | SPECULATORS | COMMERCIALS | SMALL TRADERS |
| – Percent of Open Interest Longs: | 9.6 | 64.5 | 26.0 |
| – Percent of Open Interest Shorts: | 25.5 | 53.4 | 21.1 |
| – Net Position: | -2,599 | 1,803 | 796 |
| – Gross Longs: | 1,559 | 10,519 | 4,236 |
| – Gross Shorts: | 4,158 | 8,716 | 3,440 |
| – Long to Short Ratio: | 0.4 to 1 | 1.2 to 1 | 1.2 to 1 |
| NET POSITION TREND: | |||
| – Strength Index Score (3 Year Range Pct): | 52.1 | 46.9 | 38.3 |
| – Strength Index Reading (3 Year Range): | Bullish | Bearish | Bearish |
| NET POSITION MOVEMENT INDEX: | |||
| – 6-Week Change in Strength Index: | 26.2 | -20.1 | -8.8 |
MSCI EAFE Mini Futures:
 The MSCI EAFE Mini large speculator standing this week totaled a net position of -30,964 contracts in the data reported through Tuesday. This was a weekly decrease of -10,114 contracts from the previous week which had a total of -20,850 net contracts.
This week’s current strength score (the trader positioning range over the past three years, measured from 0 to 100) shows the speculators are currently Bearish-Extreme with a score of 6.4 percent. The commercials are Bullish-Extreme with a score of 87.5 percent and the small traders (not shown in chart) are Bullish with a score of 54.0 percent.
Price Trend-Following Model: Strong Uptrend
Our weekly trend-following model classifies the current market price position as: Strong Uptrend. The current action for the model is considered to be: Hold – Maintain Long Position.
| MSCI EAFE Mini Futures Statistics | SPECULATORS | COMMERCIALS | SMALL TRADERS |
| – Percent of Open Interest Longs: | 6.2 | 90.1 | 3.1 |
| – Percent of Open Interest Shorts: | 13.8 | 84.3 | 1.3 |
| – Net Position: | -30,964 | 23,535 | 7,429 |
| – Gross Longs: | 24,995 | 365,843 | 12,565 |
| – Gross Shorts: | 55,959 | 342,308 | 5,136 |
| – Long to Short Ratio: | 0.4 to 1 | 1.1 to 1 | 2.4 to 1 |
| NET POSITION TREND: | |||
| – Strength Index Score (3 Year Range Pct): | 6.4 | 87.5 | 54.0 |
| – Strength Index Reading (3 Year Range): | Bearish-Extreme | Bullish-Extreme | Bullish |
| NET POSITION MOVEMENT INDEX: | |||
| – 6-Week Change in Strength Index: | -2.8 | 3.3 | -2.3 |
Article By InvestMacro – Receive our weekly COT Newsletter
*COT Report: The COT data, released weekly to the public each Friday, is updated through the most recent Tuesday (data is 3 days old) and shows a quick view of how large speculators or non-commercials (for-profit traders) were positioned in the futures markets.
The CFTC categorizes trader positions according to commercial hedgers (traders who use futures contracts for hedging as part of the business), non-commercials (large traders who speculate to realize trading profits) and nonreportable traders (usually small traders/speculators) as well as their open interest (contracts open in the market at time of reporting). See CFTC criteria here.


