Archive for COT Updates – Page 53

Commitment of Traders Data – Weekly Updates for the Futures Markets

Speculator Extremes: GBP, MXN, 2-Year and Palladium lead Bullish & Bearish Positions

By InvestMacro

The latest update for the weekly Commitment of Traders (COT) report was released by the Commodity Futures Trading Commission (CFTC) on Friday for data ending on July 3rd.

This weekly Extreme Positions report highlights the Most Bullish and Most Bearish Positions for the speculator category. Extreme positioning in these markets can foreshadow strong moves in the underlying market.

To signify an extreme position, we use the Strength Index (also known as the COT Index) of each instrument, a common method of measuring COT data. The Strength Index is simply a comparison of current trader positions against the range of positions over the previous 3 years. We use over 80 percent as extremely bullish and under 20 percent as extremely bearish. (Compare Strength Index scores across all markets in the data table or cot leaders table)


Here Are This Week’s Most Bullish Speculator Positions:

British Pound


The British Pound speculator position comes in as the most bullish extreme standing this week. The British Pound speculator level is currently at a 98.7 percent score of its 3-year range.

The six-week trend for the percent strength score totaled 29.2 this week. The overall net speculator position was a total of 50,265 net contracts this week with a change of -1,729 contract in the weekly speculator bets.


Mexican Peso


The Mexican Peso speculator position comes next in the extreme standings this week. The Mexican Peso speculator level is now at a 97.3 percent score of its 3-year range.

The six-week trend for the percent strength score was 11.2 this week. The speculator position registered 95,240 net contracts this week with a weekly change of -1,109 contracts in speculator bets.


3-Month Secured Overnight Financing Rate


The 3-Month Secured Overnight Financing Rate speculator position comes in third this week in the extreme standings. The 3-Month Secured Overnight Financing Rate speculator level resides at a 97.0 percent score of its 3-year range.

The six-week trend for the speculator strength score came in at 23.5 this week. The overall speculator position was 239,839 net contracts this week with a change of -44,151 contracts in the weekly speculator bets.


Cocoa Futures


The Cocoa Futures speculator position comes up number four in the extreme standings this week. The Cocoa Futures speculator level is at a 94.4 percent score of its 3-year range.

The six-week trend for the speculator strength score totaled a change of 7.6 this week. The overall speculator position was 72,584 net contracts this week with a change of 1,032 contracts in the speculator bets.


Live Cattle


The Live Cattle speculator position rounds out the top five in this week’s bullish extreme standings. The Live Cattle speculator level sits at a 92.7 percent score of its 3-year range. The six-week trend for the speculator strength score was 4.1 this week.

The speculator position was 105,443 net contracts this week with a change of 2,354 contracts in the weekly speculator bets.


This Week’s Most Bearish Speculator Positions:

Ultra U.S. Treasury Bonds


The Ultra U.S. Treasury Bonds speculator position comes in as the most bearish extreme standing this week. The Ultra U.S. Treasury Bonds speculator level is at a 0.0 percent score of its 3-year range.

The six-week trend for the speculator strength score was -17.2 this week. The overall speculator position was -450,572 net contracts this week with a change of -26,881 contracts in the speculator bets.


2-Year Bond


The 2-Year Bond speculator position comes in next for the most bearish extreme standing on the week. The 2-Year Bond speculator level is at a 0.0 percent score of its 3-year range.

The six-week trend for the speculator strength score was -14.7 this week. The speculator position was -1,058,426 net contracts this week with a change of -44,022 contracts in the weekly speculator bets.


1-Month Secured Overnight Financing Rate

The 1-Month Secured Overnight Financing Rate speculator position comes in as third most bearish extreme standing of the week. The 1-Month Secured Overnight Financing Rate speculator level resides at a 0.0 percent score of its 3-year range.

The six-week trend for the speculator strength score was -48.2 this week. The overall speculator position was -206,500 net contracts this week with a change of -18,761 contracts in the speculator bets.


Japanese Yen


The Japanese Yen speculator position comes in as this week’s fourth most bearish extreme standing. The Japanese Yen speculator level is at a 0.0 percent score of its 3-year range.

The six-week trend for the speculator strength score was -22.1 this week. The speculator position was -117,920 net contracts this week with a change of -5,050 contracts in the weekly speculator bets.


Palladium


Finally, the Palladium speculator position comes in as the fifth most bearish extreme standing for this week. The Palladium speculator level is at a 0.0 percent score of its 3-year range.

The six-week trend for the speculator strength score was -22.4 this week. The speculator position was -7,890 net contracts this week with a change of -566 contracts in the weekly speculator bets.


Article By InvestMacroReceive our weekly COT Newsletter

Speculators or Non-Commercials Notes:

Speculators, classified as non-commercial traders by the CFTC, are made up of large commodity funds, hedge funds and other significant for-profit participants. The Specs are generally regarded as trend-followers in their behavior towards price action – net speculator bets and prices tend to go in the same directions. These traders often look to buy when prices are rising and sell when prices are falling. To illustrate this point, many times speculator contracts can be found at their most extremes (bullish or bearish) when prices are also close to their highest or lowest levels.

These extreme levels can be dangerous for the large speculators as the trade is most crowded, there is less trading ammunition still sitting on the sidelines to push the trend further and prices have moved a significant distance. When the trend becomes exhausted, some speculators take profits while others look to also exit positions when prices fail to continue in the same direction. This process usually plays out over many months to years and can ultimately create a reverse effect where prices start to fall and speculators start a process of selling when prices are falling.


*COT Report: The COT data, released weekly to the public each Friday, is updated through the most recent Tuesday (data is 3 days old) and shows a quick view of how large speculators or non-commercials (for-profit traders) were positioned in the futures markets.

The CFTC categorizes trader positions according to commercial hedgers (traders who use futures contracts for hedging as part of the business), non-commercials (large traders who speculate to realize trading profits) and nonreportable traders (usually small traders/speculators) as well as their open interest (contracts open in the market at time of reporting). See CFTC criteria here.

COT Metals Charts: Weekly Speculator Changes led by Gold

By InvestMacro

Here are the latest charts and statistics for the Commitment of Traders (COT) data published by the Commodities Futures Trading Commission (CFTC).

The latest COT data is updated through Monday July 3rd and shows a quick view of how large traders (for-profit speculators and commercial entities) were positioned in the futures markets.

Weekly Speculator Changes led by Gold

The COT metals markets speculator bets were lower this week as two out of the six metals markets we cover had higher positioning while the other four markets had lower speculator contracts.

Leading the gains for the metals was Gold (11,187 contracts) with Steel (1,150 contracts) also showing a positive week.

The markets with declines in speculator bets for the week were Copper (-11,702 contracts), Palladium (-566 contracts), Platinum (-4,093 contracts) and Silver (-1,062 contracts) also registering lower bets on the week.


Data Snapshot of Commodity Market Traders | Columns Legend
Jul-03-2023OIOI-IndexSpec-NetSpec-IndexCom-NetCOM-IndexSmalls-NetSmalls-Index
Gold448,06312163,09749-184,7175321,62034
Silver114,421017,99044-29,5695811,57931
Copper204,399461,88832-4,003682,11532
Palladium14,781100-7,89008,358100-46814
Platinum69,383708,06734-13,570655,50342


Strength Scores led by Steel & Gold

COT Strength Scores (a normalized measure of Speculator positions over a 3-Year range, from 0 to 100 where above 80 is Extreme-Bullish and below 20 is Extreme-Bearish) showed that Steel (73 percent) and Gold (49 percent) lead the metals markets this week.

On the downside, Palladium (0 percent)comes in at the lowest strength level currently and is in Extreme-Bearish territory (below 20 percent).

Strength Statistics:
Gold (48.9 percent) vs Gold previous week (43.9 percent)
Silver (43.9 percent) vs Silver previous week (45.4 percent)
Copper (23.3 percent) vs Copper previous week (33.4 percent)
Platinum (34.2 percent) vs Platinum previous week (43.6 percent)
Palladium (0.0 percent) vs Palladium previous week (4.9 percent)
Steel (72.8 percent) vs Palladium previous week (69.5 percent)


Copper & Steel top the 6-Week Strength Trends

COT Strength Score Trends (or move index, calculates the 6-week changes in strength scores) showed that Copper (23 percent) and Steel (15 percent) lead the past six weeks trends for metals.

Platinum (-45 percent) leads the downside trend scores currently.

Move Statistics:
Gold (1.0 percent) vs Gold previous week (-12.3 percent)
Silver (-5.7 percent) vs Silver previous week (-6.8 percent)
Copper (18.2 percent) vs Copper previous week (30.7 percent)
Platinum (-44.8 percent) vs Platinum previous week (-31.5 percent)
Palladium (-22.4 percent) vs Palladium previous week (-20.7 percent)
Steel (15.0 percent) vs Steel previous week (9.1 percent)


Individual Markets:

Gold Comex Futures:

Gold Futures COT ChartThe Gold Comex Futures large speculator standing this week recorded a net position of 163,097 contracts in the data reported through Tuesday. This was a weekly boost of 11,187 contracts from the previous week which had a total of 151,910 net contracts.

This week’s current strength score (the trader positioning range over the past three years, measured from 0 to 100) shows the speculators are currently Bearish with a score of 48.9 percent. The commercials are Bullish with a score of 52.6 percent and the small traders (not shown in chart) are Bearish with a score of 34.1 percent.

Price Trend-Following Model: Weak Uptrend

Our weekly trend-following model classifies the current market price position as: Weak Uptrend. The current action for the model is considered to be: Hold – Maintain Long Position.

Gold Futures StatisticsSPECULATORSCOMMERCIALSSMALL TRADERS
– Percent of Open Interest Longs:52.525.610.2
– Percent of Open Interest Shorts:16.166.95.3
– Net Position:163,097-184,71721,620
– Gross Longs:235,081114,90545,490
– Gross Shorts:71,984299,62223,870
– Long to Short Ratio:3.3 to 10.4 to 11.9 to 1
NET POSITION TREND:
– Strength Index Score (3 Year Range Pct):48.952.634.1
– Strength Index Reading (3 Year Range):BearishBullishBearish
NET POSITION MOVEMENT INDEX:
– 6-Week Change in Strength Index:1.00.9-11.7


Silver Comex Futures:

Silver Futures COT ChartThe Silver Comex Futures large speculator standing this week recorded a net position of 17,990 contracts in the data reported through Tuesday. This was a weekly lowering of -1,062 contracts from the previous week which had a total of 19,052 net contracts.

This week’s current strength score (the trader positioning range over the past three years, measured from 0 to 100) shows the speculators are currently Bearish with a score of 43.9 percent. The commercials are Bullish with a score of 58.1 percent and the small traders (not shown in chart) are Bearish with a score of 30.7 percent.

Price Trend-Following Model: Weak Uptrend

Our weekly trend-following model classifies the current market price position as: Weak Uptrend. The current action for the model is considered to be: Hold – Maintain Long Position.

Silver Futures StatisticsSPECULATORSCOMMERCIALSSMALL TRADERS
– Percent of Open Interest Longs:40.633.020.1
– Percent of Open Interest Shorts:24.958.910.0
– Net Position:17,990-29,56911,579
– Gross Longs:46,43337,78423,020
– Gross Shorts:28,44367,35311,441
– Long to Short Ratio:1.6 to 10.6 to 12.0 to 1
NET POSITION TREND:
– Strength Index Score (3 Year Range Pct):43.958.130.7
– Strength Index Reading (3 Year Range):BearishBullishBearish
NET POSITION MOVEMENT INDEX:
– 6-Week Change in Strength Index:-5.76.5-8.0


Copper Grade #1 Futures:

The Copper Grade #1 Futures large speculator standing this week recorded a net position of -8,762 contracts in the data reported through Tuesday. This was a weekly fall of -11,702 contracts from the previous week which had a total of 2,940 net contracts.

This week’s current strength score (the trader positioning range over the past three years, measured from 0 to 100) shows the speculators are currently Bearish with a score of 23.3 percent. The commercials are Bullish with a score of 77.1 percent and the small traders (not shown in chart) are Bearish with a score of 32.0 percent.

Price Trend-Following Model: Downtrend

Our weekly trend-following model classifies the current market price position as: Downtrend. The current action for the model is considered to be: Hold – Maintain Short Position.

Copper Futures StatisticsSPECULATORSCOMMERCIALSSMALL TRADERS
– Percent of Open Interest Longs:31.742.48.2
– Percent of Open Interest Shorts:30.744.47.2
– Net Position:1,888-4,0032,115
– Gross Longs:64,74086,76116,759
– Gross Shorts:62,85290,76414,644
– Long to Short Ratio:1.0 to 11.0 to 11.1 to 1
NET POSITION TREND:
– Strength Index Score (3 Year Range Pct):32.568.331.8
– Strength Index Reading (3 Year Range):BearishBullishBearish
NET POSITION MOVEMENT INDEX:
– 6-Week Change in Strength Index:23.1-19.7-19.0


Platinum Futures:

Platinum Futures COT ChartThe Platinum Futures large speculator standing this week recorded a net position of 8,067 contracts in the data reported through Tuesday. This was a weekly lowering of -4,093 contracts from the previous week which had a total of 12,160 net contracts.

This week’s current strength score (the trader positioning range over the past three years, measured from 0 to 100) shows the speculators are currently Bearish with a score of 34.2 percent. The commercials are Bullish with a score of 65.4 percent and the small traders (not shown in chart) are Bearish with a score of 41.8 percent.

Price Trend-Following Model: Strong Downtrend

Our weekly trend-following model classifies the current market price position as: Strong Downtrend. The current action for the model is considered to be: New Sell – Short Position.

Platinum Futures StatisticsSPECULATORSCOMMERCIALSSMALL TRADERS
– Percent of Open Interest Longs:52.528.613.0
– Percent of Open Interest Shorts:40.948.25.1
– Net Position:8,067-13,5705,503
– Gross Longs:36,44319,8569,026
– Gross Shorts:28,37633,4263,523
– Long to Short Ratio:1.3 to 10.6 to 12.6 to 1
NET POSITION TREND:
– Strength Index Score (3 Year Range Pct):34.265.441.8
– Strength Index Reading (3 Year Range):BearishBullishBearish
NET POSITION MOVEMENT INDEX:
– 6-Week Change in Strength Index:-44.838.411.0


Palladium Futures:

Palladium Futures COT ChartThe Palladium Futures large speculator standing this week recorded a net position of -7,890 contracts in the data reported through Tuesday. This was a weekly decline of -566 contracts from the previous week which had a total of -7,324 net contracts.

This week’s current strength score (the trader positioning range over the past three years, measured from 0 to 100) shows the speculators are currently Bearish-Extreme with a score of 0.0 percent. The commercials are Bullish-Extreme with a score of 100.0 percent and the small traders (not shown in chart) are Bearish-Extreme with a score of 13.6 percent.

Price Trend-Following Model: Strong Downtrend

Our weekly trend-following model classifies the current market price position as: Strong Downtrend. The current action for the model is considered to be: Hold – Maintain Short Position.

Palladium Futures StatisticsSPECULATORSCOMMERCIALSSMALL TRADERS
– Percent of Open Interest Longs:22.663.19.9
– Percent of Open Interest Shorts:76.06.613.1
– Net Position:-7,8908,358-468
– Gross Longs:3,3429,3301,463
– Gross Shorts:11,2329721,931
– Long to Short Ratio:0.3 to 19.6 to 10.8 to 1
NET POSITION TREND:
– Strength Index Score (3 Year Range Pct):0.0100.013.6
– Strength Index Reading (3 Year Range):Bearish-ExtremeBullish-ExtremeBearish-Extreme
NET POSITION MOVEMENT INDEX:
– 6-Week Change in Strength Index:-22.421.0-5.3


Steel Futures Futures:

Steel Futures COT ChartThe Steel Futures large speculator standing this week recorded a net position of -130 contracts in the data reported through Tuesday. This was a weekly boost of 1,150 contracts from the previous week which had a total of -1,280 net contracts.

This week’s current strength score (the trader positioning range over the past three years, measured from 0 to 100) shows the speculators are currently Bullish with a score of 72.8 percent. The commercials are Bearish with a score of 26.9 percent and the small traders (not shown in chart) are Bearish with a score of 40.6 percent.

Price Trend-Following Model: Strong Downtrend

Our weekly trend-following model classifies the current market price position as: Strong Downtrend. The current action for the model is considered to be: Hold – Maintain Short Position.

Steel Futures StatisticsSPECULATORSCOMMERCIALSSMALL TRADERS
– Percent of Open Interest Longs:17.574.91.3
– Percent of Open Interest Shorts:18.175.10.7
– Net Position:-130-28158
– Gross Longs:4,12917,669312
– Gross Shorts:4,25917,697154
– Long to Short Ratio:1.0 to 11.0 to 12.0 to 1
NET POSITION TREND:
– Strength Index Score (3 Year Range Pct):72.826.940.6
– Strength Index Reading (3 Year Range):BullishBearishBearish
NET POSITION MOVEMENT INDEX:
– 6-Week Change in Strength Index:15.0-16.040.6


Article By InvestMacroReceive our weekly COT Newsletter

*COT Report: The COT data, released weekly to the public each Friday, is updated through the most recent Tuesday (data is 3 days old) and shows a quick view of how large speculators or non-commercials (for-profit traders) were positioned in the futures markets.

The CFTC categorizes trader positions according to commercial hedgers (traders who use futures contracts for hedging as part of the business), non-commercials (large traders who speculate to realize trading profits) and nonreportable traders (usually small traders/speculators) as well as their open interest (contracts open in the market at time of reporting). See CFTC criteria here.

COT Bonds Charts: Speculator bets led by 10-Year Bonds

By InvestMacro

Here are the latest charts and statistics for the Commitment of Traders (COT) reports data published by the Commodities Futures Trading Commission (CFTC).

The latest COT data is updated through Monday July 3rd and shows a quick view of how large traders (for-profit speculators and commercial hedgers) were positioned in the futures markets.

Weekly Speculator Changes led by 10-Year Bonds & Ultra 10-Year Bonds

The COT bond market speculator bets were lower this week as one out of the eight bond markets we cover had higher positioning while the other seven markets had lower speculator contracts.

The only market with gains for the bond category was the 10-Year Bonds with a total rise of 20,321 contracts.

The bond markets with declines in speculator bets for the week were the SOFR 3-Months (-44,151 contracts), the 2-Year Bonds (-44,022 contracts), 5-Year Bonds (-31,326 contracts), the US Treasury Bonds (-24,681 contracts), the Ultra Treasury Bonds (-26,881 contracts), the Fed Funds (-17,553 contracts) and the Ultra 10-Year Bonds (-8,713 contracts) also registering lower bets on the week.


Data Snapshot of Bond Market Traders | Columns Legend
Jul-03-2023OIOI-IndexSpec-NetSpec-IndexCom-NetCOM-IndexSmalls-NetSmalls-Index
SOFR-3-Months9,300,04289239,83997-233,4362-6,40384
FedFunds1,414,52539-106,75834115,92166-9,16373
2-Year3,667,737100-1,058,4260970,60210087,82497
Long T-Bond1,242,91863-139,92939106,7424933,18773
10-Year4,737,76291-780,6787719,9099660,76987
5-Year5,080,61099-1,029,81401,026,6871003,12782


Strength Scores led by SOFR 3-Months & US Treasury Bonds

COT Strength Scores (a normalized measure of Speculator positions over a 3-Year range, from 0 to 100 where above 80 is Extreme-Bullish and below 20 is Extreme-Bearish) showed that the SOFR 3-Months (97 percent). The US Treasury Bonds (39 percent) and the Fed Funds (34 percent) come in as the next highest in the weekly strength scores.

On the downside, the Ultra Treasury Bonds (0 percent), the 5-Year Bonds (0 percent), the 2-Year Bonds (0 percent) and the 10-Year Bonds (7 percent) come in at the lowest strength level currently and are in Extreme-Bearish territory (below 20 percent).

Strength Statistics:
Fed Funds (33.5 percent) vs Fed Funds previous week (36.3 percent)
2-Year Bond (0.0 percent) vs 2-Year Bond previous week (3.8 percent)
5-Year Bond (0.5 percent) vs 5-Year Bond previous week (3.3 percent)
10-Year Bond (6.8 percent) vs 10-Year Bond previous week (4.8 percent)
Ultra 10-Year Bond (15.9 percent) vs Ultra 10-Year Bond previous week (17.7 percent)
US Treasury Bond (39.1 percent) vs US Treasury Bond previous week (47.1 percent)
Ultra US Treasury Bond (0.0 percent) vs Ultra US Treasury Bond previous week (11.1 percent)
SOFR 3-Months (97.0 percent) vs SOFR 3-Months previous week (100.0 percent)


SOFR 3-Months & Ultra 10-Year Bonds top the 6-Week Strength Trends

COT Strength Score Trends (or move index, calculates the 6-week changes in strength scores) showed that the SOFR 3-Months (24 percent) and the Ultra 10-Year Bonds (4 percent) lead the past six weeks trends for bonds. The 10-Year Bonds (-1 percent) and the are the next highest positive movers in the latest trends data.

The US Treasury Bonds (-31 percent), the Ultra Treasury Bonds (-17 percent) and the 2-Year Bonds (-15 percent) lead the downside trend scores currently.

Strength Trend Statistics:
Fed Funds (-2.9 percent) vs Fed Funds previous week (-3.4 percent)
2-Year Bond (-14.7 percent) vs 2-Year Bond previous week (-14.0 percent)
5-Year Bond (-8.5 percent) vs 5-Year Bond previous week (-6.6 percent)
10-Year Bond (-0.9 percent) vs 10-Year Bond previous week (-10.5 percent)
Ultra 10-Year Bond (3.7 percent) vs Ultra 10-Year Bond previous week (11.2 percent)
US Treasury Bond (-31.5 percent) vs US Treasury Bond previous week (-17.5 percent)
Ultra US Treasury Bond (-17.2 percent) vs Ultra US Treasury Bond previous week (-14.4 percent)
SOFR 3-Months (23.5 percent) vs SOFR 3-Months previous week (31.1 percent)


Secured Overnight Financing Rate (3-Month) Futures:

SOFR 3-Months Bonds Futures COT ChartThe Secured Overnight Financing Rate (3-Month) large speculator standing this week came in at a net position of 239,839 contracts in the data reported through Tuesday. This was a weekly decline of -44,151 contracts from the previous week which had a total of 283,990 net contracts.

This week’s current strength score (the trader positioning range over the past three years, measured from 0 to 100) shows the speculators are currently Bullish-Extreme with a score of 97.0 percent. The commercials are Bearish-Extreme with a score of 2.1 percent and the small traders (not shown in chart) are Bullish-Extreme with a score of 84.4 percent.

Price Trend-Following Model: Weak Uptrend

Our weekly trend-following model classifies the current market price position as: Weak Uptrend. The current action for the model is considered to be: Hold – Maintain Long Position.

SOFR 3-Months StatisticsSPECULATORSCOMMERCIALSSMALL TRADERS
– Percent of Open Interest Longs:20.258.60.3
– Percent of Open Interest Shorts:17.661.10.4
– Net Position:239,839-233,436-6,403
– Gross Longs:1,880,5775,453,30028,213
– Gross Shorts:1,640,7385,686,73634,616
– Long to Short Ratio:1.1 to 11.0 to 10.8 to 1
NET POSITION TREND:
– Strength Index Score (3 Year Range Pct):97.02.184.4
– Strength Index Reading (3 Year Range):Bullish-ExtremeBearish-ExtremeBullish-Extreme
NET POSITION MOVEMENT INDEX:
– 6-Week Change in Strength Index:23.5-23.90.5


30-Day Federal Funds Futures:

Federal Funds 30-Day Bonds Futures COT ChartThe 30-Day Federal Funds large speculator standing this week came in at a net position of -106,758 contracts in the data reported through Tuesday. This was a weekly reduction of -17,553 contracts from the previous week which had a total of -89,205 net contracts.

This week’s current strength score (the trader positioning range over the past three years, measured from 0 to 100) shows the speculators are currently Bearish with a score of 33.5 percent. The commercials are Bullish with a score of 66.3 percent and the small traders (not shown in chart) are Bullish with a score of 73.0 percent.

Price Trend-Following Model: Downtrend

Our weekly trend-following model classifies the current market price position as: Downtrend. The current action for the model is considered to be: Hold – Maintain Short Position.

30-Day Federal Funds StatisticsSPECULATORSCOMMERCIALSSMALL TRADERS
– Percent of Open Interest Longs:6.572.02.5
– Percent of Open Interest Shorts:14.063.83.1
– Net Position:-106,758115,921-9,163
– Gross Longs:91,6101,018,37935,112
– Gross Shorts:198,368902,45844,275
– Long to Short Ratio:0.5 to 11.1 to 10.8 to 1
NET POSITION TREND:
– Strength Index Score (3 Year Range Pct):33.566.373.0
– Strength Index Reading (3 Year Range):BearishBullishBullish
NET POSITION MOVEMENT INDEX:
– 6-Week Change in Strength Index:-2.91.418.9


2-Year Treasury Note Futures:

2-Year Treasury Bonds Futures COT ChartThe 2-Year Treasury Note large speculator standing this week came in at a net position of -1,058,426 contracts in the data reported through Tuesday. This was a weekly reduction of -44,022 contracts from the previous week which had a total of -1,014,404 net contracts.

This week’s current strength score (the trader positioning range over the past three years, measured from 0 to 100) shows the speculators are currently Bearish-Extreme with a score of 0.0 percent. The commercials are Bullish-Extreme with a score of 100.0 percent and the small traders (not shown in chart) are Bullish-Extreme with a score of 96.6 percent.

Price Trend-Following Model: Strong Downtrend

Our weekly trend-following model classifies the current market price position as: Strong Downtrend. The current action for the model is considered to be: Hold – Maintain Short Position.

2-Year Treasury Note StatisticsSPECULATORSCOMMERCIALSSMALL TRADERS
– Percent of Open Interest Longs:11.181.26.6
– Percent of Open Interest Shorts:39.954.74.2
– Net Position:-1,058,426970,60287,824
– Gross Longs:405,4592,977,688241,676
– Gross Shorts:1,463,8852,007,086153,852
– Long to Short Ratio:0.3 to 11.5 to 11.6 to 1
NET POSITION TREND:
– Strength Index Score (3 Year Range Pct):0.0100.096.6
– Strength Index Reading (3 Year Range):Bearish-ExtremeBullish-ExtremeBullish-Extreme
NET POSITION MOVEMENT INDEX:
– 6-Week Change in Strength Index:-14.716.7-0.9


5-Year Treasury Note Futures:

5-Year Treasury Bonds Futures COT ChartThe 5-Year Treasury Note large speculator standing this week came in at a net position of -1,029,814 contracts in the data reported through Tuesday. This was a weekly reduction of -31,326 contracts from the previous week which had a total of -998,488 net contracts.

This week’s current strength score (the trader positioning range over the past three years, measured from 0 to 100) shows the speculators are currently Bearish-Extreme with a score of 0.5 percent. The commercials are Bullish-Extreme with a score of 100.0 percent and the small traders (not shown in chart) are Bullish-Extreme with a score of 81.9 percent.

Price Trend-Following Model: Strong Downtrend

Our weekly trend-following model classifies the current market price position as: Strong Downtrend. The current action for the model is considered to be: New Sell – Short Position.

5-Year Treasury Note StatisticsSPECULATORSCOMMERCIALSSMALL TRADERS
– Percent of Open Interest Longs:6.984.67.3
– Percent of Open Interest Shorts:27.164.47.3
– Net Position:-1,029,8141,026,6873,127
– Gross Longs:348,2304,297,985373,393
– Gross Shorts:1,378,0443,271,298370,266
– Long to Short Ratio:0.3 to 11.3 to 11.0 to 1
NET POSITION TREND:
– Strength Index Score (3 Year Range Pct):0.5100.081.9
– Strength Index Reading (3 Year Range):Bearish-ExtremeBullish-ExtremeBullish-Extreme
NET POSITION MOVEMENT INDEX:
– 6-Week Change in Strength Index:-8.513.0-13.3


10-Year Treasury Note Futures:

10-Year Treasury Notes Bonds Futures COT ChartThe 10-Year Treasury Note large speculator standing this week came in at a net position of -780,678 contracts in the data reported through Tuesday. This was a weekly boost of 20,321 contracts from the previous week which had a total of -800,999 net contracts.

This week’s current strength score (the trader positioning range over the past three years, measured from 0 to 100) shows the speculators are currently Bearish-Extreme with a score of 6.8 percent. The commercials are Bullish-Extreme with a score of 95.9 percent and the small traders (not shown in chart) are Bullish-Extreme with a score of 86.7 percent.

Price Trend-Following Model: Strong Downtrend

Our weekly trend-following model classifies the current market price position as: Strong Downtrend. The current action for the model is considered to be: New Sell – Short Position.

10-Year Treasury Note StatisticsSPECULATORSCOMMERCIALSSMALL TRADERS
– Percent of Open Interest Longs:9.280.28.8
– Percent of Open Interest Shorts:25.665.07.6
– Net Position:-780,678719,90960,769
– Gross Longs:434,4563,798,675418,993
– Gross Shorts:1,215,1343,078,766358,224
– Long to Short Ratio:0.4 to 11.2 to 11.2 to 1
NET POSITION TREND:
– Strength Index Score (3 Year Range Pct):6.895.986.7
– Strength Index Reading (3 Year Range):Bearish-ExtremeBullish-ExtremeBullish-Extreme
NET POSITION MOVEMENT INDEX:
– 6-Week Change in Strength Index:-0.94.0-6.2


Ultra 10-Year Notes Futures:

Ultra 10-Year Treasury Notes Bonds Futures COT ChartThe Ultra 10-Year Notes large speculator standing this week came in at a net position of -139,901 contracts in the data reported through Tuesday. This was a weekly lowering of -8,713 contracts from the previous week which had a total of -131,188 net contracts.

This week’s current strength score (the trader positioning range over the past three years, measured from 0 to 100) shows the speculators are currently Bearish-Extreme with a score of 15.9 percent. The commercials are Bullish with a score of 76.4 percent and the small traders (not shown in chart) are Bullish with a score of 79.9 percent.

Price Trend-Following Model: Weak Uptrend

Our weekly trend-following model classifies the current market price position as: Weak Uptrend. The current action for the model is considered to be: Hold – Maintain Long Position.

Ultra 10-Year Notes StatisticsSPECULATORSCOMMERCIALSSMALL TRADERS
– Percent of Open Interest Longs:9.976.811.8
– Percent of Open Interest Shorts:18.165.215.2
– Net Position:-139,901197,302-57,401
– Gross Longs:168,0891,304,780201,280
– Gross Shorts:307,9901,107,478258,681
– Long to Short Ratio:0.5 to 11.2 to 10.8 to 1
NET POSITION TREND:
– Strength Index Score (3 Year Range Pct):15.976.479.9
– Strength Index Reading (3 Year Range):Bearish-ExtremeBullishBullish
NET POSITION MOVEMENT INDEX:
– 6-Week Change in Strength Index:3.7-8.111.5


US Treasury Bonds Futures:

US Year Treasury Notes Long Bonds Futures COT ChartThe US Treasury Bonds large speculator standing this week came in at a net position of -139,929 contracts in the data reported through Tuesday. This was a weekly decrease of -24,681 contracts from the previous week which had a total of -115,248 net contracts.

This week’s current strength score (the trader positioning range over the past three years, measured from 0 to 100) shows the speculators are currently Bearish with a score of 39.1 percent. The commercials are Bearish with a score of 48.7 percent and the small traders (not shown in chart) are Bullish with a score of 72.6 percent.

Price Trend-Following Model: Strong Downtrend

Our weekly trend-following model classifies the current market price position as: Strong Downtrend. The current action for the model is considered to be: Hold – Maintain Short Position.

US Treasury Bonds StatisticsSPECULATORSCOMMERCIALSSMALL TRADERS
– Percent of Open Interest Longs:5.779.314.3
– Percent of Open Interest Shorts:16.970.711.6
– Net Position:-139,929106,74233,187
– Gross Longs:70,648985,219177,299
– Gross Shorts:210,577878,477144,112
– Long to Short Ratio:0.3 to 11.1 to 11.2 to 1
NET POSITION TREND:
– Strength Index Score (3 Year Range Pct):39.148.772.6
– Strength Index Reading (3 Year Range):BearishBearishBullish
NET POSITION MOVEMENT INDEX:
– 6-Week Change in Strength Index:-31.536.7-4.6


Ultra US Treasury Bonds Futures:

Ultra US Year Treasury Notes Long Bonds Futures COT ChartThe Ultra US Treasury Bonds large speculator standing this week came in at a net position of -450,572 contracts in the data reported through Tuesday. This was a weekly decline of -26,881 contracts from the previous week which had a total of -423,691 net contracts.

This week’s current strength score (the trader positioning range over the past three years, measured from 0 to 100) shows the speculators are currently Bearish-Extreme with a score of 0.0 percent. The commercials are Bullish-Extreme with a score of 99.2 percent and the small traders (not shown in chart) are Bullish-Extreme with a score of 90.3 percent.

Price Trend-Following Model: Strong Downtrend

Our weekly trend-following model classifies the current market price position as: Strong Downtrend. The current action for the model is considered to be: Hold – Maintain Short Position.

Ultra US Treasury Bonds StatisticsSPECULATORSCOMMERCIALSSMALL TRADERS
– Percent of Open Interest Longs:4.683.611.5
– Percent of Open Interest Shorts:34.257.77.8
– Net Position:-450,572394,35456,218
– Gross Longs:69,9551,272,590174,627
– Gross Shorts:520,527878,236118,409
– Long to Short Ratio:0.1 to 11.4 to 11.5 to 1
NET POSITION TREND:
– Strength Index Score (3 Year Range Pct):0.099.290.3
– Strength Index Reading (3 Year Range):Bearish-ExtremeBullish-ExtremeBullish-Extreme
NET POSITION MOVEMENT INDEX:
– 6-Week Change in Strength Index:-17.223.2-2.3


Article By InvestMacroReceive our weekly COT Newsletter

*COT Report: The COT data, released weekly to the public each Friday, is updated through the most recent Tuesday (data is 3 days old) and shows a quick view of how large speculators or non-commercials (for-profit traders) were positioned in the futures markets.

The CFTC categorizes trader positions according to commercial hedgers (traders who use futures contracts for hedging as part of the business), non-commercials (large traders who speculate to realize trading profits) and nonreportable traders (usually small traders/speculators) as well as their open interest (contracts open in the market at time of reporting). See CFTC criteria here.

COT Stock Market Charts: Weekly Speculator Changes led by VIX & DowJones-Mini

By InvestMacro

Here are the latest charts and statistics for the Commitment of Traders (COT) data published by the Commodities Futures Trading Commission (CFTC).

The latest COT data is updated through Monday July 3rd and shows a quick view of how large traders (for-profit speculators and commercial entities) were positioned in the futures markets.

Weekly Speculator Changes led by VIX & DowJones-Mini

The COT stock markets speculator bets were higher this week as five out of the seven stock markets we cover had higher positioning while the other three markets had lower speculator contracts.

Leading the gains for the stock markets was VIX (9,797 contracts) with the DowJones-Mini (5,840 contracts), the MSCI EAFE-Mini (4,241 contracts), the S&P500-Mini (1,011 contracts) and the Nikkei 225 (61 contracts) also showing positive weeks.

The markets with the declines in speculator bets this week were with the Nasdaq-Mini (-11,784 contracts) and the Russell-Mini (-3,810 contracts) also registering lower bets on the week.


Data Snapshot of Stock Market Traders | Columns Legend
Jul-03-2023OIOI-IndexSpec-NetSpec-IndexCom-NetCOM-IndexSmalls-NetSmalls-Index
S&P500-Mini2,211,00422-207,23934205,791681,44845
Nikkei 22516,35917-6,185294,671641,51447
Nasdaq-Mini248,698295,45880-3,88320-1,57550
DowJones-Mini95,16155-13,0823714,23663-1,15438
VIX406,80576-54,9247958,02217-3,09880
Nikkei 225 Yen57,3184910,9656815,89654-26,86120


Strength Scores led by Nasdaq-Mini & VIX

COT Strength Scores (a normalized measure of Speculator positions over a 3-Year range, from 0 to 100 where above 80 is Extreme-Bullish and below 20 is Extreme-Bearish) showed that the Nasdaq-Mini (80 percent) and the VIX (79 percent) lead the stock markets this week. The Nikkei 225 Yen (68 percent) and DowJones-Mini (37 percent) come in as the next highest in the weekly strength scores.

On the downside, the Nikkei 225 (29 percent) comes in at the lowest strength level currently with the next lowest strength score being the MSCI EAFE-Mini (30 percent).

Strength Statistics:
VIX (79.4 percent) vs VIX previous week (72.2 percent)
S&P500-Mini (33.8 percent) vs S&P500-Mini previous week (33.7 percent)
DowJones-Mini (36.9 percent) vs DowJones-Mini previous week (20.4 percent)
Nasdaq-Mini (80.3 percent) vs Nasdaq-Mini previous week (87.1 percent)
Russell2000-Mini (31.5 percent) vs Russell2000-Mini previous week (33.8 percent)
Nikkei USD (28.7 percent) vs Nikkei USD previous week (28.3 percent)
EAFE-Mini (29.9 percent) vs EAFE-Mini previous week (24.7 percent)


S&P500-Mini & DowJones-Mini top the 6-Week Strength Trends

COT Strength Score Trends (or move index, calculates the 6-week changes in strength scores) showed that the S&P500-Mini (29 percent) leads the past six weeks trends for the stock markets. The DowJones-Mini (27 percent), the MSCI EAFE-Mini (11 percent) and the VIX (7 percent) are the next highest positive movers in the latest trends data.

The Russell-Mini (-11 percent) leads the downside trend scores currently with the Nasdaq-Mini (-5 percent) coming in as the next market with lower trend scores.

Strength Trend Statistics:
VIX (7.1 percent) vs VIX previous week (-7.6 percent)
S&P500-Mini (29.4 percent) vs S&P500-Mini previous week (26.9 percent)
DowJones-Mini (27.3 percent) vs DowJones-Mini previous week (7.7 percent)
Nasdaq-Mini (-5.2 percent) vs Nasdaq-Mini previous week (-1.6 percent)
Russell2000-Mini (-11.2 percent) vs Russell2000-Mini previous week (0.2 percent)
Nikkei USD (-4.4 percent) vs Nikkei USD previous week (-11.2 percent)
EAFE-Mini (10.7 percent) vs EAFE-Mini previous week (1.0 percent)


Individual Stock Market Charts:

VIX Volatility Futures:

VIX Volatility Futures COT ChartThe VIX Volatility large speculator standing this week reached a net position of -54,924 contracts in the data reported through Tuesday. This was a weekly increase of 9,797 contracts from the previous week which had a total of -64,721 net contracts.

This week’s current strength score (the trader positioning range over the past three years, measured from 0 to 100) shows the speculators are currently Bullish with a score of 79.4 percent. The commercials are Bearish-Extreme with a score of 17.5 percent and the small traders (not shown in chart) are Bullish-Extreme with a score of 80.1 percent.

Price Trend-Following Model: Downtrend

Our weekly trend-following model classifies the current market price position as: Downtrend. The current action for the model is considered to be: Hold – Maintain Short Position.

VIX Volatility Futures StatisticsSPECULATORSCOMMERCIALSSMALL TRADERS
– Percent of Open Interest Longs:23.250.26.4
– Percent of Open Interest Shorts:36.735.97.2
– Net Position:-54,92458,022-3,098
– Gross Longs:94,274204,07126,095
– Gross Shorts:149,198146,04929,193
– Long to Short Ratio:0.6 to 11.4 to 10.9 to 1
NET POSITION TREND:
– Strength Index Score (3 Year Range Pct):79.417.580.1
– Strength Index Reading (3 Year Range):BullishBearish-ExtremeBullish-Extreme
NET POSITION MOVEMENT INDEX:
– 6-Week Change in Strength Index:7.1-7.32.2


S&P500 Mini Futures:

SP500 Mini Futures COT ChartThe S&P500 Mini large speculator standing this week reached a net position of -207,239 contracts in the data reported through Tuesday. This was a weekly lift of 1,011 contracts from the previous week which had a total of -208,250 net contracts.

This week’s current strength score (the trader positioning range over the past three years, measured from 0 to 100) shows the speculators are currently Bearish with a score of 33.8 percent. The commercials are Bullish with a score of 68.3 percent and the small traders (not shown in chart) are Bearish with a score of 44.7 percent.

Price Trend-Following Model: Strong Uptrend

Our weekly trend-following model classifies the current market price position as: Strong Uptrend. The current action for the model is considered to be: Hold – Maintain Long Position.

S&P500 Mini Futures StatisticsSPECULATORSCOMMERCIALSSMALL TRADERS
– Percent of Open Interest Longs:10.176.411.1
– Percent of Open Interest Shorts:19.567.111.1
– Net Position:-207,239205,7911,448
– Gross Longs:223,3581,688,344245,999
– Gross Shorts:430,5971,482,553244,551
– Long to Short Ratio:0.5 to 11.1 to 11.0 to 1
NET POSITION TREND:
– Strength Index Score (3 Year Range Pct):33.868.344.7
– Strength Index Reading (3 Year Range):BearishBullishBearish
NET POSITION MOVEMENT INDEX:
– 6-Week Change in Strength Index:29.4-29.86.8


Dow Jones Mini Futures:

Dow Jones Mini Futures COT ChartThe Dow Jones Mini large speculator standing this week reached a net position of -13,082 contracts in the data reported through Tuesday. This was a weekly boost of 5,840 contracts from the previous week which had a total of -18,922 net contracts.

This week’s current strength score (the trader positioning range over the past three years, measured from 0 to 100) shows the speculators are currently Bearish with a score of 36.9 percent. The commercials are Bullish with a score of 62.7 percent and the small traders (not shown in chart) are Bearish with a score of 38.3 percent.

Price Trend-Following Model: Uptrend

Our weekly trend-following model classifies the current market price position as: Uptrend. The current action for the model is considered to be: Hold – Maintain Long Position.

Dow Jones Mini Futures StatisticsSPECULATORSCOMMERCIALSSMALL TRADERS
– Percent of Open Interest Longs:25.560.313.4
– Percent of Open Interest Shorts:39.245.414.7
– Net Position:-13,08214,236-1,154
– Gross Longs:24,23357,40312,794
– Gross Shorts:37,31543,16713,948
– Long to Short Ratio:0.6 to 11.3 to 10.9 to 1
NET POSITION TREND:
– Strength Index Score (3 Year Range Pct):36.962.738.3
– Strength Index Reading (3 Year Range):BearishBullishBearish
NET POSITION MOVEMENT INDEX:
– 6-Week Change in Strength Index:27.3-23.810.3


Nasdaq Mini Futures:

Nasdaq Mini Futures COT ChartThe Nasdaq Mini large speculator standing this week reached a net position of 5,458 contracts in the data reported through Tuesday. This was a weekly decline of -11,784 contracts from the previous week which had a total of 17,242 net contracts.

This week’s current strength score (the trader positioning range over the past three years, measured from 0 to 100) shows the speculators are currently Bullish-Extreme with a score of 80.3 percent. The commercials are Bearish with a score of 20.2 percent and the small traders (not shown in chart) are Bullish with a score of 50.4 percent.

Price Trend-Following Model: Uptrend

Our weekly trend-following model classifies the current market price position as: Uptrend. The current action for the model is considered to be: Hold – Maintain Long Position.

Nasdaq Mini Futures StatisticsSPECULATORSCOMMERCIALSSMALL TRADERS
– Percent of Open Interest Longs:28.452.816.1
– Percent of Open Interest Shorts:26.254.316.7
– Net Position:5,458-3,883-1,575
– Gross Longs:70,707131,22340,005
– Gross Shorts:65,249135,10641,580
– Long to Short Ratio:1.1 to 11.0 to 11.0 to 1
NET POSITION TREND:
– Strength Index Score (3 Year Range Pct):80.320.250.4
– Strength Index Reading (3 Year Range):Bullish-ExtremeBearishBullish
NET POSITION MOVEMENT INDEX:
– 6-Week Change in Strength Index:-5.21.213.6


Russell 2000 Mini Futures:

Russell 2000 Mini Futures COT ChartThe Russell 2000 Mini large speculator standing this week reached a net position of -67,510 contracts in the data reported through Tuesday. This was a weekly decline of -3,810 contracts from the previous week which had a total of -63,700 net contracts.

This week’s current strength score (the trader positioning range over the past three years, measured from 0 to 100) shows the speculators are currently Bearish with a score of 31.5 percent. The commercials are Bullish with a score of 66.4 percent and the small traders (not shown in chart) are Bearish with a score of 37.9 percent.

Price Trend-Following Model: Strong Uptrend

Our weekly trend-following model classifies the current market price position as: Strong Uptrend. The current action for the model is considered to be: New Buy – Long Position.

Russell 2000 Mini Futures StatisticsSPECULATORSCOMMERCIALSSMALL TRADERS
– Percent of Open Interest Longs:10.383.54.7
– Percent of Open Interest Shorts:23.471.14.0
– Net Position:-67,51063,8563,654
– Gross Longs:52,926429,65624,280
– Gross Shorts:120,436365,80020,626
– Long to Short Ratio:0.4 to 11.2 to 11.2 to 1
NET POSITION TREND:
– Strength Index Score (3 Year Range Pct):31.566.437.9
– Strength Index Reading (3 Year Range):BearishBullishBearish
NET POSITION MOVEMENT INDEX:
– 6-Week Change in Strength Index:-11.24.731.4


Nikkei Stock Average (USD) Futures:

Nikkei Stock Average (USD) Futures COT ChartThe Nikkei Stock Average (USD) large speculator standing this week reached a net position of -6,185 contracts in the data reported through Tuesday. This was a weekly gain of 61 contracts from the previous week which had a total of -6,246 net contracts.

This week’s current strength score (the trader positioning range over the past three years, measured from 0 to 100) shows the speculators are currently Bearish with a score of 28.7 percent. The commercials are Bullish with a score of 64.3 percent and the small traders (not shown in chart) are Bearish with a score of 47.3 percent.

Price Trend-Following Model: Uptrend

Our weekly trend-following model classifies the current market price position as: Uptrend. The current action for the model is considered to be: Hold – Maintain Long Position.

Nikkei Stock Average Futures StatisticsSPECULATORSCOMMERCIALSSMALL TRADERS
– Percent of Open Interest Longs:8.963.627.5
– Percent of Open Interest Shorts:46.735.118.2
– Net Position:-6,1854,6711,514
– Gross Longs:1,46010,4074,492
– Gross Shorts:7,6455,7362,978
– Long to Short Ratio:0.2 to 11.8 to 11.5 to 1
NET POSITION TREND:
– Strength Index Score (3 Year Range Pct):28.764.347.3
– Strength Index Reading (3 Year Range):BearishBullishBearish
NET POSITION MOVEMENT INDEX:
– 6-Week Change in Strength Index:-4.4-1.411.4


MSCI EAFE Mini Futures:

MSCI EAFE Mini Futures COT ChartThe MSCI EAFE Mini large speculator standing this week reached a net position of -11,743 contracts in the data reported through Tuesday. This was a weekly rise of 4,241 contracts from the previous week which had a total of -15,984 net contracts.

This week’s current strength score (the trader positioning range over the past three years, measured from 0 to 100) shows the speculators are currently Bearish with a score of 29.9 percent. The commercials are Bullish with a score of 70.8 percent and the small traders (not shown in chart) are Bearish with a score of 26.9 percent.

Price Trend-Following Model: Weak Uptrend

Our weekly trend-following model classifies the current market price position as: Weak Uptrend. The current action for the model is considered to be: Hold – Maintain Long Position.

MSCI EAFE Mini Futures StatisticsSPECULATORSCOMMERCIALSSMALL TRADERS
– Percent of Open Interest Longs:6.590.72.1
– Percent of Open Interest Shorts:9.588.21.6
– Net Position:-11,7439,7691,974
– Gross Longs:25,587356,5048,292
– Gross Shorts:37,330346,7356,318
– Long to Short Ratio:0.7 to 11.0 to 11.3 to 1
NET POSITION TREND:
– Strength Index Score (3 Year Range Pct):29.970.826.9
– Strength Index Reading (3 Year Range):BearishBullishBearish
NET POSITION MOVEMENT INDEX:
– 6-Week Change in Strength Index:10.7-7.0-14.4


Article By InvestMacroReceive our weekly COT Newsletter

*COT Report: The COT data, released weekly to the public each Friday, is updated through the most recent Tuesday (data is 3 days old) and shows a quick view of how large speculators or non-commercials (for-profit traders) were positioned in the futures markets.

The CFTC categorizes trader positions according to commercial hedgers (traders who use futures contracts for hedging as part of the business), non-commercials (large traders who speculate to realize trading profits) and nonreportable traders (usually small traders/speculators) as well as their open interest (contracts open in the market at time of reporting). See CFTC criteria here.

COT Soft Commodities Charts: Speculator bets led by Soybean Oil & Lean Hogs

By InvestMacro

Here are the latest charts and statistics for the Commitment of Traders (COT) reports data published by the Commodities Futures Trading Commission (CFTC).

The latest COT data is updated through Tuesday July 3rd and shows a quick view of how large traders (for-profit speculators and commercial entities) were positioned in the futures markets.

Weekly Speculator Changes led by Soybean Oil & Lean Hogs

The COT soft commodities markets speculator bets were lower this week as five out of the eleven softs markets we cover had higher positioning while the other six markets had lower speculator contracts.

Leading the gains for the softs markets was Soybean Oil (7,992 contracts) with Lean Hogs (4,006 contracts), Live Cattle (2,354 contracts), Wheat (1,713 contracts) and Cocoa (1,032 contracts) also showing positive weeks.

The markets with the declines in speculator bets this week were Corn (-67,035 contracts) with Sugar (-20,806 contracts), Coffee (-18,522 contracts), Soybeans (-10,876 contracts), Cotton (-8,336 contracts) and Soybean Meal (-3,275 contracts) also registering lower bets on the week.


Data Snapshot of Commodity Market Traders | Columns Legend
Jul-03-2023OIOI-IndexSpec-NetSpec-IndexCom-NetCOM-IndexSmalls-NetSmalls-Index
WTI Crude1,816,04337141,4291-170,1489928,71937
Gold448,06312163,09749-184,7175321,62034
Silver114,421017,99044-29,5695811,57931
Copper204,399461,88832-4,003682,11532
Palladium14,781100-7,89008,358100-46814
Platinum69,383708,06734-13,570655,50342
Natural Gas1,241,41957-98,7753368,3136730,46252
Brent127,0191-39,8733438,114701,75933
Heating Oil305,6813827,69978-41,8104014,11147
Soybeans610,352890,97325-71,92472-19,04955
Corn1,246,983846,4032852476-46,92746
Coffee180,11838,49536-8,05268-4437
Sugar863,84340199,36861-229,7133930,34542
Wheat297,9337-45,4643451,05370-5,58954


Strength Scores led by Cocoa & Live Cattle

COT Strength Scores (a normalized measure of Speculator positions over a 3-Year range, from 0 to 100 where above 80 is Extreme-Bullish and below 20 is Extreme-Bearish) showed that Cocoa (94 percent) and Live Cattle (93 percent) lead the softs markets this week and are in Bullish-Extreme levels. Sugar (61 percent), Soybean Meal (55 percent) and Soybean Oil (42 percent) come in as the next highest in the weekly strength scores.

On the downside, Cotton (7 percent) and Lean Hogs (19 percent) come in at the lowest strength levels currently and are in Extreme-Bearish territory (below 20 percent).

Strength Statistics:
Corn (28.1 percent) vs Corn previous week (37.8 percent)
Sugar (61.4 percent) vs Sugar previous week (68.7 percent)
Coffee (36.1 percent) vs Coffee previous week (61.8 percent)
Soybeans (24.9 percent) vs Soybeans previous week (29.2 percent)
Soybean Oil (41.8 percent) vs Soybean Oil previous week (37.2 percent)
Soybean Meal (54.9 percent) vs Soybean Meal previous week (56.7 percent)
Live Cattle (92.7 percent) vs Live Cattle previous week (90.1 percent)
Lean Hogs (19.3 percent) vs Lean Hogs previous week (16.1 percent)
Cotton (7.5 percent) vs Cotton previous week (13.7 percent)
Cocoa (94.4 percent) vs Cocoa previous week (93.3 percent)
Wheat (34.5 percent) vs Wheat previous week (33.3 percent)


Soybean Oil & Wheat top the 6-Week Strength Trends

COT Strength Score Trends (or move index, calculates the 6-week changes in strength scores) showed that Soybean Oil (40 percent) and Wheat (29 percent) lead the past six weeks trends for soft commodities. Soybeans (24 percent), Lean Hogs (17 percent) and Corn (16 percent) are the next highest positive movers in the latest trends data.

Sugar (-26 percent) leads the downside trend scores currently with Coffee (-23 percent), Soybean Meal (-8 percent) and Cotton (-2 percent) following next with lower trend scores.

Strength Trend Statistics:
Corn (15.6 percent) vs Corn previous week (23.2 percent)
Sugar (-26.4 percent) vs Sugar previous week (-17.9 percent)
Coffee (-23.1 percent) vs Coffee previous week (-0.0 percent)
Soybeans (24.3 percent) vs Soybeans previous week (25.0 percent)
Soybean Oil (39.8 percent) vs Soybean Oil previous week (36.1 percent)
Soybean Meal (-7.8 percent) vs Soybean Meal previous week (-7.3 percent)
Live Cattle (4.1 percent) vs Live Cattle previous week (1.0 percent)
Lean Hogs (17.5 percent) vs Lean Hogs previous week (10.0 percent)
Cotton (-2.4 percent) vs Cotton previous week (4.1 percent)
Cocoa (7.6 percent) vs Cocoa previous week (7.9 percent)
Wheat (29.0 percent) vs Wheat previous week (24.3 percent)


Individual Soft Commodities Markets:

CORN Futures:

CORN Futures COT ChartThe CORN large speculator standing this week recorded a net position of 46,403 contracts in the data reported through Tuesday. This was a weekly reduction of -67,035 contracts from the previous week which had a total of 113,438 net contracts.

This week’s current strength score (the trader positioning range over the past three years, measured from 0 to 100) shows the speculators are currently Bearish with a score of 28.1 percent. The commercials are Bullish with a score of 76.2 percent and the small traders (not shown in chart) are Bearish with a score of 46.5 percent.

Price Trend-Following Model: Strong Downtrend

Our weekly trend-following model classifies the current market price position as: Strong Downtrend. The current action for the model is considered to be: Hold – Maintain Short Position.

CORN Futures StatisticsSPECULATORSCOMMERCIALSSMALL TRADERS
– Percent of Open Interest Longs:21.749.09.8
– Percent of Open Interest Shorts:18.048.913.6
– Net Position:46,403524-46,927
– Gross Longs:270,772610,770122,354
– Gross Shorts:224,369610,246169,281
– Long to Short Ratio:1.2 to 11.0 to 10.7 to 1
NET POSITION TREND:
– Strength Index Score (3 Year Range Pct):28.176.246.5
– Strength Index Reading (3 Year Range):BearishBullishBearish
NET POSITION MOVEMENT INDEX:
– 6-Week Change in Strength Index:15.6-17.49.0


SUGAR Futures:

SUGAR Futures COT ChartThe SUGAR large speculator standing this week recorded a net position of 199,368 contracts in the data reported through Tuesday. This was a weekly reduction of -20,806 contracts from the previous week which had a total of 220,174 net contracts.

This week’s current strength score (the trader positioning range over the past three years, measured from 0 to 100) shows the speculators are currently Bullish with a score of 61.4 percent. The commercials are Bearish with a score of 39.5 percent and the small traders (not shown in chart) are Bearish with a score of 41.9 percent.

Price Trend-Following Model: Uptrend

Our weekly trend-following model classifies the current market price position as: Uptrend. The current action for the model is considered to be: Hold – Maintain Long Position.

SUGAR Futures StatisticsSPECULATORSCOMMERCIALSSMALL TRADERS
– Percent of Open Interest Longs:32.543.38.6
– Percent of Open Interest Shorts:9.469.95.1
– Net Position:199,368-229,71330,345
– Gross Longs:280,634374,26274,497
– Gross Shorts:81,266603,97544,152
– Long to Short Ratio:3.5 to 10.6 to 11.7 to 1
NET POSITION TREND:
– Strength Index Score (3 Year Range Pct):61.439.541.9
– Strength Index Reading (3 Year Range):BullishBearishBearish
NET POSITION MOVEMENT INDEX:
– 6-Week Change in Strength Index:-26.428.5-25.2


COFFEE Futures:

COFFEE Futures COT ChartThe COFFEE large speculator standing this week recorded a net position of 8,495 contracts in the data reported through Tuesday. This was a weekly decline of -18,522 contracts from the previous week which had a total of 33,494 net contracts.

This week’s current strength score (the trader positioning range over the past three years, measured from 0 to 100) shows the speculators are currently Bearish with a score of 36.1 percent. The commercials are Bullish with a score of 67.9 percent and the small traders (not shown in chart) are Bearish-Extreme with a score of 7.3 percent.

Price Trend-Following Model: Uptrend

Our weekly trend-following model classifies the current market price position as: Uptrend. The current action for the model is considered to be: Hold – Maintain Long Position.

COFFEE Futures StatisticsSPECULATORSCOMMERCIALSSMALL TRADERS
– Percent of Open Interest Longs:23.447.03.7
– Percent of Open Interest Shorts:18.751.43.9
– Net Position:8,495-8,052-443
– Gross Longs:42,19084,6066,662
– Gross Shorts:33,69592,6587,105
– Long to Short Ratio:1.3 to 10.9 to 10.9 to 1
NET POSITION TREND:
– Strength Index Score (3 Year Range Pct):36.167.97.3
– Strength Index Reading (3 Year Range):BearishBullishBearish-Extreme
NET POSITION MOVEMENT INDEX:
– 6-Week Change in Strength Index:-23.124.0-19.8


SOYBEANS Futures:

SOYBEANS Futures COT ChartThe SOYBEANS large speculator standing this week recorded a net position of 90,973 contracts in the data reported through Tuesday. This was a weekly lowering of -10,876 contracts from the previous week which had a total of 101,849 net contracts.

This week’s current strength score (the trader positioning range over the past three years, measured from 0 to 100) shows the speculators are currently Bearish with a score of 24.9 percent. The commercials are Bullish with a score of 72.0 percent and the small traders (not shown in chart) are Bullish with a score of 55.3 percent.

Price Trend-Following Model: Weak Downtrend

Our weekly trend-following model classifies the current market price position as: Weak Downtrend. The current action for the model is considered to be: Hold – Maintain Short Position.

SOYBEANS Futures StatisticsSPECULATORSCOMMERCIALSSMALL TRADERS
– Percent of Open Interest Longs:27.950.27.1
– Percent of Open Interest Shorts:13.062.010.2
– Net Position:90,973-71,924-19,049
– Gross Longs:170,206306,59843,239
– Gross Shorts:79,233378,52262,288
– Long to Short Ratio:2.1 to 10.8 to 10.7 to 1
NET POSITION TREND:
– Strength Index Score (3 Year Range Pct):24.972.055.3
– Strength Index Reading (3 Year Range):BearishBullishBullish
NET POSITION MOVEMENT INDEX:
– 6-Week Change in Strength Index:24.3-24.117.8


SOYBEAN OIL Futures:

SOYBEAN OIL Futures COT ChartThe SOYBEAN OIL large speculator standing this week recorded a net position of 40,809 contracts in the data reported through Tuesday. This was a weekly increase of 7,992 contracts from the previous week which had a total of 32,817 net contracts.

This week’s current strength score (the trader positioning range over the past three years, measured from 0 to 100) shows the speculators are currently Bearish with a score of 41.8 percent. The commercials are Bullish with a score of 57.7 percent and the small traders (not shown in chart) are Bearish with a score of 40.5 percent.

Price Trend-Following Model: Strong Uptrend

Our weekly trend-following model classifies the current market price position as: Strong Uptrend. The current action for the model is considered to be: New Buy – Long Position.

SOYBEAN OIL Futures StatisticsSPECULATORSCOMMERCIALSSMALL TRADERS
– Percent of Open Interest Longs:17.656.96.6
– Percent of Open Interest Shorts:9.266.85.1
– Net Position:40,809-48,0287,219
– Gross Longs:85,067274,38532,017
– Gross Shorts:44,258322,41324,798
– Long to Short Ratio:1.9 to 10.9 to 11.3 to 1
NET POSITION TREND:
– Strength Index Score (3 Year Range Pct):41.857.740.5
– Strength Index Reading (3 Year Range):BearishBullishBearish
NET POSITION MOVEMENT INDEX:
– 6-Week Change in Strength Index:39.8-39.830.8


SOYBEAN MEAL Futures:

SOYBEAN MEAL Futures COT ChartThe SOYBEAN MEAL large speculator standing this week recorded a net position of 95,998 contracts in the data reported through Tuesday. This was a weekly fall of -3,275 contracts from the previous week which had a total of 99,273 net contracts.

This week’s current strength score (the trader positioning range over the past three years, measured from 0 to 100) shows the speculators are currently Bullish with a score of 54.9 percent. The commercials are Bearish with a score of 48.9 percent and the small traders (not shown in chart) are Bearish-Extreme with a score of 14.0 percent.

Price Trend-Following Model: Downtrend

Our weekly trend-following model classifies the current market price position as: Downtrend. The current action for the model is considered to be: Hold – Maintain Short Position.

SOYBEAN MEAL Futures StatisticsSPECULATORSCOMMERCIALSSMALL TRADERS
– Percent of Open Interest Longs:24.637.99.0
– Percent of Open Interest Shorts:4.660.66.3
– Net Position:95,998-109,01213,014
– Gross Longs:118,320182,43143,129
– Gross Shorts:22,322291,44330,115
– Long to Short Ratio:5.3 to 10.6 to 11.4 to 1
NET POSITION TREND:
– Strength Index Score (3 Year Range Pct):54.948.914.0
– Strength Index Reading (3 Year Range):BullishBearishBearish-Extreme
NET POSITION MOVEMENT INDEX:
– 6-Week Change in Strength Index:-7.86.114.0


LIVE CATTLE Futures:

LIVE CATTLE Futures COT ChartThe LIVE CATTLE large speculator standing this week recorded a net position of 105,443 contracts in the data reported through Tuesday. This was a weekly boost of 2,354 contracts from the previous week which had a total of 103,089 net contracts.

This week’s current strength score (the trader positioning range over the past three years, measured from 0 to 100) shows the speculators are currently Bullish-Extreme with a score of 92.7 percent. The commercials are Bearish-Extreme with a score of 10.3 percent and the small traders (not shown in chart) are Bearish-Extreme with a score of 14.7 percent.

Price Trend-Following Model: Uptrend

Our weekly trend-following model classifies the current market price position as: Uptrend. The current action for the model is considered to be: Hold – Maintain Long Position.

LIVE CATTLE Futures StatisticsSPECULATORSCOMMERCIALSSMALL TRADERS
– Percent of Open Interest Longs:44.429.08.0
– Percent of Open Interest Shorts:13.955.611.9
– Net Position:105,443-92,019-13,424
– Gross Longs:153,517100,08927,594
– Gross Shorts:48,074192,10841,018
– Long to Short Ratio:3.2 to 10.5 to 10.7 to 1
NET POSITION TREND:
– Strength Index Score (3 Year Range Pct):92.710.314.7
– Strength Index Reading (3 Year Range):Bullish-ExtremeBearish-ExtremeBearish-Extreme
NET POSITION MOVEMENT INDEX:
– 6-Week Change in Strength Index:4.1-2.6-9.3


LEAN HOGS Futures:

LEAN HOGS Futures COT ChartThe LEAN HOGS large speculator standing this week recorded a net position of -12,574 contracts in the data reported through Tuesday. This was a weekly rise of 4,006 contracts from the previous week which had a total of -16,580 net contracts.

This week’s current strength score (the trader positioning range over the past three years, measured from 0 to 100) shows the speculators are currently Bearish-Extreme with a score of 19.3 percent. The commercials are Bullish-Extreme with a score of 83.6 percent and the small traders (not shown in chart) are Bullish with a score of 73.2 percent.

Price Trend-Following Model: Strong Uptrend

Our weekly trend-following model classifies the current market price position as: Strong Uptrend. The current action for the model is considered to be: Hold – Maintain Long Position.

LEAN HOGS Futures StatisticsSPECULATORSCOMMERCIALSSMALL TRADERS
– Percent of Open Interest Longs:29.239.49.3
– Percent of Open Interest Shorts:35.532.010.4
– Net Position:-12,57414,847-2,273
– Gross Longs:58,15178,65818,525
– Gross Shorts:70,72563,81120,798
– Long to Short Ratio:0.8 to 11.2 to 10.9 to 1
NET POSITION TREND:
– Strength Index Score (3 Year Range Pct):19.383.673.2
– Strength Index Reading (3 Year Range):Bearish-ExtremeBullish-ExtremeBullish
NET POSITION MOVEMENT INDEX:
– 6-Week Change in Strength Index:17.5-13.9-25.6


COTTON Futures:

COTTON Futures COT ChartThe COTTON large speculator standing this week recorded a net position of -1,678 contracts in the data reported through Tuesday. This was a weekly fall of -8,336 contracts from the previous week which had a total of 6,658 net contracts.

This week’s current strength score (the trader positioning range over the past three years, measured from 0 to 100) shows the speculators are currently Bearish-Extreme with a score of 7.5 percent. The commercials are Bullish-Extreme with a score of 91.9 percent and the small traders (not shown in chart) are Bearish-Extreme with a score of 12.1 percent.

Price Trend-Following Model: Strong Uptrend

Our weekly trend-following model classifies the current market price position as: Strong Uptrend. The current action for the model is considered to be: Hold – Maintain Long Position.

COTTON Futures StatisticsSPECULATORSCOMMERCIALSSMALL TRADERS
– Percent of Open Interest Longs:30.950.96.7
– Percent of Open Interest Shorts:31.949.57.0
– Net Position:-1,6782,320-642
– Gross Longs:53,59788,18411,530
– Gross Shorts:55,27585,86412,172
– Long to Short Ratio:1.0 to 11.0 to 10.9 to 1
NET POSITION TREND:
– Strength Index Score (3 Year Range Pct):7.591.912.1
– Strength Index Reading (3 Year Range):Bearish-ExtremeBullish-ExtremeBearish-Extreme
NET POSITION MOVEMENT INDEX:
– 6-Week Change in Strength Index:-2.42.8-5.7


COCOA Futures:

COCOA Futures COT ChartThe COCOA large speculator standing this week recorded a net position of 72,584 contracts in the data reported through Tuesday. This was a weekly rise of 1,032 contracts from the previous week which had a total of 71,552 net contracts.

This week’s current strength score (the trader positioning range over the past three years, measured from 0 to 100) shows the speculators are currently Bullish-Extreme with a score of 94.4 percent. The commercials are Bearish-Extreme with a score of 7.0 percent and the small traders (not shown in chart) are Bearish with a score of 26.6 percent.

Price Trend-Following Model: Uptrend

Our weekly trend-following model classifies the current market price position as: Uptrend. The current action for the model is considered to be: Hold – Maintain Long Position.

COCOA Futures StatisticsSPECULATORSCOMMERCIALSSMALL TRADERS
– Percent of Open Interest Longs:43.826.14.1
– Percent of Open Interest Shorts:22.848.03.2
– Net Position:72,584-75,5943,010
– Gross Longs:151,31990,38114,031
– Gross Shorts:78,735165,97511,021
– Long to Short Ratio:1.9 to 10.5 to 11.3 to 1
NET POSITION TREND:
– Strength Index Score (3 Year Range Pct):94.47.026.6
– Strength Index Reading (3 Year Range):Bullish-ExtremeBearish-ExtremeBearish
NET POSITION MOVEMENT INDEX:
– 6-Week Change in Strength Index:7.6-5.1-23.7


WHEAT Futures:

WHEAT Futures COT ChartThe WHEAT large speculator standing this week recorded a net position of -45,464 contracts in the data reported through Tuesday. This was a weekly increase of 1,713 contracts from the previous week which had a total of -47,177 net contracts.

This week’s current strength score (the trader positioning range over the past three years, measured from 0 to 100) shows the speculators are currently Bearish with a score of 34.5 percent. The commercials are Bullish with a score of 69.7 percent and the small traders (not shown in chart) are Bullish with a score of 53.9 percent.

Price Trend-Following Model: Downtrend

Our weekly trend-following model classifies the current market price position as: Downtrend. The current action for the model is considered to be: Hold – Maintain Short Position.

WHEAT Futures StatisticsSPECULATORSCOMMERCIALSSMALL TRADERS
– Percent of Open Interest Longs:28.041.49.2
– Percent of Open Interest Shorts:43.324.311.1
– Net Position:-45,46451,053-5,589
– Gross Longs:83,554123,40027,557
– Gross Shorts:129,01872,34733,146
– Long to Short Ratio:0.6 to 11.7 to 10.8 to 1
NET POSITION TREND:
– Strength Index Score (3 Year Range Pct):34.569.753.9
– Strength Index Reading (3 Year Range):BearishBullishBullish
NET POSITION MOVEMENT INDEX:
– 6-Week Change in Strength Index:29.0-23.6-38.9


Article By InvestMacroReceive our weekly COT Newsletter

*COT Report: The COT data, released weekly to the public each Friday, is updated through the most recent Tuesday (data is 3 days old) and shows a quick view of how large speculators or non-commercials (for-profit traders) were positioned in the futures markets.

The CFTC categorizes trader positions according to commercial hedgers (traders who use futures contracts for hedging as part of the business), non-commercials (large traders who speculate to realize trading profits) and nonreportable traders (usually small traders/speculators) as well as their open interest (contracts open in the market at time of reporting). See CFTC criteria here.

British Pound Speculators sharply boosted bullish bets on BOE rate hike

By InvestMacro

Here are the latest charts and statistics for the Commitment of Traders (COT) data published by the Commodities Futures Trading Commission (CFTC).

The latest COT data is updated through Tuesday June 20th and shows a quick view of how large market participants (for-profit speculators and commercial traders) were positioned in the futures markets. All currency positions are in direct relation to the US dollar where, for example, a bet for the euro is a bet that the euro will rise versus the dollar while a bet against the euro will be a bet that the euro will decline versus the dollar.

Weekly Speculator Changes led by British Pound & Mexican Peso

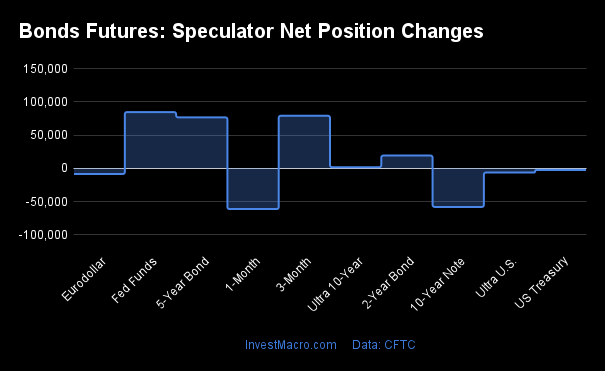
The COT currency market speculator bets were higher this week as six out of the eleven currency markets we cover had higher positioning while the other five markets had lower speculator contracts.

Leading the gains for the currency markets was the British Pound (39,873 contracts) with the Mexican Peso (20,883 contracts), the Australian Dollar (12,129 contracts), Canadian Dollar (3,125 contracts), Swiss Franc (192 contracts) and the US Dollar Index (863 contracts) also showing positive weeks.

The currencies seeing declines in speculator bets on the week were the EuroFX (-7,173 contracts) with the Japanese Yen (-3,680 contracts), the New Zealand Dollar (-1,828 contracts), the Brazilian Real (-254 contracts) and Bitcoin (-346 contracts) also registering lower bets on the week.

British Pound Speculators sharply boosted bullish bets on BOE rate hike

Highlighting the COT currency’s data this week was this week’s sharp boost in the speculator’s positioning of the British Pound Sterling. Large speculative Pound positions jumped by over +39,000 contracts this week and halted a two-week streak of declines.

The Pound weekly positions rise was the largest one-week increase on record, according to the CFTC data that goes back to 1988. The gain has pushed the overall net position now to over +46,608 contracts and the highest standing since April 17th of 2018, a span of 270 weeks.

The Pound’s positioning was helped out by the anticipation of the Bank of England’s latest interest rate increase that was by 50 basis points on Thursday. This brought the bank rate to 5 percent and its highest sitting in the past 15 years.

The Pound Sterling exchange rate against the US Dollar reacted strongly and touched it’s highest level (1.2874) since April of 2022 after the interest rate announcement. However, the Pound closed out Thursday and Friday lower with the weekly close at the 1.2714 exchange rate.


Data Snapshot of Forex Market Traders | Columns Legend
Jun-20-2023OIOI-IndexSpec-NetSpec-IndexCom-NetCOM-IndexSmalls-NetSmalls-Index
USD Index27,3061714,86150-16,574491,71335
EUR732,97964144,64974-192,7232548,07456
GBP226,5055346,608100-59,003012,39582
JPY238,55671-107,6563118,27293-10,61632
CHF36,12822-4,851425,23654-38556
CAD184,10651-33,5432318,7586914,78556
AUD149,89844-49,6163950,98657-1,37049
NZD32,40113-2,659464,44157-1,78229
MXN224,8974699,718100-103,04003,32232
RUB20,93047,54331-7,15069-39324
BRL52,9914325,90269-23,41836-2,48424
Bitcoin15,6877839784-927053025


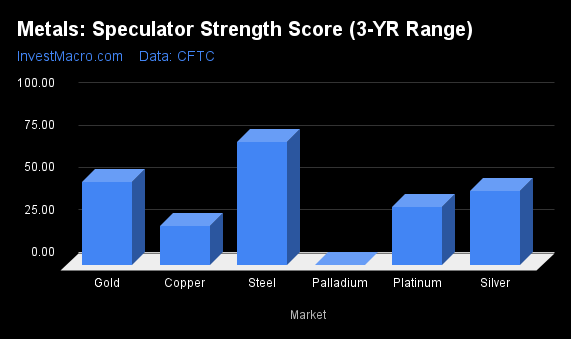
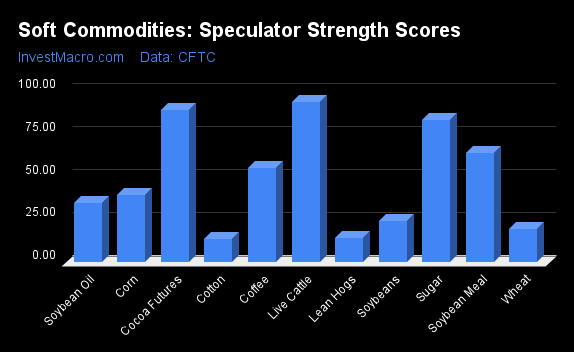
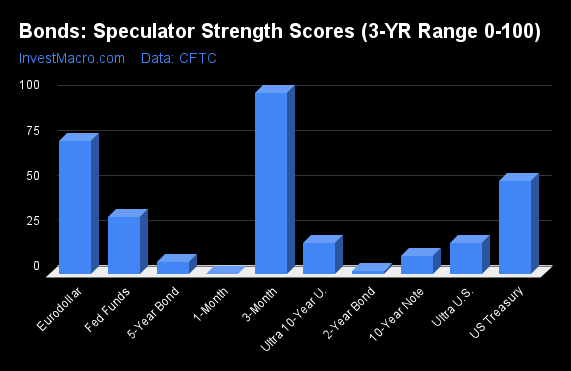
Strength Scores led by British Pound & Mexican Peso

COT Strength Scores (a normalized measure of Speculator positions over a 3-Year range, from 0 to 100 where above 80 is Extreme-Bullish and below 20 is Extreme-Bearish) showed that the British Pound (100 percent) and the Mexican Peso (100 percent) lead the currency markets this week. Bitcoin (84 percent), EuroFX (74 percent) and the Brazilian Real (69 percent) come in as the next highest in the weekly strength scores.

On the downside, the Japanese Yen (3 percent) and the comes in at the lowest strength level currently and is in Extreme-Bearish territory (below 20 percent). The next lowest strength scores are the Canadian Dollar (23 percent), Australian Dollar (39 percent) and the Swiss Franc (42 percent).

Strength Statistics:
US Dollar Index (49.7 percent) vs US Dollar Index previous week (48.3 percent)
EuroFX (74.1 percent) vs EuroFX previous week (76.9 percent)
British Pound Sterling (100.0 percent) vs British Pound Sterling previous week (68.6 percent)
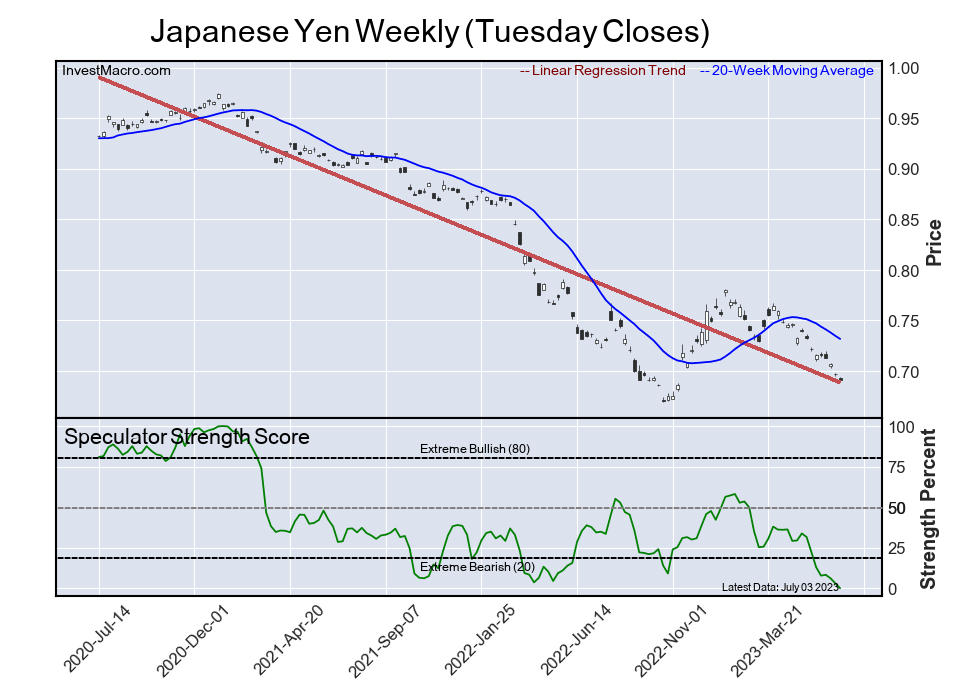
Japanese Yen (2.6 percent) vs Japanese Yen previous week (4.8 percent)
Swiss Franc (41.8 percent) vs Swiss Franc previous week (41.3 percent)
Canadian Dollar (23.3 percent) vs Canadian Dollar previous week (20.4 percent)
Australian Dollar (38.8 percent) vs Australian Dollar previous week (27.6 percent)
New Zealand Dollar (46.4 percent) vs New Zealand Dollar previous week (51.3 percent)
Mexican Peso (100.0 percent) vs Mexican Peso previous week (87.3 percent)
Brazilian Real (68.7 percent) vs Brazilian Real previous week (69.1 percent)
Bitcoin (83.9 percent) vs Bitcoin previous week (89.9 percent)


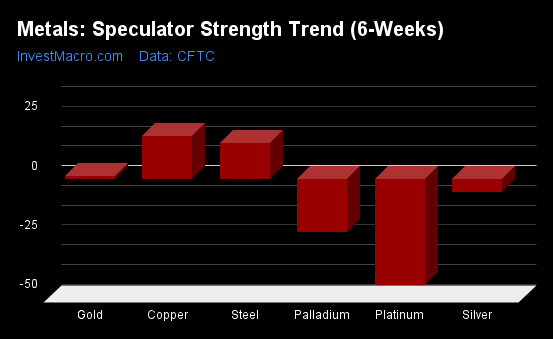
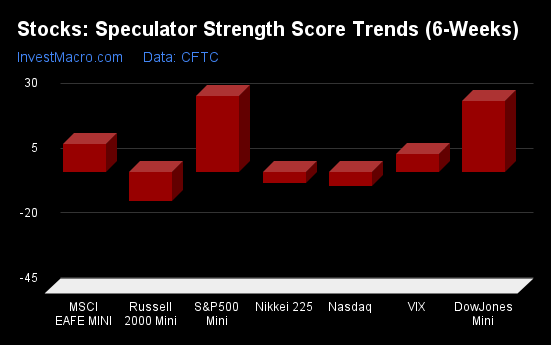
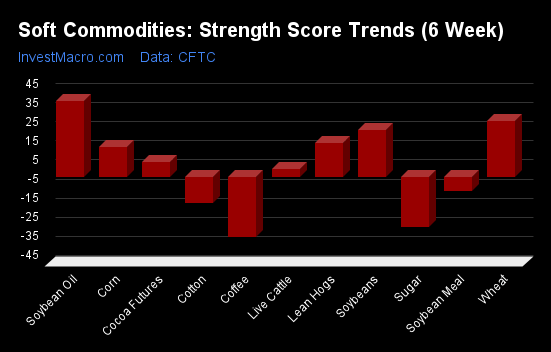
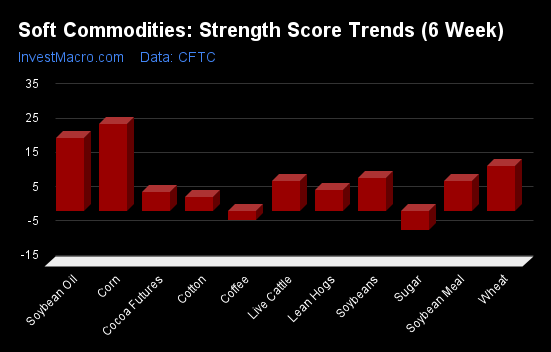
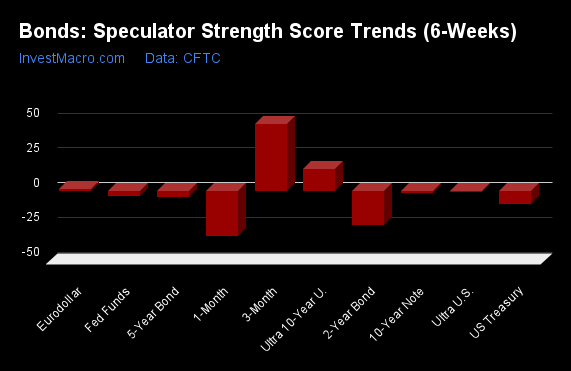
British Pound & Mexican Peso top the 6-Week Strength Trends

COT Strength Score Trends (or move index, calculates the 6-week changes in strength scores) showed that the British Pound (33 percent) and the Mexican Peso (18 percent) lead the past six weeks trends for the currencies. The Canadian Dollar (8 percent), the US Dollar Index (6 percent) and the New Zealand Dollar (5 percent) are the next highest positive movers in the latest trends data.

The Japanese Yen (-29 percent) leads the downside trend scores currently with the EuroFX (-13 percent) and the Brazilian Real (-11 percent) following next with lower trend scores.

Strength Trend Statistics:
US Dollar Index (6.2 percent) vs US Dollar Index previous week (4.4 percent)
EuroFX (-13.4 percent) vs EuroFX previous week (-8.4 percent)
British Pound Sterling (33.1 percent) vs British Pound Sterling previous week (4.5 percent)
Japanese Yen (-28.7 percent) vs Japanese Yen previous week (-22.0 percent)
Swiss Franc (-1.0 percent) vs Swiss Franc previous week (-5.4 percent)
Canadian Dollar (8.1 percent) vs Canadian Dollar previous week (12.5 percent)
Australian Dollar (-0.4 percent) vs Australian Dollar previous week (-15.5 percent)
New Zealand Dollar (5.2 percent) vs New Zealand Dollar previous week (2.9 percent)
Mexican Peso (18.1 percent) vs Mexican Peso previous week (12.9 percent)
Brazilian Real (-11.1 percent) vs Brazilian Real previous week (-11.8 percent)
Bitcoin (-0.5 percent) vs Bitcoin previous week (10.0 percent)


Individual COT Forex Markets:

US Dollar Index Futures:

US Dollar Index Forex Futures COT Chart
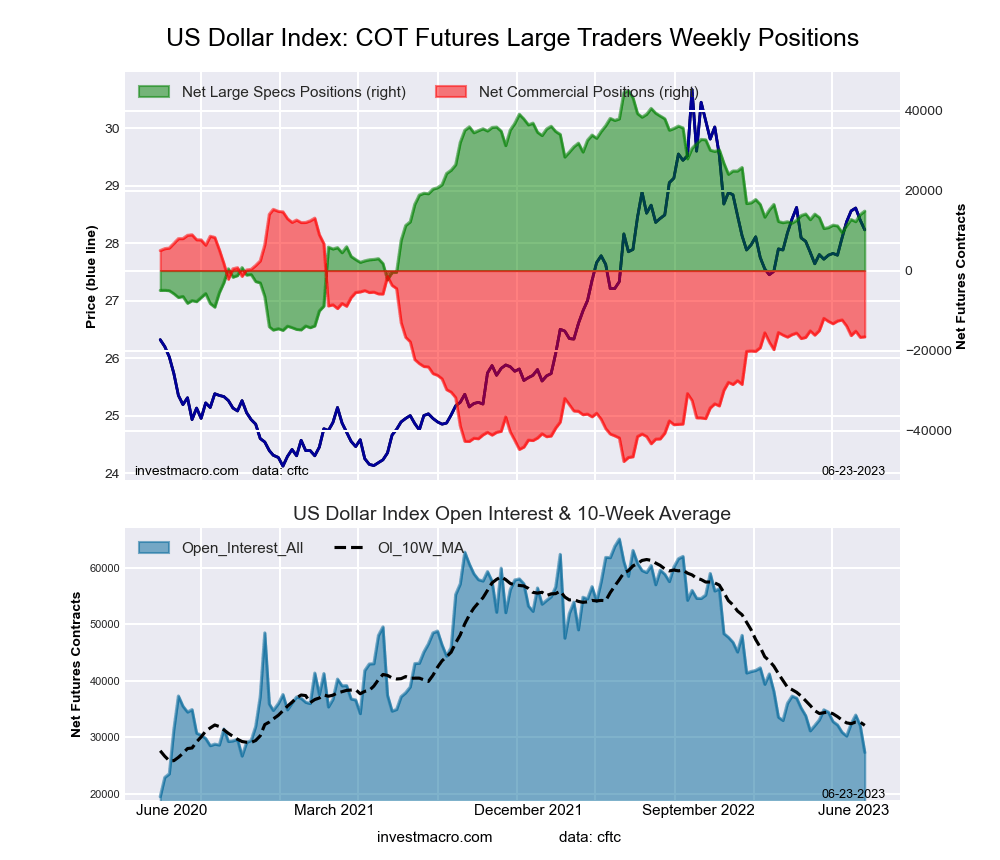
The US Dollar Index large speculator standing this week resulted in a net position of 14,861 contracts in the data reported through Tuesday. This was a weekly lift of 863 contracts from the previous week which had a total of 13,998 net contracts.

This week’s current strength score (the trader positioning range over the past three years, measured from 0 to 100) shows the speculators are currently Bearish with a score of 49.7 percent. The commercials are Bearish with a score of 49.4 percent and the small traders (not shown in chart) are Bearish with a score of 35.3 percent.

Price Trend-Following Model: Uptrend

Our weekly trend-following model classifies the current market price position as: Uptrend. The current action for the model is considered to be: Hold – Maintain Long Position.

US DOLLAR INDEX StatisticsSPECULATORSCOMMERCIALSSMALL TRADERS
– Percent of Open Interest Longs:76.83.115.8
– Percent of Open Interest Shorts:22.463.89.5
– Net Position:14,861-16,5741,713
– Gross Longs:20,9728354,318
– Gross Shorts:6,11117,4092,605
– Long to Short Ratio:3.4 to 10.0 to 11.7 to 1
NET POSITION TREND:
– Strength Index Score (3 Year Range Pct):49.749.435.3
– Strength Index Reading (3 Year Range):BearishBearishBearish
NET POSITION MOVEMENT INDEX:
– 6-Week Change in Strength Index:6.2-6.32.7


Euro Currency Futures:

Euro Currency Futures COT Chart
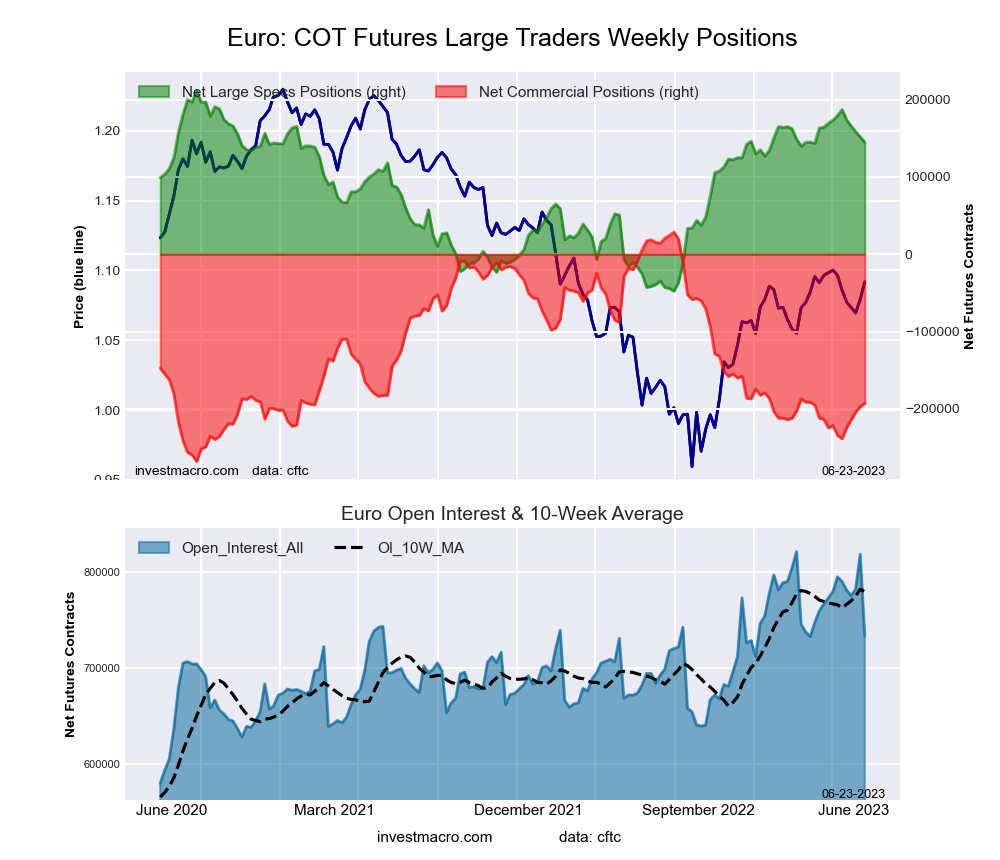
The Euro Currency large speculator standing this week resulted in a net position of 144,649 contracts in the data reported through Tuesday. This was a weekly reduction of -7,173 contracts from the previous week which had a total of 151,822 net contracts.

This week’s current strength score (the trader positioning range over the past three years, measured from 0 to 100) shows the speculators are currently Bullish with a score of 74.1 percent. The commercials are Bearish with a score of 25.4 percent and the small traders (not shown in chart) are Bullish with a score of 55.7 percent.

Price Trend-Following Model: Uptrend

Our weekly trend-following model classifies the current market price position as: Uptrend. The current action for the model is considered to be: Hold – Maintain Long Position.

EURO Currency StatisticsSPECULATORSCOMMERCIALSSMALL TRADERS
– Percent of Open Interest Longs:31.354.412.7
– Percent of Open Interest Shorts:11.680.76.1
– Net Position:144,649-192,72348,074
– Gross Longs:229,399398,64692,826
– Gross Shorts:84,750591,36944,752
– Long to Short Ratio:2.7 to 10.7 to 12.1 to 1
NET POSITION TREND:
– Strength Index Score (3 Year Range Pct):74.125.455.7
– Strength Index Reading (3 Year Range):BullishBearishBullish
NET POSITION MOVEMENT INDEX:
– 6-Week Change in Strength Index:-13.414.0-10.8


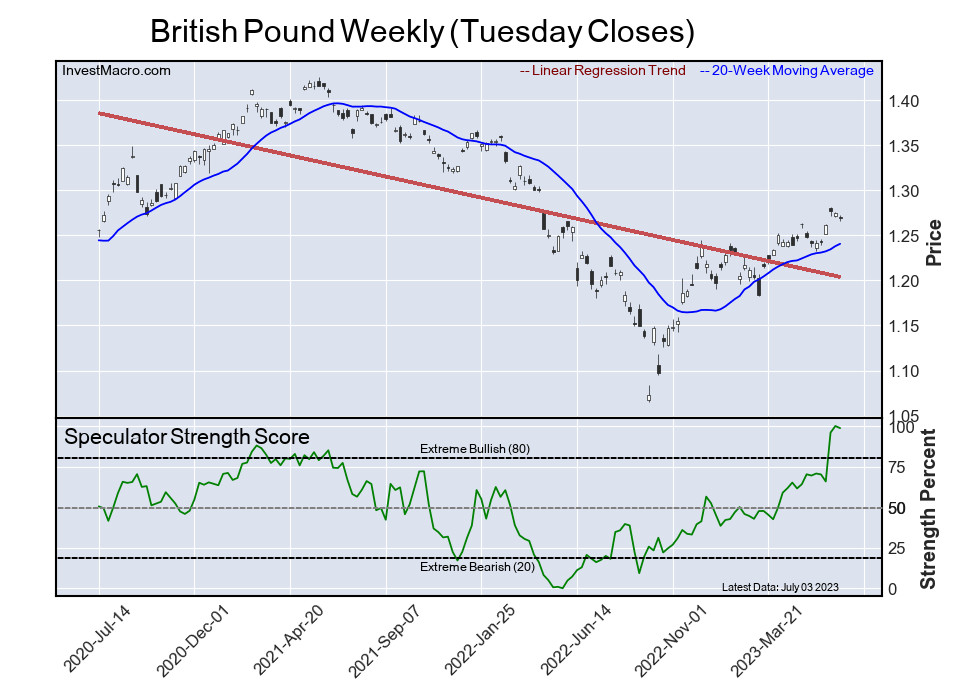
British Pound Sterling Futures:

British Pound Sterling Futures COT ChartThe British Pound Sterling large speculator standing this week resulted in a net position of 46,608 contracts in the data reported through Tuesday. This was a weekly lift of 39,873 contracts from the previous week which had a total of 6,735 net contracts.

This week’s current strength score (the trader positioning range over the past three years, measured from 0 to 100) shows the speculators are currently Bullish-Extreme with a score of 100.0 percent. The commercials are Bearish-Extreme with a score of 0.0 percent and the small traders (not shown in chart) are Bullish-Extreme with a score of 82.3 percent.

Price Trend-Following Model: Strong Uptrend

Our weekly trend-following model classifies the current market price position as: Strong Uptrend. The current action for the model is considered to be: Hold – Maintain Long Position.

BRITISH POUND StatisticsSPECULATORSCOMMERCIALSSMALL TRADERS
– Percent of Open Interest Longs:44.832.516.3
– Percent of Open Interest Shorts:24.358.610.8
– Net Position:46,608-59,00312,395
– Gross Longs:101,56773,69236,837
– Gross Shorts:54,959132,69524,442
– Long to Short Ratio:1.8 to 10.6 to 11.5 to 1
NET POSITION TREND:
– Strength Index Score (3 Year Range Pct):100.00.082.3
– Strength Index Reading (3 Year Range):Bullish-ExtremeBearish-ExtremeBullish-Extreme
NET POSITION MOVEMENT INDEX:
– 6-Week Change in Strength Index:33.1-30.410.6


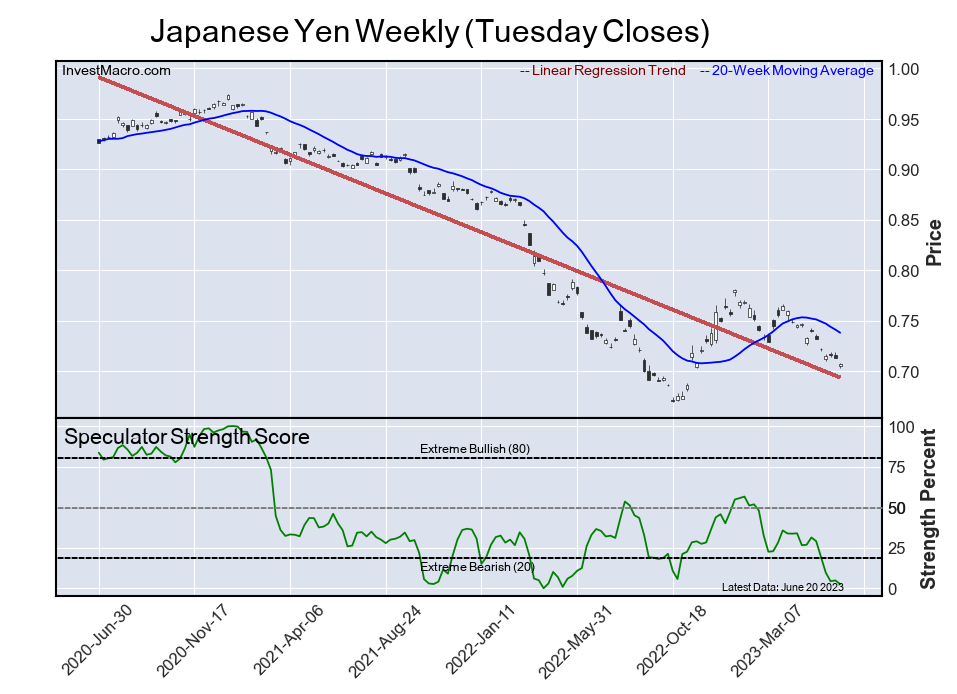
Japanese Yen Futures:

Japanese Yen Forex Futures COT ChartThe Japanese Yen large speculator standing this week resulted in a net position of -107,656 contracts in the data reported through Tuesday. This was a weekly fall of -3,680 contracts from the previous week which had a total of -103,976 net contracts.

This week’s current strength score (the trader positioning range over the past three years, measured from 0 to 100) shows the speculators are currently Bearish-Extreme with a score of 2.6 percent. The commercials are Bullish-Extreme with a score of 93.4 percent and the small traders (not shown in chart) are Bearish with a score of 31.9 percent.

Price Trend-Following Model: Strong Downtrend

Our weekly trend-following model classifies the current market price position as: Strong Downtrend. The current action for the model is considered to be: Hold – Maintain Short Position.

JAPANESE YEN StatisticsSPECULATORSCOMMERCIALSSMALL TRADERS
– Percent of Open Interest Longs:13.573.411.7
– Percent of Open Interest Shorts:58.623.916.2
– Net Position:-107,656118,272-10,616
– Gross Longs:32,244175,20127,983
– Gross Shorts:139,90056,92938,599
– Long to Short Ratio:0.2 to 13.1 to 10.7 to 1
NET POSITION TREND:
– Strength Index Score (3 Year Range Pct):2.693.431.9
– Strength Index Reading (3 Year Range):Bearish-ExtremeBullish-ExtremeBearish
NET POSITION MOVEMENT INDEX:
– 6-Week Change in Strength Index:-28.724.0-5.0


Swiss Franc Futures:

Swiss Franc Forex Futures COT ChartThe Swiss Franc large speculator standing this week resulted in a net position of -4,851 contracts in the data reported through Tuesday. This was a weekly rise of 192 contracts from the previous week which had a total of -5,043 net contracts.

This week’s current strength score (the trader positioning range over the past three years, measured from 0 to 100) shows the speculators are currently Bearish with a score of 41.8 percent. The commercials are Bullish with a score of 53.6 percent and the small traders (not shown in chart) are Bullish with a score of 56.2 percent.

Price Trend-Following Model: Uptrend

Our weekly trend-following model classifies the current market price position as: Uptrend. The current action for the model is considered to be: Hold – Maintain Long Position.

SWISS FRANC StatisticsSPECULATORSCOMMERCIALSSMALL TRADERS
– Percent of Open Interest Longs:23.043.133.7
– Percent of Open Interest Shorts:36.528.634.8
– Net Position:-4,8515,236-385
– Gross Longs:8,32215,58512,170
– Gross Shorts:13,17310,34912,555
– Long to Short Ratio:0.6 to 11.5 to 11.0 to 1
NET POSITION TREND:
– Strength Index Score (3 Year Range Pct):41.853.656.2
– Strength Index Reading (3 Year Range):BearishBullishBullish
NET POSITION MOVEMENT INDEX:
– 6-Week Change in Strength Index:-1.00.8-0.3


Canadian Dollar Futures:

Canadian Dollar Forex Futures COT ChartThe Canadian Dollar large speculator standing this week resulted in a net position of -33,543 contracts in the data reported through Tuesday. This was a weekly lift of 3,125 contracts from the previous week which had a total of -36,668 net contracts.

This week’s current strength score (the trader positioning range over the past three years, measured from 0 to 100) shows the speculators are currently Bearish with a score of 23.3 percent. The commercials are Bullish with a score of 68.9 percent and the small traders (not shown in chart) are Bullish with a score of 55.6 percent.

Price Trend-Following Model: Strong Uptrend

Our weekly trend-following model classifies the current market price position as: Strong Uptrend. The current action for the model is considered to be: Hold – Maintain Long Position.

CANADIAN DOLLAR StatisticsSPECULATORSCOMMERCIALSSMALL TRADERS
– Percent of Open Interest Longs:15.362.420.9
– Percent of Open Interest Shorts:33.552.212.8
– Net Position:-33,54318,75814,785
– Gross Longs:28,187114,92538,400
– Gross Shorts:61,73096,16723,615
– Long to Short Ratio:0.5 to 11.2 to 11.6 to 1
NET POSITION TREND:
– Strength Index Score (3 Year Range Pct):23.368.955.6
– Strength Index Reading (3 Year Range):BearishBullishBullish
NET POSITION MOVEMENT INDEX:
– 6-Week Change in Strength Index:8.1-15.832.2


Australian Dollar Futures:

Australian Dollar Forex Futures COT Chart
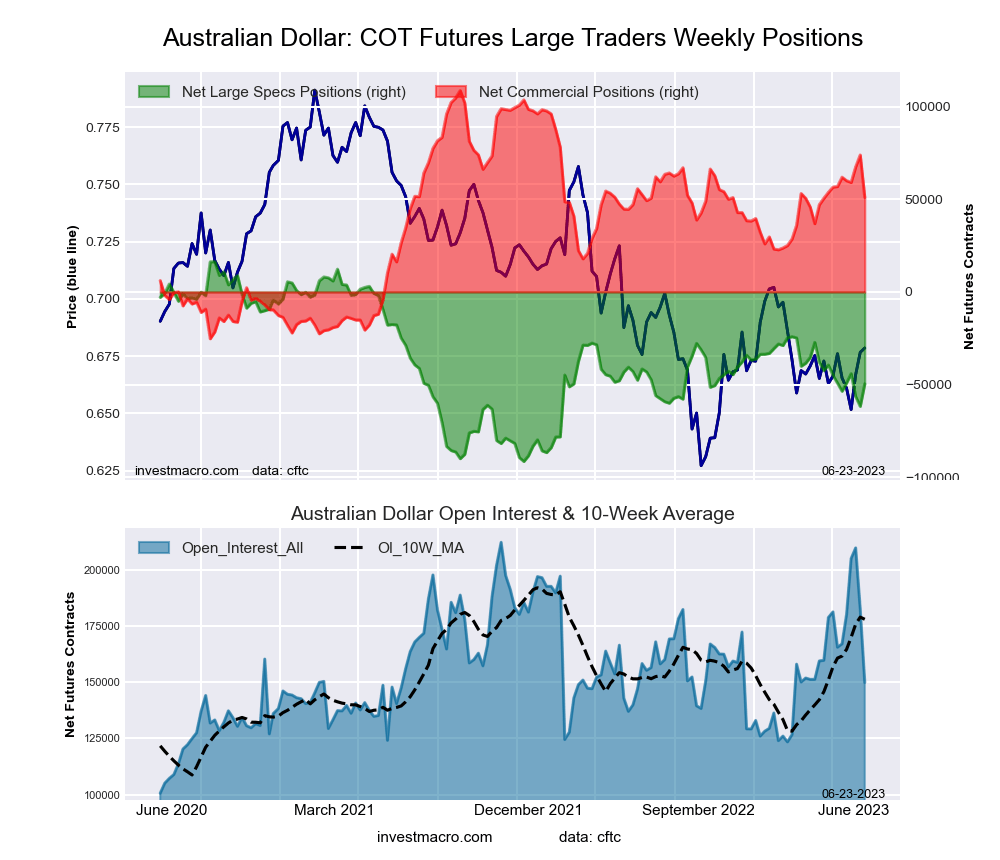
The Australian Dollar large speculator standing this week resulted in a net position of -49,616 contracts in the data reported through Tuesday. This was a weekly lift of 12,129 contracts from the previous week which had a total of -61,745 net contracts.

This week’s current strength score (the trader positioning range over the past three years, measured from 0 to 100) shows the speculators are currently Bearish with a score of 38.8 percent. The commercials are Bullish with a score of 56.9 percent and the small traders (not shown in chart) are Bearish with a score of 49.1 percent.

Price Trend-Following Model: Downtrend

Our weekly trend-following model classifies the current market price position as: Downtrend. The current action for the model is considered to be: Hold – Maintain Short Position.

AUSTRALIAN DOLLAR StatisticsSPECULATORSCOMMERCIALSSMALL TRADERS
– Percent of Open Interest Longs:30.552.914.3
– Percent of Open Interest Shorts:63.618.915.2
– Net Position:-49,61650,986-1,370
– Gross Longs:45,74379,30021,444
– Gross Shorts:95,35928,31422,814
– Long to Short Ratio:0.5 to 12.8 to 10.9 to 1
NET POSITION TREND:
– Strength Index Score (3 Year Range Pct):38.856.949.1
– Strength Index Reading (3 Year Range):BearishBullishBearish
NET POSITION MOVEMENT INDEX:
– 6-Week Change in Strength Index:-0.4-4.415.4


New Zealand Dollar Futures:

New Zealand Dollar Forex Futures COT Chart
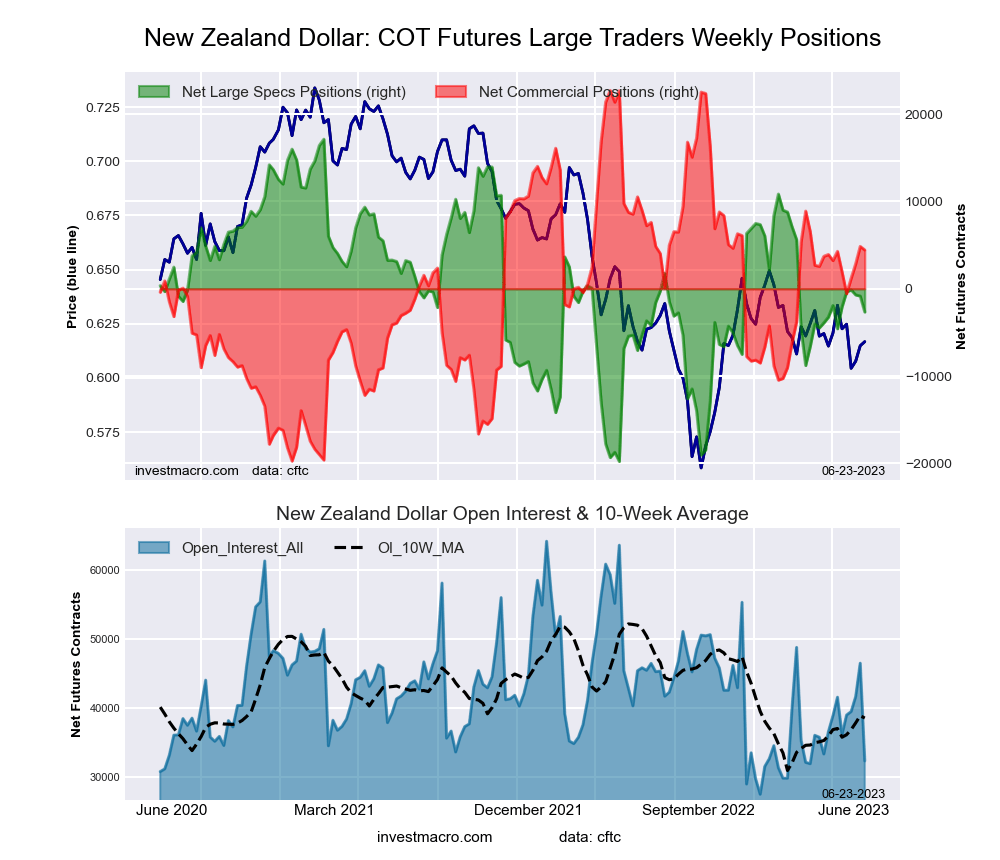
The New Zealand Dollar large speculator standing this week resulted in a net position of -2,659 contracts in the data reported through Tuesday. This was a weekly fall of -1,828 contracts from the previous week which had a total of -831 net contracts.

This week’s current strength score (the trader positioning range over the past three years, measured from 0 to 100) shows the speculators are currently Bearish with a score of 46.4 percent. The commercials are Bullish with a score of 57.0 percent and the small traders (not shown in chart) are Bearish with a score of 28.8 percent.

Price Trend-Following Model: Strong Downtrend

Our weekly trend-following model classifies the current market price position as: Strong Downtrend. The current action for the model is considered to be: Hold – Maintain Short Position.

NEW ZEALAND DOLLAR StatisticsSPECULATORSCOMMERCIALSSMALL TRADERS
– Percent of Open Interest Longs:33.557.38.6
– Percent of Open Interest Shorts:41.743.614.1
– Net Position:-2,6594,441-1,782
– Gross Longs:10,86718,5732,794
– Gross Shorts:13,52614,1324,576
– Long to Short Ratio:0.8 to 11.3 to 10.6 to 1
NET POSITION TREND:
– Strength Index Score (3 Year Range Pct):46.457.028.8
– Strength Index Reading (3 Year Range):BearishBullishBearish
NET POSITION MOVEMENT INDEX:
– 6-Week Change in Strength Index:5.20.4-24.7


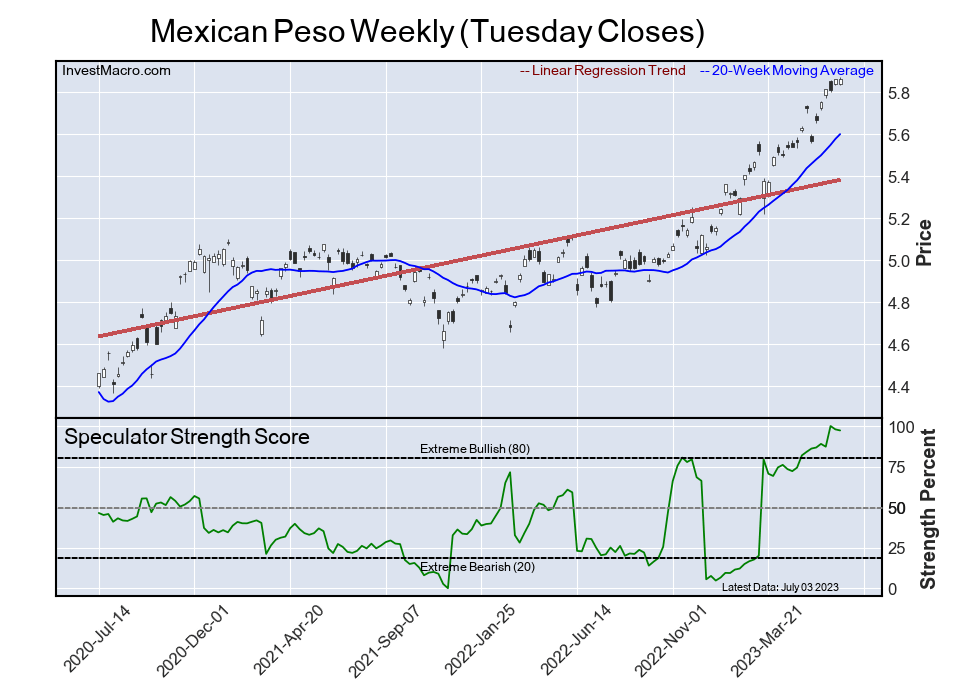
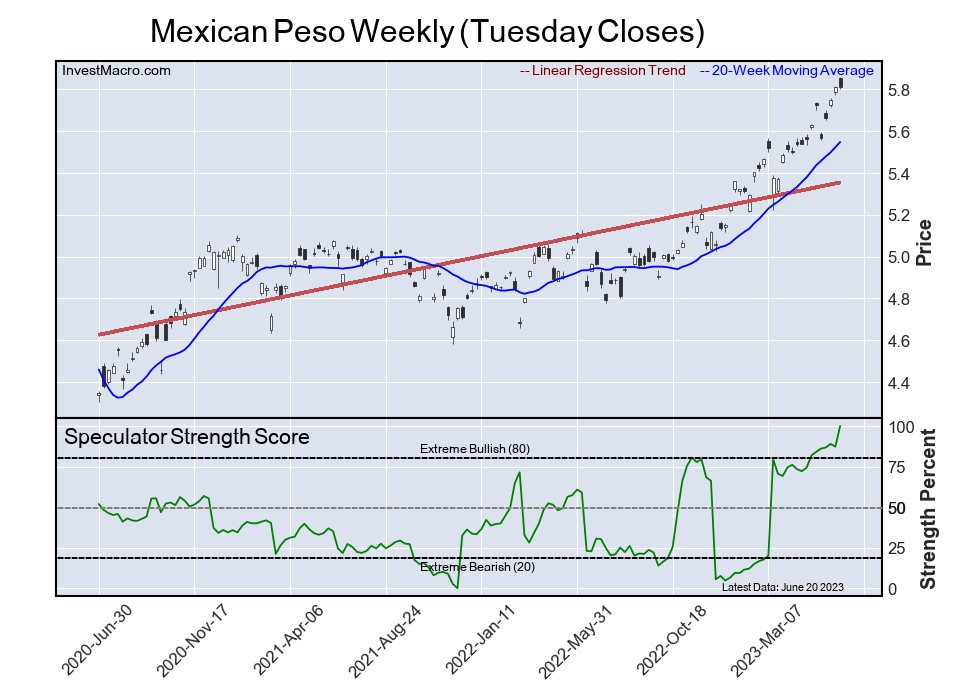
Mexican Peso Futures:

Mexican Peso Futures COT ChartThe Mexican Peso large speculator standing this week resulted in a net position of 99,718 contracts in the data reported through Tuesday. This was a weekly lift of 20,883 contracts from the previous week which had a total of 78,835 net contracts.

This week’s current strength score (the trader positioning range over the past three years, measured from 0 to 100) shows the speculators are currently Bullish-Extreme with a score of 100.0 percent. The commercials are Bearish-Extreme with a score of 0.0 percent and the small traders (not shown in chart) are Bearish with a score of 32.4 percent.

Price Trend-Following Model: Strong Uptrend

Our weekly trend-following model classifies the current market price position as: Strong Uptrend. The current action for the model is considered to be: Hold – Maintain Long Position.

MEXICAN PESO StatisticsSPECULATORSCOMMERCIALSSMALL TRADERS
– Percent of Open Interest Longs:53.842.13.7
– Percent of Open Interest Shorts:9.587.92.2
– Net Position:99,718-103,0403,322
– Gross Longs:121,00594,7338,262
– Gross Shorts:21,287197,7734,940
– Long to Short Ratio:5.7 to 10.5 to 11.7 to 1
NET POSITION TREND:
– Strength Index Score (3 Year Range Pct):100.00.032.4
– Strength Index Reading (3 Year Range):Bullish-ExtremeBearish-ExtremeBearish
NET POSITION MOVEMENT INDEX:
– 6-Week Change in Strength Index:18.1-15.8-20.3


Brazilian Real Futures:

Brazil Real Futures COT ChartThe Brazilian Real large speculator standing this week resulted in a net position of 25,902 contracts in the data reported through Tuesday. This was a weekly decline of -254 contracts from the previous week which had a total of 26,156 net contracts.

This week’s current strength score (the trader positioning range over the past three years, measured from 0 to 100) shows the speculators are currently Bullish with a score of 68.7 percent. The commercials are Bearish with a score of 35.9 percent and the small traders (not shown in chart) are Bearish with a score of 24.2 percent.

Price Trend-Following Model: Strong Uptrend

Our weekly trend-following model classifies the current market price position as: Strong Uptrend. The current action for the model is considered to be: Hold – Maintain Long Position.

BRAZIL REAL StatisticsSPECULATORSCOMMERCIALSSMALL TRADERS
– Percent of Open Interest Longs:68.920.210.6
– Percent of Open Interest Shorts:20.164.415.3
– Net Position:25,902-23,418-2,484
– Gross Longs:36,53510,6855,625
– Gross Shorts:10,63334,1038,109
– Long to Short Ratio:3.4 to 10.3 to 10.7 to 1
NET POSITION TREND:
– Strength Index Score (3 Year Range Pct):68.735.924.2
– Strength Index Reading (3 Year Range):BullishBearishBearish
NET POSITION MOVEMENT INDEX:
– 6-Week Change in Strength Index:-11.116.1-35.0


Bitcoin Futures:

Bitcoin Crypto Futures COT Chart
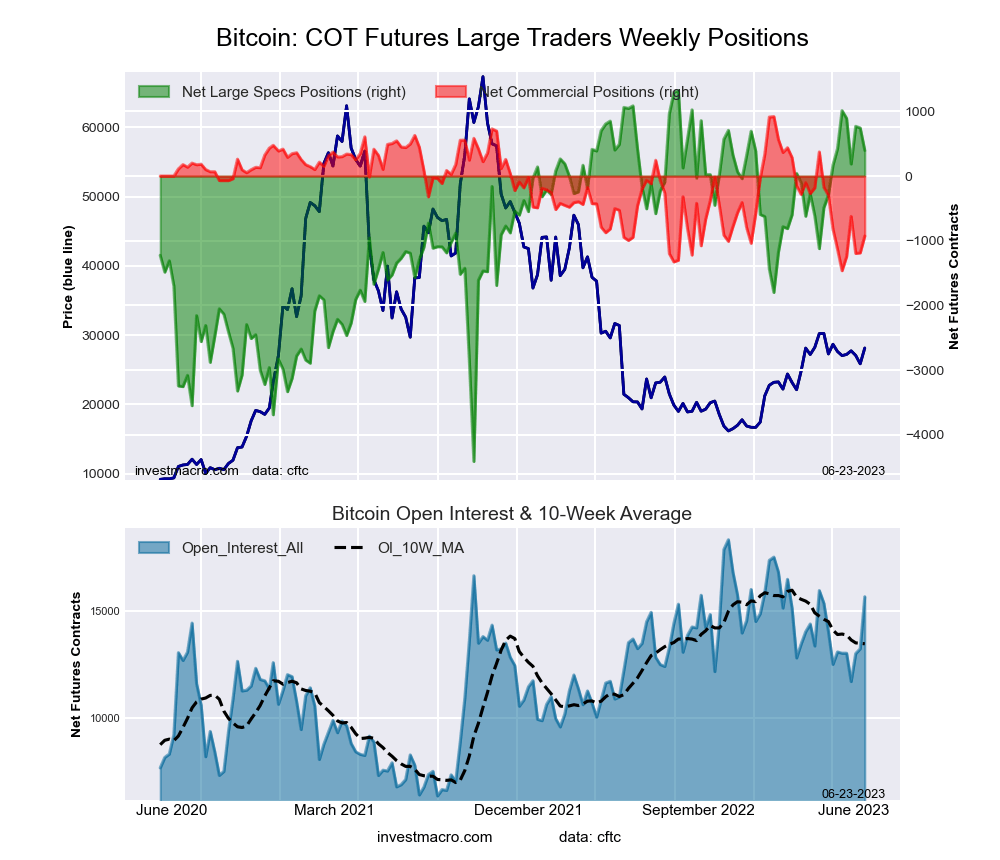
The Bitcoin large speculator standing this week resulted in a net position of 397 contracts in the data reported through Tuesday. This was a weekly decrease of -346 contracts from the previous week which had a total of 743 net contracts.

This week’s current strength score (the trader positioning range over the past three years, measured from 0 to 100) shows the speculators are currently Bullish-Extreme with a score of 83.9 percent. The commercials are Bearish with a score of 22.5 percent and the small traders (not shown in chart) are Bearish with a score of 25.0 percent.

Price Trend-Following Model: Strong Uptrend

Our weekly trend-following model classifies the current market price position as: Strong Uptrend. The current action for the model is considered to be: Hold – Maintain Long Position.

BITCOIN StatisticsSPECULATORSCOMMERCIALSSMALL TRADERS
– Percent of Open Interest Longs:76.11.68.0
– Percent of Open Interest Shorts:73.57.54.6
– Net Position:397-927530
– Gross Longs:11,9322501,259
– Gross Shorts:11,5351,177729
– Long to Short Ratio:1.0 to 10.2 to 11.7 to 1
NET POSITION TREND:
– Strength Index Score (3 Year Range Pct):83.922.525.0
– Strength Index Reading (3 Year Range):Bullish-ExtremeBearishBearish
NET POSITION MOVEMENT INDEX:
– 6-Week Change in Strength Index:-0.58.6-4.0


Article By InvestMacroReceive our weekly COT Newsletter

*COT Report: The COT data, released weekly to the public each Friday, is updated through the most recent Tuesday (data is 3 days old) and shows a quick view of how large speculators or non-commercials (for-profit traders) were positioned in the futures markets.

The CFTC categorizes trader positions according to commercial hedgers (traders who use futures contracts for hedging as part of the business), non-commercials (large traders who speculate to realize trading profits) and nonreportable traders (usually small traders/speculators) as well as their open interest (contracts open in the market at time of reporting). See CFTC criteria here.

Copper Speculators raise their bets into first bullish position in 9 weeks

By InvestMacro

Here are the latest charts and statistics for the Commitment of Traders (COT) data published by the Commodities Futures Trading Commission (CFTC).

The latest COT data is updated through Tuesday June 20th and shows a quick view of how large traders (for-profit speculators and commercial entities) were positioned in the futures markets.

Weekly Speculator Changes led by Palladium & Gold

The COT metals markets speculator bets were higher this week as four out of the six metals markets we cover had higher positioning while the other two markets had lower speculator contracts.

Leading the gains for the metals was Copper (14,794 contracts) with Gold (2,766 contracts), Palladium (501 contracts) and Steel (175 contracts) also showing positive weeks.

The markets with declines in speculator bets for the week were Silver (-3,678 contracts) and Platinum (-2,500 contracts) having lower bets on the week.

Copper Speculators raise their bets into first bullish position in 9 weeks

Highlighting the COT metals data this week is the gains for the Copper speculative positions. The large speculator position in Copper futures rose by +14,794 contracts this week following a gain by +13,050 contracts last week. The speculator position has now risen by over +37,590 contracts in total over the past three weeks.

This renewed positive sentiment has brought the net position standing back into a small bullish level after spending the past eight weeks in bearish territory.

Despite the bullish return of speculators, Copper prices closed out the week lower following three straight weeks of gains. The futures price touched a six-week high on Thursday at 3.967 before turning lower and finishing the week at 3.8035.


Data Snapshot of Commodity Market Traders | Columns Legend
Jun-20-2023OIOI-IndexSpec-NetSpec-IndexCom-NetCOM-IndexSmalls-NetSmalls-Index
Gold438,0377162,97549-186,5375223,56239
Silver152,6334020,05847-36,2105016,15256
Copper204,399461,88832-4,003682,11532
Palladium12,30487-6,63557,21496-5797
Platinum69,4367019,47261-25,052425,58043


Strength Scores led by Steel & Platinum

COT Strength Scores (a normalized measure of Speculator positions over a 3-Year range, from 0 to 100 where above 80 is Extreme-Bullish and below 20 is Extreme-Bearish) showed that Steel (68 percent) and Platinum (61 percent) lead the metals markets this week.

On the downside, Palladium (5 percent) comes in at the lowest strength level currently and is in Extreme-Bearish territory (below 20 percent).

Strength Statistics:
Gold (48.8 percent) vs Gold previous week (47.6 percent)
Silver (46.9 percent) vs Silver previous week (52.1 percent)
Copper (32.5 percent) vs Copper previous week (19.7 percent)
Platinum (60.5 percent) vs Platinum previous week (66.3 percent)
Palladium (4.6 percent) vs Palladium previous week (0.0 percent)
Steel (67.8 percent) vs Palladium previous week (67.3 percent)

Copper & Steel top the 6-Week Strength Trends

COT Strength Score Trends (or move index, calculates the 6-week changes in strength scores) showed that Copper (23 percent) and Steel (6 percent) lead the past six weeks trends for metals.

Platinum (-20 percent), Silver (-18 percent) and Gold (-14 percent) lead the downside trend scores currently.

Move Statistics:
Gold (-14.5 percent) vs Gold previous week (-15.6 percent)
Silver (-17.6 percent) vs Silver previous week (-11.7 percent)
Copper (23.1 percent) vs Copper previous week (7.6 percent)
Platinum (-19.9 percent) vs Platinum previous week (-10.9 percent)
Palladium (-9.1 percent) vs Palladium previous week (-6.4 percent)
Steel (5.9 percent) vs Steel previous week (4.5 percent)


Individual Markets:

Gold Comex Futures:

Gold Futures COT ChartThe Gold Comex Futures large speculator standing this week resulted in a net position of 162,975 contracts in the data reported through Tuesday. This was a weekly lift of 2,766 contracts from the previous week which had a total of 160,209 net contracts.

This week’s current strength score (the trader positioning range over the past three years, measured from 0 to 100) shows the speculators are currently Bearish with a score of 48.8 percent. The commercials are Bullish with a score of 51.9 percent and the small traders (not shown in chart) are Bearish with a score of 39.0 percent.

Price Trend-Following Model: Weak Uptrend

Our weekly trend-following model classifies the current market price position as: Weak Uptrend. The current action for the model is considered to be: Hold – Maintain Long Position.

Gold Futures StatisticsSPECULATORSCOMMERCIALSSMALL TRADERS
– Percent of Open Interest Longs:52.327.710.8
– Percent of Open Interest Shorts:15.170.35.4
– Net Position:162,975-186,53723,562
– Gross Longs:229,308121,41947,402
– Gross Shorts:66,333307,95623,840
– Long to Short Ratio:3.5 to 10.4 to 12.0 to 1
NET POSITION TREND:
– Strength Index Score (3 Year Range Pct):48.851.939.0
– Strength Index Reading (3 Year Range):BearishBullishBearish
NET POSITION MOVEMENT INDEX:
– 6-Week Change in Strength Index:-14.513.9-7.9


Silver Comex Futures:

Silver Futures COT ChartThe Silver Comex Futures large speculator standing this week resulted in a net position of 20,058 contracts in the data reported through Tuesday. This was a weekly lowering of -3,678 contracts from the previous week which had a total of 23,736 net contracts.

This week’s current strength score (the trader positioning range over the past three years, measured from 0 to 100) shows the speculators are currently Bearish with a score of 46.9 percent. The commercials are Bullish with a score of 50.0 percent and the small traders (not shown in chart) are Bullish with a score of 56.3 percent.

Price Trend-Following Model: Weak Uptrend

Our weekly trend-following model classifies the current market price position as: Weak Uptrend. The current action for the model is considered to be: Hold – Maintain Long Position.

Silver Futures StatisticsSPECULATORSCOMMERCIALSSMALL TRADERS
– Percent of Open Interest Longs:34.430.118.5
– Percent of Open Interest Shorts:21.353.87.9
– Net Position:20,058-36,21016,152
– Gross Longs:52,54745,94128,208
– Gross Shorts:32,48982,15112,056
– Long to Short Ratio:1.6 to 10.6 to 12.3 to 1
NET POSITION TREND:
– Strength Index Score (3 Year Range Pct):46.950.056.3
– Strength Index Reading (3 Year Range):BearishBullishBullish
NET POSITION MOVEMENT INDEX:
– 6-Week Change in Strength Index:-17.612.113.0


Copper Grade #1 Futures:

Copper Futures COT ChartThe Copper Grade #1 Futures large speculator standing this week resulted in a net position of 1,888 contracts in the data reported through Tuesday. This was a weekly rise of 14,794 contracts from the previous week which had a total of -12,906 net contracts.

This week’s current strength score (the trader positioning range over the past three years, measured from 0 to 100) shows the speculators are currently Bearish with a score of 32.5 percent. The commercials are Bullish with a score of 68.3 percent and the small traders (not shown in chart) are Bearish with a score of 31.8 percent.

Price Trend-Following Model: Downtrend

Our weekly trend-following model classifies the current market price position as: Downtrend. The current action for the model is considered to be: Hold – Maintain Short Position.

Copper Futures StatisticsSPECULATORSCOMMERCIALSSMALL TRADERS
– Percent of Open Interest Longs:31.742.48.2
– Percent of Open Interest Shorts:30.744.47.2
– Net Position:1,888-4,0032,115
– Gross Longs:64,74086,76116,759
– Gross Shorts:62,85290,76414,644
– Long to Short Ratio:1.0 to 11.0 to 11.1 to 1
NET POSITION TREND:
– Strength Index Score (3 Year Range Pct):32.568.331.8
– Strength Index Reading (3 Year Range):BearishBullishBearish
NET POSITION MOVEMENT INDEX:
– 6-Week Change in Strength Index:23.1-19.7-19.0


Platinum Futures:

Platinum Futures COT ChartThe Platinum Futures large speculator standing this week resulted in a net position of 19,472 contracts in the data reported through Tuesday. This was a weekly reduction of -2,500 contracts from the previous week which had a total of 21,972 net contracts.

This week’s current strength score (the trader positioning range over the past three years, measured from 0 to 100) shows the speculators are currently Bullish with a score of 60.5 percent. The commercials are Bearish with a score of 41.7 percent and the small traders (not shown in chart) are Bearish with a score of 42.8 percent.

Price Trend-Following Model: Weak Uptrend

Our weekly trend-following model classifies the current market price position as: Weak Uptrend. The current action for the model is considered to be: Hold – Maintain Long Position.

Platinum Futures StatisticsSPECULATORSCOMMERCIALSSMALL TRADERS
– Percent of Open Interest Longs:49.128.312.9
– Percent of Open Interest Shorts:21.064.44.8
– Net Position:19,472-25,0525,580
– Gross Longs:34,05919,6828,936
– Gross Shorts:14,58744,7343,356
– Long to Short Ratio:2.3 to 10.4 to 12.7 to 1
NET POSITION TREND:
– Strength Index Score (3 Year Range Pct):60.541.742.8
– Strength Index Reading (3 Year Range):BullishBearishBearish
NET POSITION MOVEMENT INDEX:
– 6-Week Change in Strength Index:-19.915.415.7


Palladium Futures:

Palladium Futures COT ChartThe Palladium Futures large speculator standing this week resulted in a net position of -6,635 contracts in the data reported through Tuesday. This was a weekly gain of 501 contracts from the previous week which had a total of -7,136 net contracts.

This week’s current strength score (the trader positioning range over the past three years, measured from 0 to 100) shows the speculators are currently Bearish-Extreme with a score of 4.6 percent. The commercials are Bullish-Extreme with a score of 96.4 percent and the small traders (not shown in chart) are Bearish-Extreme with a score of 6.9 percent.

Price Trend-Following Model: Strong Downtrend

Our weekly trend-following model classifies the current market price position as: Strong Downtrend. The current action for the model is considered to be: Hold – Maintain Short Position.

Palladium Futures StatisticsSPECULATORSCOMMERCIALSSMALL TRADERS
– Percent of Open Interest Longs:20.567.29.6
– Percent of Open Interest Shorts:74.48.614.3
– Net Position:-6,6357,214-579
– Gross Longs:2,5258,2681,182
– Gross Shorts:9,1601,0541,761
– Long to Short Ratio:0.3 to 17.8 to 10.7 to 1
NET POSITION TREND:
– Strength Index Score (3 Year Range Pct):4.696.46.9
– Strength Index Reading (3 Year Range):Bearish-ExtremeBullish-ExtremeBearish-Extreme
NET POSITION MOVEMENT INDEX:
– 6-Week Change in Strength Index:-9.110.3-15.7


Steel Futures Futures:

Steel Futures COT ChartThe Steel Futures large speculator standing this week resulted in a net position of -1,855 contracts in the data reported through Tuesday. This was a weekly advance of 175 contracts from the previous week which had a total of -2,030 net contracts.

This week’s current strength score (the trader positioning range over the past three years, measured from 0 to 100) shows the speculators are currently Bullish with a score of 67.8 percent. The commercials are Bearish with a score of 32.0 percent and the small traders (not shown in chart) are Bearish with a score of 38.9 percent.

Price Trend-Following Model: Weak Uptrend

Our weekly trend-following model classifies the current market price position as: Weak Uptrend. The current action for the model is considered to be: Hold – Maintain Long Position.

Steel Futures StatisticsSPECULATORSCOMMERCIALSSMALL TRADERS
– Percent of Open Interest Longs:14.878.01.0
– Percent of Open Interest Shorts:21.571.80.4
– Net Position:-1,8551,710145
– Gross Longs:4,08521,522264
– Gross Shorts:5,94019,812119
– Long to Short Ratio:0.7 to 11.1 to 12.2 to 1
NET POSITION TREND:
– Strength Index Score (3 Year Range Pct):67.832.038.9
– Strength Index Reading (3 Year Range):BullishBearishBearish
NET POSITION MOVEMENT INDEX:
– 6-Week Change in Strength Index:5.9-6.422.1


Article By InvestMacroReceive our weekly COT Newsletter

*COT Report: The COT data, released weekly to the public each Friday, is updated through the most recent Tuesday (data is 3 days old) and shows a quick view of how large speculators or non-commercials (for-profit traders) were positioned in the futures markets.

The CFTC categorizes trader positions according to commercial hedgers (traders who use futures contracts for hedging as part of the business), non-commercials (large traders who speculate to realize trading profits) and nonreportable traders (usually small traders/speculators) as well as their open interest (contracts open in the market at time of reporting). See CFTC criteria here.

Speculator Extremes: British Pound, Peso & Live Cattle lead Bullish & Bearish Positions

By InvestMacro

The latest update for the weekly Commitment of Traders (COT) report was released by the Commodity Futures Trading Commission (CFTC) on Friday for data ending on June 20th.

This weekly Extreme Positions report highlights the Most Bullish and Most Bearish Positions for the speculator category. Extreme positioning in these markets can foreshadow strong moves in the underlying market.

To signify an extreme position, we use the Strength Index (also known as the COT Index) of each instrument, a common method of measuring COT data. The Strength Index is simply a comparison of current trader positions against the range of positions over the previous 3 years. We use over 80 percent as extremely bullish and under 20 percent as extremely bearish. (Compare Strength Index scores across all markets in the data table or cot leaders table)


Here Are This Week’s Most Bullish Speculator Positions:

British Pound


The British Pound speculator position comes in as the most bullish extreme standing this week. The British Pound speculator level is currently at a 100.0 percent score of its 3-year range.

The six-week trend for the percent strength score totaled 33.1 this week. The overall net speculator position was a total of 46,608 net contracts this week with a change of 39,873 contract in the weekly speculator bets.


Mexican Peso


The Mexican Peso speculator position comes next in the extreme standings this week. The Mexican Peso speculator level is now at a 100.0 percent score of its 3-year range.

The six-week trend for the percent strength score was 18.1 this week. The speculator position registered 99,718 net contracts this week with a weekly change of 20,883 contracts in speculator bets.


3-Month Secured Overnight Financing Rate


The 3-Month Secured Overnight Financing Rate speculator position comes in third this week in the extreme standings. The 3-Month Secured Overnight Financing Rate speculator level resides at a 100.0 percent score of its 3-year range.

The six-week trend for the speculator strength score came in at 47.9 this week. The overall speculator position was 204,698 net contracts this week with a change of 78,952 contracts in the weekly speculator bets.


Bloomberg Commodity Index


The Bloomberg Commodity Index speculator position comes up number four in the extreme standings this week. The Bloomberg Commodity Index speculator level is at a 99.8 percent score of its 3-year range.

The six-week trend for the speculator strength score totaled a change of 2.2 this week. The overall speculator position was -1,510 net contracts this week with a change of -48 contracts in the speculator bets.


Live Cattle


The Live Cattle speculator position rounds out the top five in this week’s bullish extreme standings. The Live Cattle speculator level sits at a 93.2 percent score of its 3-year range. The six-week trend for the speculator strength score was 8.7 this week.

The speculator position was 105,936 net contracts this week with a change of -6,313 contracts in the weekly speculator bets.


This Week’s Most Bearish Speculator Positions:

1-Month Secured Overnight Financing Rate

The 1-Month Secured Overnight Financing Rate speculator position comes in as the most bearish extreme standing this week. The 1-Month Secured Overnight Financing Rate speculator level is at a 0.0 percent score of its 3-year range.

The six-week trend for the speculator strength score was -32.9 this week. The overall speculator position was -154,369 net contracts this week with a change of -61,298 contracts in the speculator bets.


2-Year Bond


The 2-Year Bond speculator position comes in next for the most bearish extreme standing on the week. The 2-Year Bond speculator level is at a 1.7 percent score of its 3-year range.

The six-week trend for the speculator strength score was -24.5 this week. The speculator position was -1,027,276 net contracts this week with a change of 19,169 contracts in the weekly speculator bets.


Japanese Yen


The Japanese Yen speculator position comes in as third most bearish extreme standing of the week. The Japanese Yen speculator level resides at a 2.6 percent score of its 3-year range.

The six-week trend for the speculator strength score was -28.7 this week. The overall speculator position was -107,656 net contracts this week with a change of -3,680 contracts in the speculator bets.


WTI Crude Oil


The WTI Crude Oil speculator position comes in as this week’s fourth most bearish extreme standing. The WTI Crude Oil speculator level is at a 3.1 percent score of its 3-year range.

The six-week trend for the speculator strength score was -12.7 this week. The speculator position was 166,477 net contracts this week with a change of 11,403 contracts in the weekly speculator bets.


Palladium


Finally, the Palladium speculator position comes in as the fifth most bearish extreme standing for this week. The Palladium speculator level is at a 4.6 percent score of its 3-year range.

The six-week trend for the speculator strength score was -9.1 this week. The speculator position was -6,635 net contracts this week with a change of 501 contracts in the weekly speculator bets.


Article By InvestMacroReceive our weekly COT Newsletter

Speculators or Non-Commercials Notes:

Speculators, classified as non-commercial traders by the CFTC, are made up of large commodity funds, hedge funds and other significant for-profit participants. The Specs are generally regarded as trend-followers in their behavior towards price action – net speculator bets and prices tend to go in the same directions. These traders often look to buy when prices are rising and sell when prices are falling. To illustrate this point, many times speculator contracts can be found at their most extremes (bullish or bearish) when prices are also close to their highest or lowest levels.

These extreme levels can be dangerous for the large speculators as the trade is most crowded, there is less trading ammunition still sitting on the sidelines to push the trend further and prices have moved a significant distance. When the trend becomes exhausted, some speculators take profits while others look to also exit positions when prices fail to continue in the same direction. This process usually plays out over many months to years and can ultimately create a reverse effect where prices start to fall and speculators start a process of selling when prices are falling.


*COT Report: The COT data, released weekly to the public each Friday, is updated through the most recent Tuesday (data is 3 days old) and shows a quick view of how large speculators or non-commercials (for-profit traders) were positioned in the futures markets.

The CFTC categorizes trader positions according to commercial hedgers (traders who use futures contracts for hedging as part of the business), non-commercials (large traders who speculate to realize trading profits) and nonreportable traders (usually small traders/speculators) as well as their open interest (contracts open in the market at time of reporting). See CFTC criteria here.

Corn Speculators push their bullish bets sharply higher on drought

By InvestMacro

Here are the latest charts and statistics for the Commitment of Traders (COT) reports data published by the Commodities Futures Trading Commission (CFTC).

The latest COT data is updated through Tuesday June 20th and shows a quick view of how large traders (for-profit speculators and commercial entities) were positioned in the futures markets.

Weekly Speculator Changes led by Sugar & Corn

The COT soft commodities markets speculator bets were higher this week as eight out of the eleven softs markets we cover had higher positioning while the other three markets had lower speculator contracts.

Leading the gains for the softs markets was Corn (73,681 contracts) with Soybeans (25,583 contracts), Wheat (20,463 contracts), Soybean Oil (13,962 contracts), Sugar (9,741 contracts), Lean Hogs (7,704 contracts), Coffee (5,163 contracts) and Soybean Meal (4,314 contracts) also showing positive weeks.

The markets with the declines in speculator bets this week were Cocoa (-10,597 contracts) with Cotton (-4,552 contracts) and Live Cattle (-6,313 contracts) also registering lower bets on the week.

Corn Speculators push their bullish bets sharply higher on drought

Highlighting the COT soft commodities data this week is the renewed bullish appetite of the Corn’s speculator’s positioning. The speculator positioning sharply jumped this week by over +73,681 contracts following a gain of +59,863 contracts last week. The Corn speculative bets have risen in four straight weeks and for six out of the past seven weeks.

The grains markets have been starting to see higher prices coming back over the past month due to a drought in the US Midwest that has been stated as the worst since 2012. Speculators have been reacting to the changes in the weather and have now pushed their overall net standing for Corn back into a bullish position last week after spending the previous six weeks in bearish territory.

Corn’s futures price had been on a rise for three out of the previous four weeks and touched a nine-week high this week above 672.0 but ended up closing the week lower at the 630.6 price level.


Data Snapshot of Commodity Market Traders | Columns Legend
Jun-20-2023OIOI-IndexSpec-NetSpec-IndexCom-NetCOM-IndexSmalls-NetSmalls-Index
WTI Crude1,846,81640166,4773-189,9189723,44126
Gold438,0377162,97549-186,5375223,56239
Silver152,6334020,05847-36,2105016,15256
Copper204,399461,88832-4,003682,11532
Palladium12,30487-6,63557,21496-5797
Platinum69,4367019,47261-25,052425,58043
Natural Gas1,303,55869-109,3152879,7357129,58050
Brent144,34817-47,0561345,090911,96636
Heating Oil310,2974016,10057-28,4966112,39641
Soybeans662,4691988,53224-67,63473-20,89847
Corn1,290,34813118,77339-58,03067-60,74328
Coffee185,800733,49462-33,42643-6812
Sugar967,11363261,00183-310,7621549,76167
Wheat353,86539-66,3642063,862802,50282


Strength Scores led by Live Cattle & Cocoa

COT Strength Scores (a normalized measure of Speculator positions over a 3-Year range, from 0 to 100 where above 80 is Extreme-Bullish and below 20 is Extreme-Bearish) showed that Live Cattle (93 percent), Cocoa (89 percent) and Sugar (83 percent) lead the softs markets this week.

On the downside, Lean Hogs (14 percent) and Cotton (14 percent) come in at the lowest strength levels currently and are in Extreme-Bearish territory (below 20 percent).

Strength Statistics:
Corn (39.2 percent) vs Corn previous week (28.7 percent)
Sugar (83.2 percent) vs Sugar previous week (79.7 percent)
Coffee (61.8 percent) vs Coffee previous week (56.5 percent)
Soybeans (23.9 percent) vs Soybeans previous week (13.9 percent)
Soybean Oil (34.4 percent) vs Soybean Oil previous week (26.3 percent)
Soybean Meal (63.9 percent) vs Soybean Meal previous week (61.6 percent)
Live Cattle (93.2 percent) vs Live Cattle previous week (100.0 percent)
Lean Hogs (14.3 percent) vs Lean Hogs previous week (8.0 percent)
Cotton (13.7 percent) vs Cotton previous week (17.2 percent)
Cocoa (88.8 percent) vs Cocoa previous week (100.0 percent)
Wheat (19.6 percent) vs Wheat previous week (5.1 percent)


Corn & Soybean Oil top the 6-Week Strength Trends

COT Strength Score Trends (or move index, calculates the 6-week changes in strength scores) showed that Corn (25 percent) and Soybean Oil (21 percent) lead the past six weeks trends for soft commodities. Wheat (13 percent), Soybeans (10 percent) and Soybean Meal (9 percent) are the next highest positive movers in the latest trends data.

Sugar (-6 percent) leads the downside trend scores currently with Coffee (0 percent), Cotton (4 percent) and Lean Hogs (6 percent) following next with lower trend scores.

Strength Trend Statistics:
Corn (25.2 percent) vs Corn previous week (15.0 percent)
Sugar (-5.5 percent) vs Sugar previous week (-5.7 percent)
Coffee (-0.0 percent) vs Coffee previous week (-8.5 percent)
Soybeans (9.5 percent) vs Soybeans previous week (-4.8 percent)
Soybean Oil (21.1 percent) vs Soybean Oil previous week (19.8 percent)
Soybean Meal (8.7 percent) vs Soybean Meal previous week (7.6 percent)
Live Cattle (8.7 percent) vs Live Cattle previous week (8.0 percent)
Lean Hogs (6.0 percent) vs Lean Hogs previous week (-5.5 percent)
Cotton (4.1 percent) vs Cotton previous week (13.7 percent)
Cocoa (5.6 percent) vs Cocoa previous week (21.0 percent)
Wheat (13.1 percent) vs Wheat previous week (2.4 percent)


Individual Soft Commodities Markets:

CORN Futures:

CORN Futures COT ChartThe CORN large speculator standing this week totaled a net position of 118,773 contracts in the data reported through Tuesday. This was a weekly gain of 73,681 contracts from the previous week which had a total of 45,092 net contracts.

This week’s current strength score (the trader positioning range over the past three years, measured from 0 to 100) shows the speculators are currently Bearish with a score of 39.2 percent. The commercials are Bullish with a score of 66.6 percent and the small traders (not shown in chart) are Bearish with a score of 27.7 percent.

Price Trend-Following Model: Weak Downtrend

Our weekly trend-following model classifies the current market price position as: Weak Downtrend. The current action for the model is considered to be: Hold – Maintain Short Position.

CORN Futures StatisticsSPECULATORSCOMMERCIALSSMALL TRADERS
– Percent of Open Interest Longs:26.548.39.4
– Percent of Open Interest Shorts:17.352.814.1
– Net Position:118,773-58,030-60,743
– Gross Longs:342,125623,477121,205
– Gross Shorts:223,352681,507181,948
– Long to Short Ratio:1.5 to 10.9 to 10.7 to 1
NET POSITION TREND:
– Strength Index Score (3 Year Range Pct):39.266.627.7
– Strength Index Reading (3 Year Range):BearishBullishBearish
NET POSITION MOVEMENT INDEX:
– 6-Week Change in Strength Index:25.2-24.1-22.0


SUGAR Futures:

SUGAR Futures COT ChartThe SUGAR large speculator standing this week totaled a net position of 261,001 contracts in the data reported through Tuesday. This was a weekly rise of 9,741 contracts from the previous week which had a total of 251,260 net contracts.

This week’s current strength score (the trader positioning range over the past three years, measured from 0 to 100) shows the speculators are currently Bullish-Extreme with a score of 83.2 percent. The commercials are Bearish-Extreme with a score of 14.8 percent and the small traders (not shown in chart) are Bullish with a score of 67.4 percent.

Price Trend-Following Model: Uptrend

Our weekly trend-following model classifies the current market price position as: Uptrend. The current action for the model is considered to be: Hold – Maintain Long Position.

SUGAR Futures StatisticsSPECULATORSCOMMERCIALSSMALL TRADERS
– Percent of Open Interest Longs:35.440.99.6
– Percent of Open Interest Shorts:8.473.04.5
– Net Position:261,001-310,76249,761
– Gross Longs:342,320395,11693,065
– Gross Shorts:81,319705,87843,304
– Long to Short Ratio:4.2 to 10.6 to 12.1 to 1
NET POSITION TREND:
– Strength Index Score (3 Year Range Pct):83.214.867.4
– Strength Index Reading (3 Year Range):Bullish-ExtremeBearish-ExtremeBullish
NET POSITION MOVEMENT INDEX:
– 6-Week Change in Strength Index:-5.56.3-6.6


COFFEE Futures:

COFFEE Futures COT ChartThe COFFEE large speculator standing this week totaled a net position of 33,494 contracts in the data reported through Tuesday. This was a weekly boost of 5,163 contracts from the previous week which had a total of 28,331 net contracts.

This week’s current strength score (the trader positioning range over the past three years, measured from 0 to 100) shows the speculators are currently Bullish with a score of 61.8 percent. The commercials are Bearish with a score of 42.6 percent and the small traders (not shown in chart) are Bearish-Extreme with a score of 11.8 percent.

Price Trend-Following Model: Uptrend

Our weekly trend-following model classifies the current market price position as: Uptrend. The current action for the model is considered to be: Hold – Maintain Long Position.

COFFEE Futures StatisticsSPECULATORSCOMMERCIALSSMALL TRADERS
– Percent of Open Interest Longs:27.841.33.8
– Percent of Open Interest Shorts:9.859.33.8
– Net Position:33,494-33,426-68
– Gross Longs:51,67676,7677,058
– Gross Shorts:18,182110,1937,126
– Long to Short Ratio:2.8 to 10.7 to 11.0 to 1
NET POSITION TREND:
– Strength Index Score (3 Year Range Pct):61.842.611.8
– Strength Index Reading (3 Year Range):BullishBearishBearish-Extreme
NET POSITION MOVEMENT INDEX:
– 6-Week Change in Strength Index:-0.01.1-12.4


SOYBEANS Futures:

SOYBEANS Futures COT ChartThe SOYBEANS large speculator standing this week totaled a net position of 88,532 contracts in the data reported through Tuesday. This was a weekly gain of 25,583 contracts from the previous week which had a total of 62,949 net contracts.

This week’s current strength score (the trader positioning range over the past three years, measured from 0 to 100) shows the speculators are currently Bearish with a score of 23.9 percent. The commercials are Bullish with a score of 73.4 percent and the small traders (not shown in chart) are Bearish with a score of 46.7 percent.

Price Trend-Following Model: Weak Downtrend

Our weekly trend-following model classifies the current market price position as: Weak Downtrend. The current action for the model is considered to be: Hold – Maintain Short Position.

SOYBEANS Futures StatisticsSPECULATORSCOMMERCIALSSMALL TRADERS
– Percent of Open Interest Longs:24.453.36.9
– Percent of Open Interest Shorts:11.163.510.0
– Net Position:88,532-67,634-20,898
– Gross Longs:161,793353,06245,676
– Gross Shorts:73,261420,69666,574
– Long to Short Ratio:2.2 to 10.8 to 10.7 to 1
NET POSITION TREND:
– Strength Index Score (3 Year Range Pct):23.973.446.7
– Strength Index Reading (3 Year Range):BearishBullishBearish
NET POSITION MOVEMENT INDEX:
– 6-Week Change in Strength Index:9.5-10.110.1


SOYBEAN OIL Futures:

SOYBEAN OIL Futures COT ChartThe SOYBEAN OIL large speculator standing this week totaled a net position of 28,127 contracts in the data reported through Tuesday. This was a weekly increase of 13,962 contracts from the previous week which had a total of 14,165 net contracts.

This week’s current strength score (the trader positioning range over the past three years, measured from 0 to 100) shows the speculators are currently Bearish with a score of 34.4 percent. The commercials are Bullish with a score of 67.0 percent and the small traders (not shown in chart) are Bearish with a score of 21.1 percent.

Price Trend-Following Model: Weak Downtrend

Our weekly trend-following model classifies the current market price position as: Weak Downtrend. The current action for the model is considered to be: Hold – Maintain Short Position.

SOYBEAN OIL Futures StatisticsSPECULATORSCOMMERCIALSSMALL TRADERS
– Percent of Open Interest Longs:15.059.25.7
– Percent of Open Interest Shorts:9.565.15.3
– Net Position:28,127-30,1382,011
– Gross Longs:76,705301,79229,161
– Gross Shorts:48,578331,93027,150
– Long to Short Ratio:1.6 to 10.9 to 11.1 to 1
NET POSITION TREND:
– Strength Index Score (3 Year Range Pct):34.467.021.1
– Strength Index Reading (3 Year Range):BearishBullishBearish
NET POSITION MOVEMENT INDEX:
– 6-Week Change in Strength Index:21.1-20.310.7


SOYBEAN MEAL Futures:

SOYBEAN MEAL Futures COT ChartThe SOYBEAN MEAL large speculator standing this week totaled a net position of 107,750 contracts in the data reported through Tuesday. This was a weekly increase of 4,314 contracts from the previous week which had a total of 103,436 net contracts.

This week’s current strength score (the trader positioning range over the past three years, measured from 0 to 100) shows the speculators are currently Bullish with a score of 63.9 percent. The commercials are Bearish with a score of 38.8 percent and the small traders (not shown in chart) are Bearish with a score of 20.4 percent.

Price Trend-Following Model: Downtrend

Our weekly trend-following model classifies the current market price position as: Downtrend. The current action for the model is considered to be: Hold – Maintain Short Position.

SOYBEAN MEAL Futures StatisticsSPECULATORSCOMMERCIALSSMALL TRADERS
– Percent of Open Interest Longs:25.738.69.2
– Percent of Open Interest Shorts:4.562.76.3
– Net Position:107,750-122,18914,439
– Gross Longs:130,518195,98646,491
– Gross Shorts:22,768318,17532,052
– Long to Short Ratio:5.7 to 10.6 to 11.5 to 1
NET POSITION TREND:
– Strength Index Score (3 Year Range Pct):63.938.820.4
– Strength Index Reading (3 Year Range):BullishBearishBearish
NET POSITION MOVEMENT INDEX:
– 6-Week Change in Strength Index:8.7-9.45.2


LIVE CATTLE Futures:

LIVE CATTLE Futures COT ChartThe LIVE CATTLE large speculator standing this week totaled a net position of 105,936 contracts in the data reported through Tuesday. This was a weekly reduction of -6,313 contracts from the previous week which had a total of 112,249 net contracts.

This week’s current strength score (the trader positioning range over the past three years, measured from 0 to 100) shows the speculators are currently Bullish-Extreme with a score of 93.2 percent. The commercials are Bearish-Extreme with a score of 7.7 percent and the small traders (not shown in chart) are Bearish with a score of 23.3 percent.

Price Trend-Following Model: Uptrend

Our weekly trend-following model classifies the current market price position as: Uptrend. The current action for the model is considered to be: Hold – Maintain Long Position.

LIVE CATTLE Futures StatisticsSPECULATORSCOMMERCIALSSMALL TRADERS
– Percent of Open Interest Longs:46.127.58.6
– Percent of Open Interest Shorts:14.755.312.1
– Net Position:105,936-94,062-11,874
– Gross Longs:155,74492,89229,165
– Gross Shorts:49,808186,95441,039
– Long to Short Ratio:3.1 to 10.5 to 10.7 to 1
NET POSITION TREND:
– Strength Index Score (3 Year Range Pct):93.27.723.3
– Strength Index Reading (3 Year Range):Bullish-ExtremeBearish-ExtremeBearish
NET POSITION MOVEMENT INDEX:
– 6-Week Change in Strength Index:8.7-4.9-22.3


LEAN HOGS Futures:

LEAN HOGS Futures COT ChartThe LEAN HOGS large speculator standing this week totaled a net position of -18,727 contracts in the data reported through Tuesday. This was a weekly gain of 7,704 contracts from the previous week which had a total of -26,431 net contracts.

This week’s current strength score (the trader positioning range over the past three years, measured from 0 to 100) shows the speculators are currently Bearish-Extreme with a score of 14.3 percent. The commercials are Bullish-Extreme with a score of 88.9 percent and the small traders (not shown in chart) are Bullish with a score of 74.2 percent.

Price Trend-Following Model: Strong Uptrend

Our weekly trend-following model classifies the current market price position as: Strong Uptrend. The current action for the model is considered to be: Hold – Maintain Long Position.

LEAN HOGS Futures StatisticsSPECULATORSCOMMERCIALSSMALL TRADERS
– Percent of Open Interest Longs:29.440.39.1
– Percent of Open Interest Shorts:39.129.510.2
– Net Position:-18,72720,759-2,032
– Gross Longs:56,56277,52217,534
– Gross Shorts:75,28956,76319,566
– Long to Short Ratio:0.8 to 11.4 to 10.9 to 1
NET POSITION TREND:
– Strength Index Score (3 Year Range Pct):14.388.974.2
– Strength Index Reading (3 Year Range):Bearish-ExtremeBullish-ExtremeBullish
NET POSITION MOVEMENT INDEX:
– 6-Week Change in Strength Index:6.0-2.7-19.6


COTTON Futures:

COTTON Futures COT ChartThe COTTON large speculator standing this week totaled a net position of 6,658 contracts in the data reported through Tuesday. This was a weekly reduction of -4,552 contracts from the previous week which had a total of 11,210 net contracts.

This week’s current strength score (the trader positioning range over the past three years, measured from 0 to 100) shows the speculators are currently Bearish-Extreme with a score of 13.7 percent. The commercials are Bullish-Extreme with a score of 84.3 percent and the small traders (not shown in chart) are Bearish with a score of 29.4 percent.

Price Trend-Following Model: Uptrend

Our weekly trend-following model classifies the current market price position as: Uptrend. The current action for the model is considered to be: Hold – Maintain Long Position.

COTTON Futures StatisticsSPECULATORSCOMMERCIALSSMALL TRADERS
– Percent of Open Interest Longs:30.851.07.8
– Percent of Open Interest Shorts:26.956.26.5
– Net Position:6,658-8,8682,210
– Gross Longs:52,44586,86913,339
– Gross Shorts:45,78795,73711,129
– Long to Short Ratio:1.1 to 10.9 to 11.2 to 1
NET POSITION TREND:
– Strength Index Score (3 Year Range Pct):13.784.329.4
– Strength Index Reading (3 Year Range):Bearish-ExtremeBullish-ExtremeBearish
NET POSITION MOVEMENT INDEX:
– 6-Week Change in Strength Index:4.1-5.112.4


COCOA Futures:

COCOA Futures COT ChartThe COCOA large speculator standing this week totaled a net position of 67,342 contracts in the data reported through Tuesday. This was a weekly lowering of -10,597 contracts from the previous week which had a total of 77,939 net contracts.

This week’s current strength score (the trader positioning range over the past three years, measured from 0 to 100) shows the speculators are currently Bullish-Extreme with a score of 88.8 percent. The commercials are Bearish-Extreme with a score of 10.8 percent and the small traders (not shown in chart) are Bearish with a score of 42.8 percent.

Price Trend-Following Model: Uptrend

Our weekly trend-following model classifies the current market price position as: Uptrend. The current action for the model is considered to be: Hold – Maintain Long Position.

COCOA Futures StatisticsSPECULATORSCOMMERCIALSSMALL TRADERS
– Percent of Open Interest Longs:44.727.94.3
– Percent of Open Interest Shorts:24.949.03.0
– Net Position:67,342-71,9684,626
– Gross Longs:152,23995,15114,724
– Gross Shorts:84,897167,11910,098
– Long to Short Ratio:1.8 to 10.6 to 11.5 to 1
NET POSITION TREND:
– Strength Index Score (3 Year Range Pct):88.810.842.8
– Strength Index Reading (3 Year Range):Bullish-ExtremeBearish-ExtremeBearish
NET POSITION MOVEMENT INDEX:
– 6-Week Change in Strength Index:5.6-5.4-1.5


WHEAT Futures:

WHEAT Futures COT ChartThe WHEAT large speculator standing this week totaled a net position of -66,364 contracts in the data reported through Tuesday. This was a weekly lift of 20,463 contracts from the previous week which had a total of -86,827 net contracts.

This week’s current strength score (the trader positioning range over the past three years, measured from 0 to 100) shows the speculators are currently Bearish-Extreme with a score of 19.6 percent. The commercials are Bullish-Extreme with a score of 80.0 percent and the small traders (not shown in chart) are Bullish-Extreme with a score of 81.7 percent.

Price Trend-Following Model: Weak Downtrend

Our weekly trend-following model classifies the current market price position as: Weak Downtrend. The current action for the model is considered to be: Hold – Maintain Short Position.

WHEAT Futures StatisticsSPECULATORSCOMMERCIALSSMALL TRADERS
– Percent of Open Interest Longs:27.738.610.0
– Percent of Open Interest Shorts:46.520.59.3
– Net Position:-66,36463,8622,502
– Gross Longs:98,146136,41635,384
– Gross Shorts:164,51072,55432,882
– Long to Short Ratio:0.6 to 11.9 to 11.1 to 1
NET POSITION TREND:
– Strength Index Score (3 Year Range Pct):19.680.081.7
– Strength Index Reading (3 Year Range):Bearish-ExtremeBullish-ExtremeBullish-Extreme
NET POSITION MOVEMENT INDEX:
– 6-Week Change in Strength Index:13.1-13.4-5.7


Article By InvestMacroReceive our weekly COT Newsletter

*COT Report: The COT data, released weekly to the public each Friday, is updated through the most recent Tuesday (data is 3 days old) and shows a quick view of how large speculators or non-commercials (for-profit traders) were positioned in the futures markets.

The CFTC categorizes trader positions according to commercial hedgers (traders who use futures contracts for hedging as part of the business), non-commercials (large traders who speculate to realize trading profits) and nonreportable traders (usually small traders/speculators) as well as their open interest (contracts open in the market at time of reporting). See CFTC criteria here.

COT Bonds Charts: Speculators raised Fed Funds and SOFR 3-Months bets this week

By InvestMacro

Here are the latest charts and statistics for the Commitment of Traders (COT) reports data published by the Commodities Futures Trading Commission (CFTC).

The latest COT data is updated through Tuesday June 20th and shows a quick view of how large traders (for-profit speculators and commercial hedgers) were positioned in the futures markets.

Weekly Speculator Changes led by Fed Funds & SOFR 3-Months

The COT bond market speculator bets were higher this week as five out of the nine bond markets we cover had higher positioning while the other four markets had lower speculator contracts.

Leading the gains for the bond markets was the Fed Funds (84,512 contracts) with the SOFR 3-Months (78,952 contracts), 5-Year Bonds (76,570 contracts), the 2-Year Bonds (19,169 contracts) and  the Ultra 10-Year Bonds (1,640 contracts) also showing positive weeks.

The bond markets with declines in speculator bets for the week were the 10-Year Bonds (-58,144 contracts), the Ultra Treasury Bonds (-6,411 contracts), the Eurodollar (-8,627 contracts) and the US Treasury Bonds (-2,554 contracts) also registering lower bets on the week.


Data Snapshot of Bond Market Traders | Columns Legend
Jun-13-2023OIOI-IndexSpec-NetSpec-IndexCom-NetCOM-IndexSmalls-NetSmalls-Index
Eurodollar511,7110-11,6727423,43222-11,76097
FedFunds1,693,14163-101,64232115,60769-13,96564
2-Year3,503,880100-1,027,2762939,5879887,68997
Long T-Bond1,233,35963-102,3015166,4933435,80874
10-Year4,641,76786-749,99710681,0439268,95489
5-Year4,948,67092-958,8267931,1719227,65589


Strength Scores led by SOFR 3-Months & Eurodollar

COT Strength Scores (a normalized measure of Speculator positions over a 3-Year range, from 0 to 100 where above 80 is Extreme-Bullish and below 20 is Extreme-Bearish) showed that the SOFR 3-Months (100 percent) and the Eurodollar (74 percent) lead the bond markets this week. The US Treasury Bonds (51 percent) comes in as the next highest in the weekly strength scores.

On the downside, the 2-Year Bonds (2 percent), the 5-Year Bonds (7 percent), the 10-Year Bonds (10 percent), Ultra 10-Year Bond (17.0 percent) and the Ultra Treasury Bonds (17 percent) come in at the lowest strength levels currently and are in Extreme-Bearish territory (below 20 percent).

Strength Statistics:
Fed Funds (31.6 percent) vs Fed Funds previous week (19.4 percent)
2-Year Bond (1.7 percent) vs 2-Year Bond previous week (0.0 percent)
5-Year Bond (6.8 percent) vs 5-Year Bond previous week (0.0 percent)
10-Year Bond (9.7 percent) vs 10-Year Bond previous week (15.4 percent)
Ultra 10-Year Bond (17.0 percent) vs Ultra 10-Year Bond previous week (16.7 percent)
US Treasury Bond (51.3 percent) vs US Treasury Bond previous week (52.1 percent)
Ultra US Treasury Bond (17.3 percent) vs Ultra US Treasury Bond previous week (20.0 percent)
Eurodollar (73.7 percent) vs Eurodollar previous week (74.0 percent)
SOFR 3-Months (100.0 percent) vs SOFR 3-Months previous week (94.2 percent)


SOFR 3-Months & Ultra 10-Year Bonds top the 6-Week Strength Trends

COT Strength Score Trends (or move index, calculates the 6-week changes in strength scores) showed that the SOFR 3-Months (48 percent) and the Ultra 10-Year Bonds (16 percent) lead the past six weeks trends for bonds. The Eurodollar (1 percent) and the  are the next highest positive movers in the latest trends data.

The 2-Year Bonds (-25 percent) and the US Treasury Bonds (-10 percent) lead the downside trend scores currently with the 5-Year Bonds (-4 percent) and the Fed Funds (-4 percent) following next with lower trend scores.

Strength Trend Statistics:
Fed Funds (-3.8 percent) vs Fed Funds previous week (-21.1 percent)
2-Year Bond (-24.5 percent) vs 2-Year Bond previous week (-36.4 percent)
5-Year Bond (-4.3 percent) vs 5-Year Bond previous week (-11.1 percent)
10-Year Bond (-1.8 percent) vs 10-Year Bond previous week (5.6 percent)
Ultra 10-Year Bond (15.6 percent) vs Ultra 10-Year Bond previous week (16.7 percent)
US Treasury Bond (-9.5 percent) vs US Treasury Bond previous week (-3.4 percent)
Ultra US Treasury Bond (-1.2 percent) vs Ultra US Treasury Bond previous week (0.8 percent)
Eurodollar (1.1 percent) vs Eurodollar previous week (1.0 percent)
SOFR 3-Months (47.9 percent) vs SOFR 3-Months previous week (54.7 percent)


Individual Bond Markets:

3-Month Eurodollars Futures:

Eurodollar Bonds Futures COT ChartThe 3-Month Eurodollars large speculator standing this week was a net position of -11,672 contracts in the data reported through Tuesday. This was a weekly fall of -8,627 contracts from the previous week which had a total of -3,045 net contracts.

This week’s current strength score (the trader positioning range over the past three years, measured from 0 to 100) shows the speculators are currently Bullish with a score of 73.7 percent. The commercials are Bearish with a score of 22.3 percent and the small traders (not shown in chart) are Bullish-Extreme with a score of 96.8 percent.

Price Trend-Following Model: Strong Downtrend

Our weekly trend-following model classifies the current market price position as: Strong Downtrend. The current action for the model is considered to be: Hold – Maintain Short Position.

3-Month Eurodollars StatisticsSPECULATORSCOMMERCIALSSMALL TRADERS
– Percent of Open Interest Longs:23.167.29.0
– Percent of Open Interest Shorts:25.462.611.3
– Net Position:-11,67223,432-11,760
– Gross Longs:118,404343,97845,860
– Gross Shorts:130,076320,54657,620
– Long to Short Ratio:0.9 to 11.1 to 10.8 to 1
NET POSITION TREND:
– Strength Index Score (3 Year Range Pct):73.722.396.8
– Strength Index Reading (3 Year Range):BullishBearishBullish-Extreme
NET POSITION MOVEMENT INDEX:
– 6-Week Change in Strength Index:1.1-1.00.1


Secured Overnight Financing Rate (3-Month) Futures:

SOFR 3-Months Bonds Futures COT ChartThe Secured Overnight Financing Rate (3-Month) large speculator standing this week was a net position of 204,698 contracts in the data reported through Tuesday. This was a weekly boost of 78,952 contracts from the previous week which had a total of 125,746 net contracts.

This week’s current strength score (the trader positioning range over the past three years, measured from 0 to 100) shows the speculators are currently Bullish-Extreme with a score of 100.0 percent. The commercials are Bearish-Extreme with a score of 0.0 percent and the small traders (not shown in chart) are Bullish with a score of 79.7 percent.

Price Trend-Following Model: Weak Uptrend

Our weekly trend-following model classifies the current market price position as: Weak Uptrend. The current action for the model is considered to be: Hold – Maintain Long Position.

SOFR 3-Months StatisticsSPECULATORSCOMMERCIALSSMALL TRADERS
– Percent of Open Interest Longs:17.460.11.2
– Percent of Open Interest Shorts:15.462.01.3
– Net Position:204,698-189,803-14,895
– Gross Longs:1,811,3136,267,481122,143
– Gross Shorts:1,606,6156,457,284137,038
– Long to Short Ratio:1.1 to 11.0 to 10.9 to 1
NET POSITION TREND:
– Strength Index Score (3 Year Range Pct):100.00.079.7
– Strength Index Reading (3 Year Range):Bullish-ExtremeBearish-ExtremeBullish
NET POSITION MOVEMENT INDEX:
– 6-Week Change in Strength Index:47.9-47.7-5.6


30-Day Federal Funds Futures:

Federal Funds 30-Day Bonds Futures COT ChartThe 30-Day Federal Funds large speculator standing this week was a net position of -101,642 contracts in the data reported through Tuesday. This was a weekly boost of 84,512 contracts from the previous week which had a total of -186,154 net contracts.

This week’s current strength score (the trader positioning range over the past three years, measured from 0 to 100) shows the speculators are currently Bearish with a score of 31.6 percent. The commercials are Bullish with a score of 69.3 percent and the small traders (not shown in chart) are Bullish with a score of 63.6 percent.

Price Trend-Following Model: Downtrend

Our weekly trend-following model classifies the current market price position as: Downtrend. The current action for the model is considered to be: Hold – Maintain Short Position.

30-Day Federal Funds StatisticsSPECULATORSCOMMERCIALSSMALL TRADERS
– Percent of Open Interest Longs:8.771.12.7
– Percent of Open Interest Shorts:14.764.33.5
– Net Position:-101,642115,607-13,965
– Gross Longs:147,2921,204,55045,368
– Gross Shorts:248,9341,088,94359,333
– Long to Short Ratio:0.6 to 11.1 to 10.8 to 1
NET POSITION TREND:
– Strength Index Score (3 Year Range Pct):31.669.363.6
– Strength Index Reading (3 Year Range):BearishBullishBullish
NET POSITION MOVEMENT INDEX:
– 6-Week Change in Strength Index:-3.81.629.0


2-Year Treasury Note Futures:

2-Year Treasury Bonds Futures COT ChartThe 2-Year Treasury Note large speculator standing this week was a net position of -1,027,276 contracts in the data reported through Tuesday. This was a weekly boost of 19,169 contracts from the previous week which had a total of -1,046,445 net contracts.

This week’s current strength score (the trader positioning range over the past three years, measured from 0 to 100) shows the speculators are currently Bearish-Extreme with a score of 1.7 percent. The commercials are Bullish-Extreme with a score of 98.0 percent and the small traders (not shown in chart) are Bullish-Extreme with a score of 96.5 percent.

Price Trend-Following Model: Weak Uptrend

Our weekly trend-following model classifies the current market price position as: Weak Uptrend. The current action for the model is considered to be: Hold – Maintain Long Position.

2-Year Treasury Note StatisticsSPECULATORSCOMMERCIALSSMALL TRADERS
– Percent of Open Interest Longs:11.680.97.0
– Percent of Open Interest Shorts:40.954.14.5
– Net Position:-1,027,276939,58787,689
– Gross Longs:406,8482,836,230244,127
– Gross Shorts:1,434,1241,896,643156,438
– Long to Short Ratio:0.3 to 11.5 to 11.6 to 1
NET POSITION TREND:
– Strength Index Score (3 Year Range Pct):1.798.096.5
– Strength Index Reading (3 Year Range):Bearish-ExtremeBullish-ExtremeBullish-Extreme
NET POSITION MOVEMENT INDEX:
– 6-Week Change in Strength Index:-24.525.79.0


5-Year Treasury Note Futures:

5-Year Treasury Bonds Futures COT ChartThe 5-Year Treasury Note large speculator standing this week was a net position of -958,826 contracts in the data reported through Tuesday. This was a weekly boost of 76,570 contracts from the previous week which had a total of -1,035,396 net contracts.

This week’s current strength score (the trader positioning range over the past three years, measured from 0 to 100) shows the speculators are currently Bearish-Extreme with a score of 6.8 percent. The commercials are Bullish-Extreme with a score of 91.8 percent and the small traders (not shown in chart) are Bullish-Extreme with a score of 88.6 percent.

Price Trend-Following Model: Weak Uptrend

Our weekly trend-following model classifies the current market price position as: Weak Uptrend. The current action for the model is considered to be: Hold – Maintain Long Position.

5-Year Treasury Note StatisticsSPECULATORSCOMMERCIALSSMALL TRADERS
– Percent of Open Interest Longs:8.083.47.3
– Percent of Open Interest Shorts:27.364.66.8
– Net Position:-958,826931,17127,655
– Gross Longs:394,4574,129,490363,566
– Gross Shorts:1,353,2833,198,319335,911
– Long to Short Ratio:0.3 to 11.3 to 11.1 to 1
NET POSITION TREND:
– Strength Index Score (3 Year Range Pct):6.891.888.6
– Strength Index Reading (3 Year Range):Bearish-ExtremeBullish-ExtremeBullish-Extreme
NET POSITION MOVEMENT INDEX:
– 6-Week Change in Strength Index:-4.35.3-2.9


10-Year Treasury Note Futures:

10-Year Treasury Notes Bonds Futures COT ChartThe 10-Year Treasury Note large speculator standing this week was a net position of -749,997 contracts in the data reported through Tuesday. This was a weekly reduction of -58,144 contracts from the previous week which had a total of -691,853 net contracts.

This week’s current strength score (the trader positioning range over the past three years, measured from 0 to 100) shows the speculators are currently Bearish-Extreme with a score of 9.7 percent. The commercials are Bullish-Extreme with a score of 91.8 percent and the small traders (not shown in chart) are Bullish-Extreme with a score of 88.5 percent.

Price Trend-Following Model: Weak Uptrend

Our weekly trend-following model classifies the current market price position as: Weak Uptrend. The current action for the model is considered to be: Hold – Maintain Long Position.

10-Year Treasury Note StatisticsSPECULATORSCOMMERCIALSSMALL TRADERS
– Percent of Open Interest Longs:9.279.99.0
– Percent of Open Interest Shorts:25.365.27.5
– Net Position:-749,997681,04368,954
– Gross Longs:425,9653,708,456415,816
– Gross Shorts:1,175,9623,027,413346,862
– Long to Short Ratio:0.4 to 11.2 to 11.2 to 1
NET POSITION TREND:
– Strength Index Score (3 Year Range Pct):9.791.888.5
– Strength Index Reading (3 Year Range):Bearish-ExtremeBullish-ExtremeBullish-Extreme
NET POSITION MOVEMENT INDEX:
– 6-Week Change in Strength Index:-1.84.2-4.6


Ultra 10-Year Notes Futures:

Ultra 10-Year Treasury Notes Bonds Futures COT ChartThe Ultra 10-Year Notes large speculator standing this week was a net position of -134,686 contracts in the data reported through Tuesday. This was a weekly rise of 1,640 contracts from the previous week which had a total of -136,326 net contracts.

This week’s current strength score (the trader positioning range over the past three years, measured from 0 to 100) shows the speculators are currently Bearish-Extreme with a score of 17.0 percent. The commercials are Bullish with a score of 77.1 percent and the small traders (not shown in chart) are Bullish with a score of 74.8 percent.

Price Trend-Following Model: Weak Uptrend

Our weekly trend-following model classifies the current market price position as: Weak Uptrend. The current action for the model is considered to be: Hold – Maintain Long Position.

Ultra 10-Year Notes StatisticsSPECULATORSCOMMERCIALSSMALL TRADERS
– Percent of Open Interest Longs:10.576.811.3
– Percent of Open Interest Shorts:18.565.015.1
– Net Position:-134,686200,704-66,018
– Gross Longs:179,2261,306,770191,631
– Gross Shorts:313,9121,106,066257,649
– Long to Short Ratio:0.6 to 11.2 to 10.7 to 1
NET POSITION TREND:
– Strength Index Score (3 Year Range Pct):17.077.174.8
– Strength Index Reading (3 Year Range):Bearish-ExtremeBullishBullish
NET POSITION MOVEMENT INDEX:
– 6-Week Change in Strength Index:15.6-17.93.7


US Treasury Bonds Futures:

US Year Treasury Notes Long Bonds Futures COT ChartThe US Treasury Bonds large speculator standing this week was a net position of -102,301 contracts in the data reported through Tuesday. This was a weekly decrease of -2,554 contracts from the previous week which had a total of -99,747 net contracts.

This week’s current strength score (the trader positioning range over the past three years, measured from 0 to 100) shows the speculators are currently Bullish with a score of 51.3 percent. The commercials are Bearish with a score of 34.3 percent and the small traders (not shown in chart) are Bullish with a score of 74.5 percent.

Price Trend-Following Model: Strong Downtrend

Our weekly trend-following model classifies the current market price position as: Strong Downtrend. The current action for the model is considered to be: Hold – Maintain Short Position.

US Treasury Bonds StatisticsSPECULATORSCOMMERCIALSSMALL TRADERS
– Percent of Open Interest Longs:7.377.314.5
– Percent of Open Interest Shorts:15.671.911.6
– Net Position:-102,30166,49335,808
– Gross Longs:89,659952,842178,917
– Gross Shorts:191,960886,349143,109
– Long to Short Ratio:0.5 to 11.1 to 11.3 to 1
NET POSITION TREND:
– Strength Index Score (3 Year Range Pct):51.334.374.5
– Strength Index Reading (3 Year Range):BullishBearishBullish
NET POSITION MOVEMENT INDEX:
– 6-Week Change in Strength Index:-9.522.9-25.5


Ultra US Treasury Bonds Futures:

Ultra US Year Treasury Notes Long Bonds Futures COT ChartThe Ultra US Treasury Bonds large speculator standing this week was a net position of -403,404 contracts in the data reported through Tuesday. This was a weekly lowering of -6,411 contracts from the previous week which had a total of -396,993 net contracts.

This week’s current strength score (the trader positioning range over the past three years, measured from 0 to 100) shows the speculators are currently Bearish-Extreme with a score of 17.3 percent. The commercials are Bullish with a score of 71.6 percent and the small traders (not shown in chart) are Bullish-Extreme with a score of 100.0 percent.

Price Trend-Following Model: Downtrend

Our weekly trend-following model classifies the current market price position as: Downtrend. The current action for the model is considered to be: Hold – Maintain Short Position.

Ultra US Treasury Bonds StatisticsSPECULATORSCOMMERCIALSSMALL TRADERS
– Percent of Open Interest Longs:5.682.311.7
– Percent of Open Interest Shorts:33.059.17.5
– Net Position:-403,404342,02461,380
– Gross Longs:82,6951,212,061172,397
– Gross Shorts:486,099870,037111,017
– Long to Short Ratio:0.2 to 11.4 to 11.6 to 1
NET POSITION TREND:
– Strength Index Score (3 Year Range Pct):17.371.6100.0
– Strength Index Reading (3 Year Range):Bearish-ExtremeBullishBullish-Extreme
NET POSITION MOVEMENT INDEX:
– 6-Week Change in Strength Index:-1.20.61.7


Article By InvestMacroReceive our weekly COT Newsletter

*COT Report: The COT data, released weekly to the public each Friday, is updated through the most recent Tuesday (data is 3 days old) and shows a quick view of how large speculators or non-commercials (for-profit traders) were positioned in the futures markets.

The CFTC categorizes trader positions according to commercial hedgers (traders who use futures contracts for hedging as part of the business), non-commercials (large traders who speculate to realize trading profits) and nonreportable traders (usually small traders/speculators) as well as their open interest (contracts open in the market at time of reporting). See CFTC criteria here.