
By InvestMacro
Here are the latest charts and statistics for the Commitment of Traders (COT) reports data published by the Commodities Futures Trading Commission (CFTC).
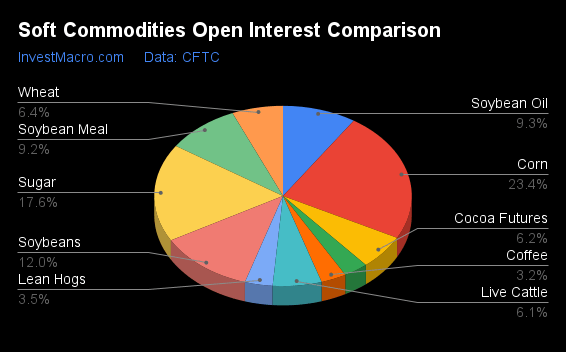
The latest COT data is updated through Tuesday June 20th and shows a quick view of how large traders (for-profit speculators and commercial entities) were positioned in the futures markets.
Weekly Speculator Changes led by Sugar & Corn
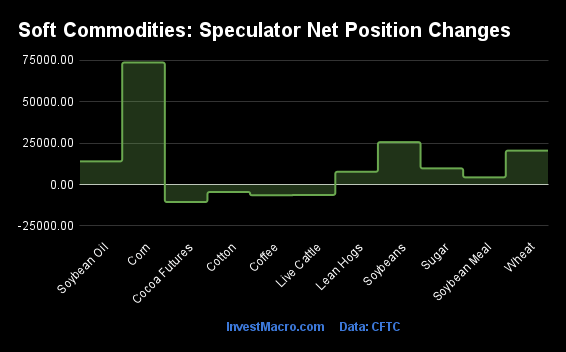
The COT soft commodities markets speculator bets were higher this week as eight out of the eleven softs markets we cover had higher positioning while the other three markets had lower speculator contracts.
Free Reports:
 Sign Up for Our Stock Market Newsletter – Get updated on News, Charts & Rankings of Public Companies when you join our Stocks Newsletter
 Get our Weekly Commitment of Traders Reports - See where the biggest traders (Hedge Funds and Commercial Hedgers) are positioned in the futures markets on a weekly basis.
Leading the gains for the softs markets was Corn (73,681 contracts) with Soybeans (25,583 contracts), Wheat (20,463 contracts), Soybean Oil (13,962 contracts), Sugar (9,741 contracts), Lean Hogs (7,704 contracts), Coffee (5,163 contracts) and Soybean Meal (4,314 contracts) also showing positive weeks.
The markets with the declines in speculator bets this week were Cocoa (-10,597 contracts) with Cotton (-4,552 contracts) and Live Cattle (-6,313 contracts) also registering lower bets on the week.
Corn Speculators push their bullish bets sharply higher on drought
Highlighting the COT soft commodities data this week is the renewed bullish appetite of the Corn’s speculator’s positioning. The speculator positioning sharply jumped this week by over +73,681 contracts following a gain of +59,863 contracts last week. The Corn speculative bets have risen in four straight weeks and for six out of the past seven weeks.
The grains markets have been starting to see higher prices coming back over the past month due to a drought in the US Midwest that has been stated as the worst since 2012. Speculators have been reacting to the changes in the weather and have now pushed their overall net standing for Corn back into a bullish position last week after spending the previous six weeks in bearish territory.
Corn’s futures price had been on a rise for three out of the previous four weeks and touched a nine-week high this week above 672.0 but ended up closing the week lower at the 630.6 price level.
| Jun-20-2023 | OI | OI-Index | Spec-Net | Spec-Index | Com-Net | COM-Index | Smalls-Net | Smalls-Index |
|---|---|---|---|---|---|---|---|---|
| WTI Crude | 1,846,816 | 40 | 166,477 | 3 | -189,918 | 97 | 23,441 | 26 |
| Gold | 438,037 | 7 | 162,975 | 49 | -186,537 | 52 | 23,562 | 39 |
| Silver | 152,633 | 40 | 20,058 | 47 | -36,210 | 50 | 16,152 | 56 |
| Copper | 204,399 | 46 | 1,888 | 32 | -4,003 | 68 | 2,115 | 32 |
| Palladium | 12,304 | 87 | -6,635 | 5 | 7,214 | 96 | -579 | 7 |
| Platinum | 69,436 | 70 | 19,472 | 61 | -25,052 | 42 | 5,580 | 43 |
| Natural Gas | 1,303,558 | 69 | -109,315 | 28 | 79,735 | 71 | 29,580 | 50 |
| Brent | 144,348 | 17 | -47,056 | 13 | 45,090 | 91 | 1,966 | 36 |
| Heating Oil | 310,297 | 40 | 16,100 | 57 | -28,496 | 61 | 12,396 | 41 |
| Soybeans | 662,469 | 19 | 88,532 | 24 | -67,634 | 73 | -20,898 | 47 |
| Corn | 1,290,348 | 13 | 118,773 | 39 | -58,030 | 67 | -60,743 | 28 |
| Coffee | 185,800 | 7 | 33,494 | 62 | -33,426 | 43 | -68 | 12 |
| Sugar | 967,113 | 63 | 261,001 | 83 | -310,762 | 15 | 49,761 | 67 |
| Wheat | 353,865 | 39 | -66,364 | 20 | 63,862 | 80 | 2,502 | 82 |
Strength Scores led by Live Cattle & Cocoa
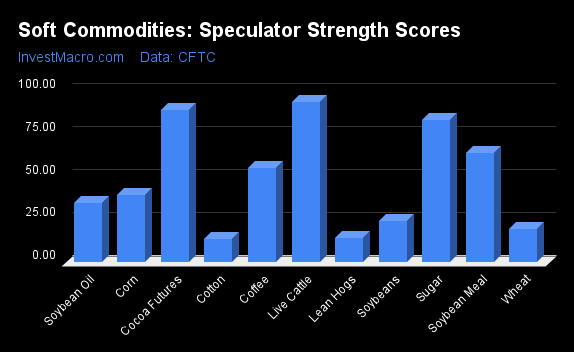
COT Strength Scores (a normalized measure of Speculator positions over a 3-Year range, from 0 to 100 where above 80 is Extreme-Bullish and below 20 is Extreme-Bearish) showed that Live Cattle (93 percent), Cocoa (89 percent) and Sugar (83 percent) lead the softs markets this week.
On the downside, Lean Hogs (14 percent) and Cotton (14 percent) come in at the lowest strength levels currently and are in Extreme-Bearish territory (below 20 percent).
Strength Statistics:
Corn (39.2 percent) vs Corn previous week (28.7 percent)
Sugar (83.2 percent) vs Sugar previous week (79.7 percent)
Coffee (61.8 percent) vs Coffee previous week (56.5 percent)
Soybeans (23.9 percent) vs Soybeans previous week (13.9 percent)
Soybean Oil (34.4 percent) vs Soybean Oil previous week (26.3 percent)
Soybean Meal (63.9 percent) vs Soybean Meal previous week (61.6 percent)
Live Cattle (93.2 percent) vs Live Cattle previous week (100.0 percent)
Lean Hogs (14.3 percent) vs Lean Hogs previous week (8.0 percent)
Cotton (13.7 percent) vs Cotton previous week (17.2 percent)
Cocoa (88.8 percent) vs Cocoa previous week (100.0 percent)
Wheat (19.6 percent) vs Wheat previous week (5.1 percent)
Corn & Soybean Oil top the 6-Week Strength Trends
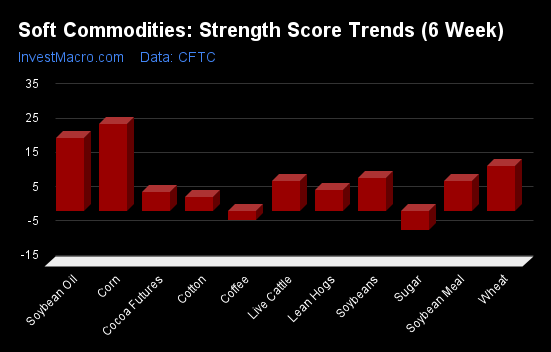
COT Strength Score Trends (or move index, calculates the 6-week changes in strength scores) showed that Corn (25 percent) and Soybean Oil (21 percent) lead the past six weeks trends for soft commodities. Wheat (13 percent), Soybeans (10 percent) and Soybean Meal (9 percent) are the next highest positive movers in the latest trends data.
Sugar (-6 percent) leads the downside trend scores currently with Coffee (0 percent), Cotton (4 percent) and Lean Hogs (6 percent) following next with lower trend scores.
Strength Trend Statistics:
Corn (25.2 percent) vs Corn previous week (15.0 percent)
Sugar (-5.5 percent) vs Sugar previous week (-5.7 percent)
Coffee (-0.0 percent) vs Coffee previous week (-8.5 percent)
Soybeans (9.5 percent) vs Soybeans previous week (-4.8 percent)
Soybean Oil (21.1 percent) vs Soybean Oil previous week (19.8 percent)
Soybean Meal (8.7 percent) vs Soybean Meal previous week (7.6 percent)
Live Cattle (8.7 percent) vs Live Cattle previous week (8.0 percent)
Lean Hogs (6.0 percent) vs Lean Hogs previous week (-5.5 percent)
Cotton (4.1 percent) vs Cotton previous week (13.7 percent)
Cocoa (5.6 percent) vs Cocoa previous week (21.0 percent)
Wheat (13.1 percent) vs Wheat previous week (2.4 percent)
Individual Soft Commodities Markets:
CORN Futures:
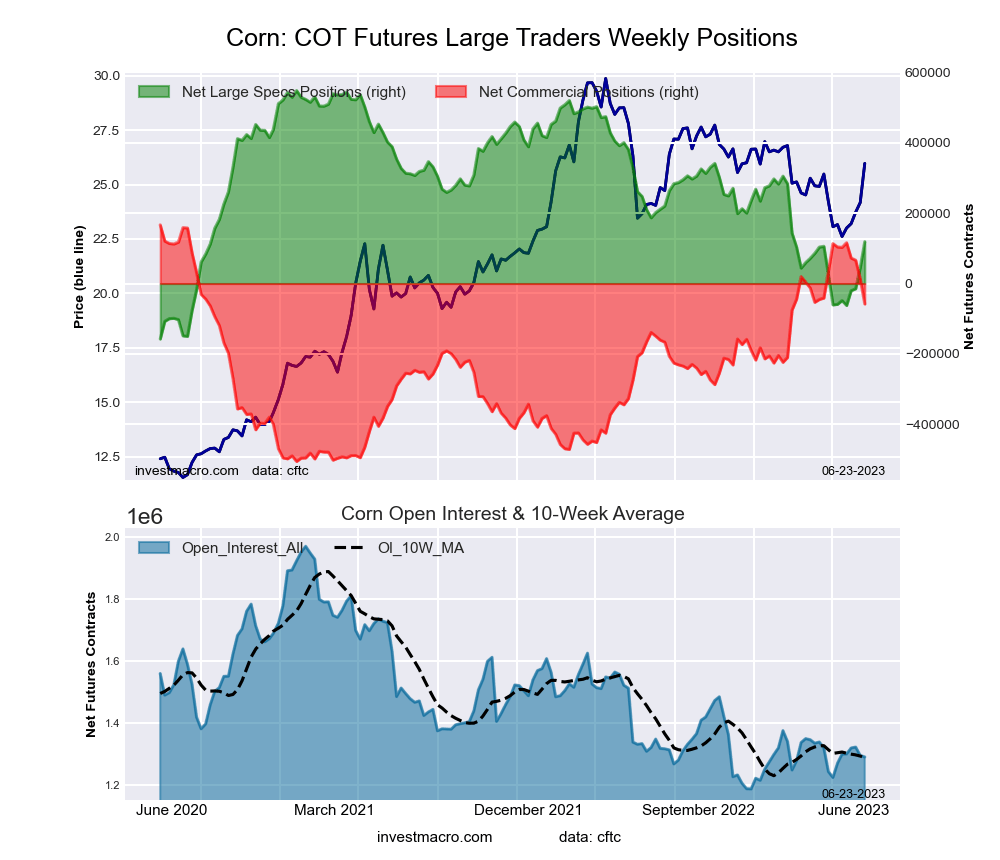 The CORN large speculator standing this week totaled a net position of 118,773 contracts in the data reported through Tuesday. This was a weekly gain of 73,681 contracts from the previous week which had a total of 45,092 net contracts.
This week’s current strength score (the trader positioning range over the past three years, measured from 0 to 100) shows the speculators are currently Bearish with a score of 39.2 percent. The commercials are Bullish with a score of 66.6 percent and the small traders (not shown in chart) are Bearish with a score of 27.7 percent.
Price Trend-Following Model: Weak Downtrend
Our weekly trend-following model classifies the current market price position as: Weak Downtrend. The current action for the model is considered to be: Hold – Maintain Short Position.
| CORN Futures Statistics | SPECULATORS | COMMERCIALS | SMALL TRADERS |
| – Percent of Open Interest Longs: | 26.5 | 48.3 | 9.4 |
| – Percent of Open Interest Shorts: | 17.3 | 52.8 | 14.1 |
| – Net Position: | 118,773 | -58,030 | -60,743 |
| – Gross Longs: | 342,125 | 623,477 | 121,205 |
| – Gross Shorts: | 223,352 | 681,507 | 181,948 |
| – Long to Short Ratio: | 1.5 to 1 | 0.9 to 1 | 0.7 to 1 |
| NET POSITION TREND: | |||
| – Strength Index Score (3 Year Range Pct): | 39.2 | 66.6 | 27.7 |
| – Strength Index Reading (3 Year Range): | Bearish | Bullish | Bearish |
| NET POSITION MOVEMENT INDEX: | |||
| – 6-Week Change in Strength Index: | 25.2 | -24.1 | -22.0 |
SUGAR Futures:
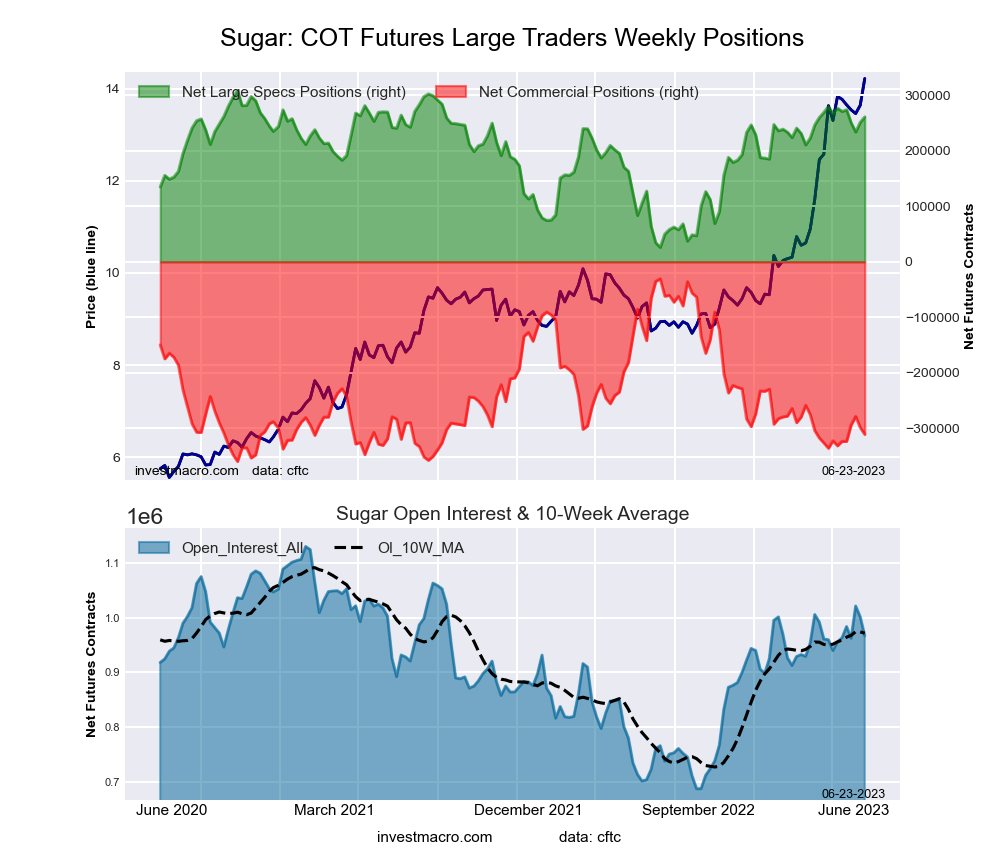 The SUGAR large speculator standing this week totaled a net position of 261,001 contracts in the data reported through Tuesday. This was a weekly rise of 9,741 contracts from the previous week which had a total of 251,260 net contracts.
This week’s current strength score (the trader positioning range over the past three years, measured from 0 to 100) shows the speculators are currently Bullish-Extreme with a score of 83.2 percent. The commercials are Bearish-Extreme with a score of 14.8 percent and the small traders (not shown in chart) are Bullish with a score of 67.4 percent.
Price Trend-Following Model: Uptrend
Our weekly trend-following model classifies the current market price position as: Uptrend. The current action for the model is considered to be: Hold – Maintain Long Position.
| SUGAR Futures Statistics | SPECULATORS | COMMERCIALS | SMALL TRADERS |
| – Percent of Open Interest Longs: | 35.4 | 40.9 | 9.6 |
| – Percent of Open Interest Shorts: | 8.4 | 73.0 | 4.5 |
| – Net Position: | 261,001 | -310,762 | 49,761 |
| – Gross Longs: | 342,320 | 395,116 | 93,065 |
| – Gross Shorts: | 81,319 | 705,878 | 43,304 |
| – Long to Short Ratio: | 4.2 to 1 | 0.6 to 1 | 2.1 to 1 |
| NET POSITION TREND: | |||
| – Strength Index Score (3 Year Range Pct): | 83.2 | 14.8 | 67.4 |
| – Strength Index Reading (3 Year Range): | Bullish-Extreme | Bearish-Extreme | Bullish |
| NET POSITION MOVEMENT INDEX: | |||
| – 6-Week Change in Strength Index: | -5.5 | 6.3 | -6.6 |
COFFEE Futures:
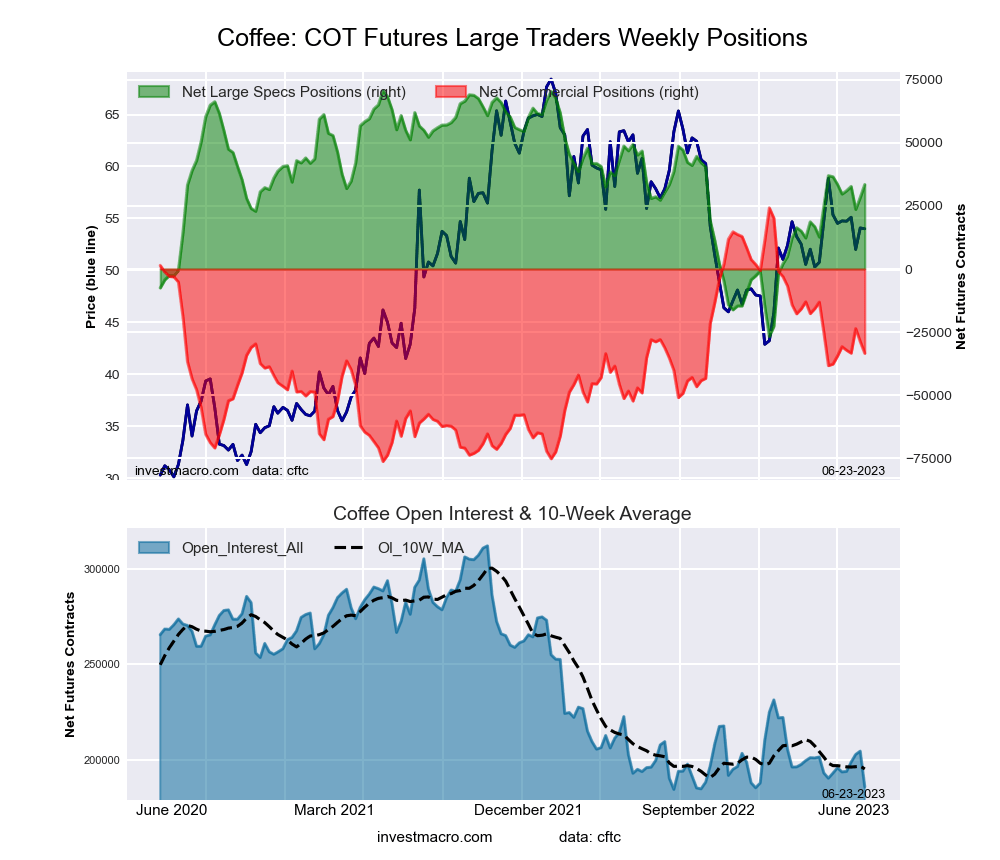 The COFFEE large speculator standing this week totaled a net position of 33,494 contracts in the data reported through Tuesday. This was a weekly boost of 5,163 contracts from the previous week which had a total of 28,331 net contracts.
This week’s current strength score (the trader positioning range over the past three years, measured from 0 to 100) shows the speculators are currently Bullish with a score of 61.8 percent. The commercials are Bearish with a score of 42.6 percent and the small traders (not shown in chart) are Bearish-Extreme with a score of 11.8 percent.
Price Trend-Following Model: Uptrend
Our weekly trend-following model classifies the current market price position as: Uptrend. The current action for the model is considered to be: Hold – Maintain Long Position.
| COFFEE Futures Statistics | SPECULATORS | COMMERCIALS | SMALL TRADERS |
| – Percent of Open Interest Longs: | 27.8 | 41.3 | 3.8 |
| – Percent of Open Interest Shorts: | 9.8 | 59.3 | 3.8 |
| – Net Position: | 33,494 | -33,426 | -68 |
| – Gross Longs: | 51,676 | 76,767 | 7,058 |
| – Gross Shorts: | 18,182 | 110,193 | 7,126 |
| – Long to Short Ratio: | 2.8 to 1 | 0.7 to 1 | 1.0 to 1 |
| NET POSITION TREND: | |||
| – Strength Index Score (3 Year Range Pct): | 61.8 | 42.6 | 11.8 |
| – Strength Index Reading (3 Year Range): | Bullish | Bearish | Bearish-Extreme |
| NET POSITION MOVEMENT INDEX: | |||
| – 6-Week Change in Strength Index: | -0.0 | 1.1 | -12.4 |
SOYBEANS Futures:
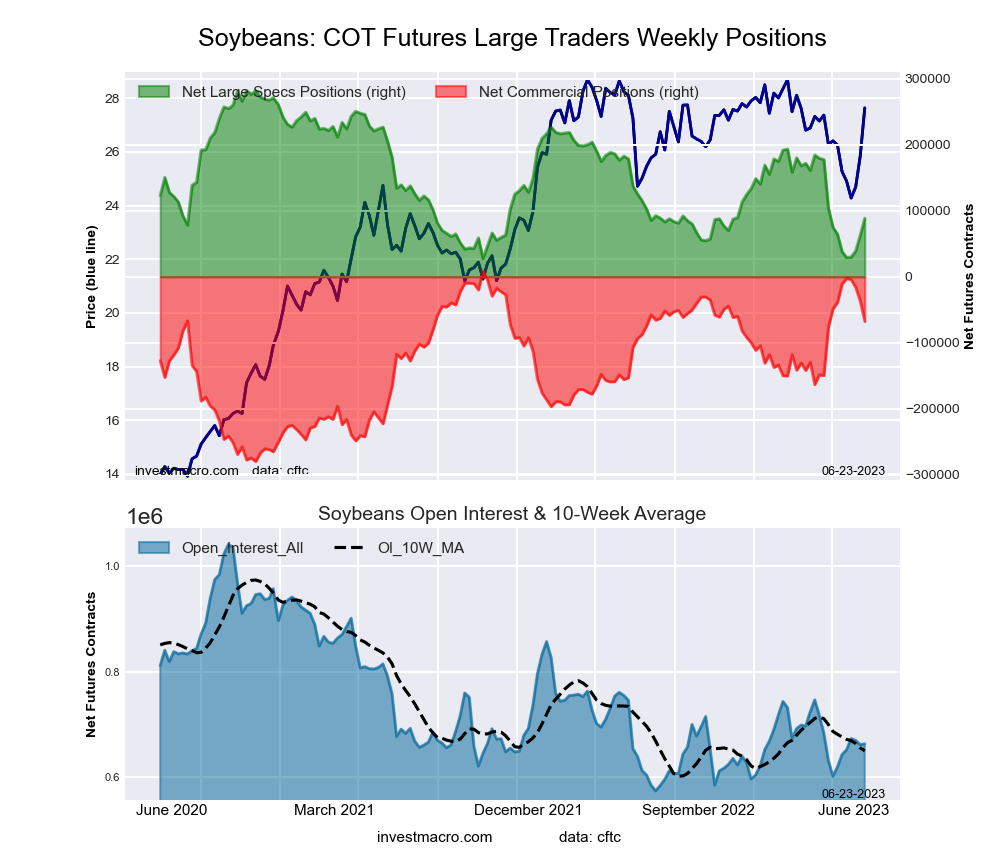 The SOYBEANS large speculator standing this week totaled a net position of 88,532 contracts in the data reported through Tuesday. This was a weekly gain of 25,583 contracts from the previous week which had a total of 62,949 net contracts.
This week’s current strength score (the trader positioning range over the past three years, measured from 0 to 100) shows the speculators are currently Bearish with a score of 23.9 percent. The commercials are Bullish with a score of 73.4 percent and the small traders (not shown in chart) are Bearish with a score of 46.7 percent.
Price Trend-Following Model: Weak Downtrend
Our weekly trend-following model classifies the current market price position as: Weak Downtrend. The current action for the model is considered to be: Hold – Maintain Short Position.
| SOYBEANS Futures Statistics | SPECULATORS | COMMERCIALS | SMALL TRADERS |
| – Percent of Open Interest Longs: | 24.4 | 53.3 | 6.9 |
| – Percent of Open Interest Shorts: | 11.1 | 63.5 | 10.0 |
| – Net Position: | 88,532 | -67,634 | -20,898 |
| – Gross Longs: | 161,793 | 353,062 | 45,676 |
| – Gross Shorts: | 73,261 | 420,696 | 66,574 |
| – Long to Short Ratio: | 2.2 to 1 | 0.8 to 1 | 0.7 to 1 |
| NET POSITION TREND: | |||
| – Strength Index Score (3 Year Range Pct): | 23.9 | 73.4 | 46.7 |
| – Strength Index Reading (3 Year Range): | Bearish | Bullish | Bearish |
| NET POSITION MOVEMENT INDEX: | |||
| – 6-Week Change in Strength Index: | 9.5 | -10.1 | 10.1 |
SOYBEAN OIL Futures:
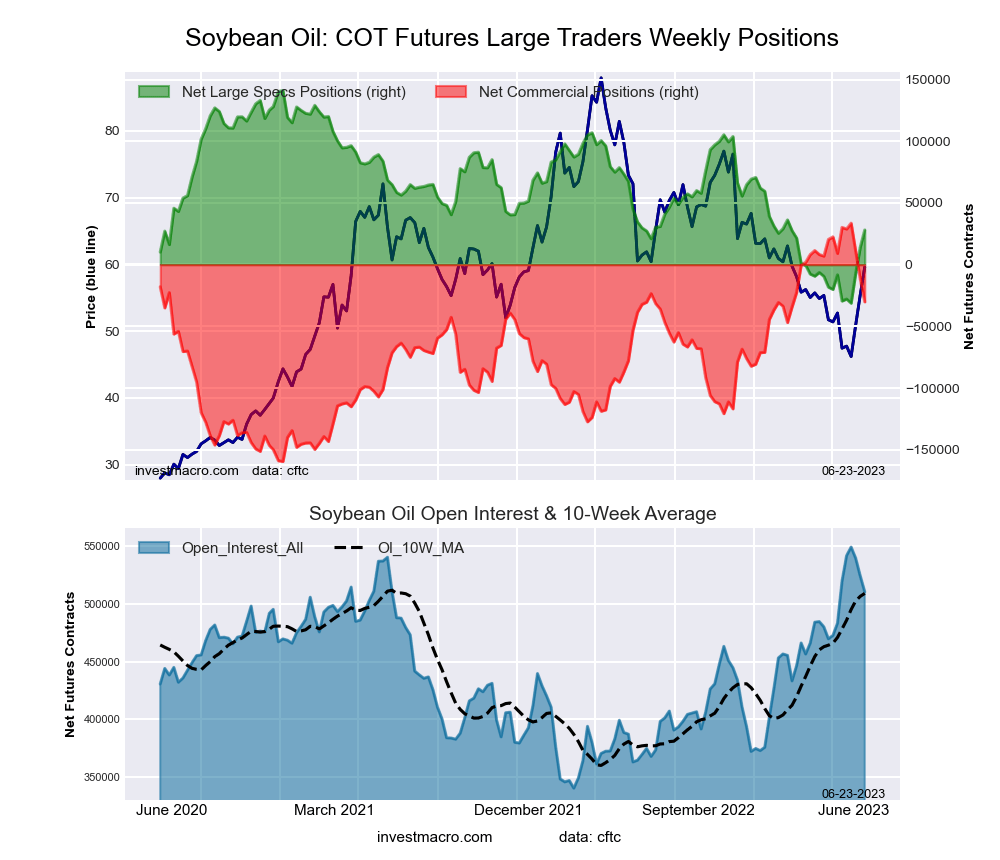 The SOYBEAN OIL large speculator standing this week totaled a net position of 28,127 contracts in the data reported through Tuesday. This was a weekly increase of 13,962 contracts from the previous week which had a total of 14,165 net contracts.
This week’s current strength score (the trader positioning range over the past three years, measured from 0 to 100) shows the speculators are currently Bearish with a score of 34.4 percent. The commercials are Bullish with a score of 67.0 percent and the small traders (not shown in chart) are Bearish with a score of 21.1 percent.
Price Trend-Following Model: Weak Downtrend
Our weekly trend-following model classifies the current market price position as: Weak Downtrend. The current action for the model is considered to be: Hold – Maintain Short Position.
| SOYBEAN OIL Futures Statistics | SPECULATORS | COMMERCIALS | SMALL TRADERS |
| – Percent of Open Interest Longs: | 15.0 | 59.2 | 5.7 |
| – Percent of Open Interest Shorts: | 9.5 | 65.1 | 5.3 |
| – Net Position: | 28,127 | -30,138 | 2,011 |
| – Gross Longs: | 76,705 | 301,792 | 29,161 |
| – Gross Shorts: | 48,578 | 331,930 | 27,150 |
| – Long to Short Ratio: | 1.6 to 1 | 0.9 to 1 | 1.1 to 1 |
| NET POSITION TREND: | |||
| – Strength Index Score (3 Year Range Pct): | 34.4 | 67.0 | 21.1 |
| – Strength Index Reading (3 Year Range): | Bearish | Bullish | Bearish |
| NET POSITION MOVEMENT INDEX: | |||
| – 6-Week Change in Strength Index: | 21.1 | -20.3 | 10.7 |
SOYBEAN MEAL Futures:
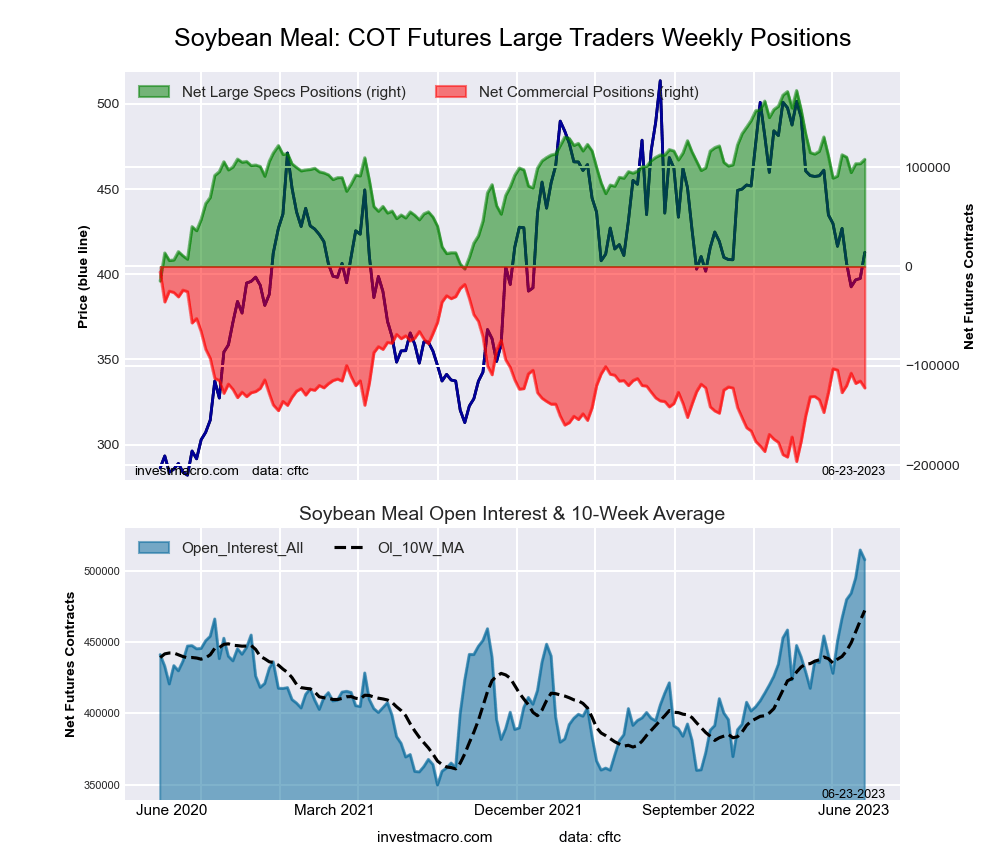 The SOYBEAN MEAL large speculator standing this week totaled a net position of 107,750 contracts in the data reported through Tuesday. This was a weekly increase of 4,314 contracts from the previous week which had a total of 103,436 net contracts.
This week’s current strength score (the trader positioning range over the past three years, measured from 0 to 100) shows the speculators are currently Bullish with a score of 63.9 percent. The commercials are Bearish with a score of 38.8 percent and the small traders (not shown in chart) are Bearish with a score of 20.4 percent.
Price Trend-Following Model: Downtrend
Our weekly trend-following model classifies the current market price position as: Downtrend. The current action for the model is considered to be: Hold – Maintain Short Position.
| SOYBEAN MEAL Futures Statistics | SPECULATORS | COMMERCIALS | SMALL TRADERS |
| – Percent of Open Interest Longs: | 25.7 | 38.6 | 9.2 |
| – Percent of Open Interest Shorts: | 4.5 | 62.7 | 6.3 |
| – Net Position: | 107,750 | -122,189 | 14,439 |
| – Gross Longs: | 130,518 | 195,986 | 46,491 |
| – Gross Shorts: | 22,768 | 318,175 | 32,052 |
| – Long to Short Ratio: | 5.7 to 1 | 0.6 to 1 | 1.5 to 1 |
| NET POSITION TREND: | |||
| – Strength Index Score (3 Year Range Pct): | 63.9 | 38.8 | 20.4 |
| – Strength Index Reading (3 Year Range): | Bullish | Bearish | Bearish |
| NET POSITION MOVEMENT INDEX: | |||
| – 6-Week Change in Strength Index: | 8.7 | -9.4 | 5.2 |
LIVE CATTLE Futures:
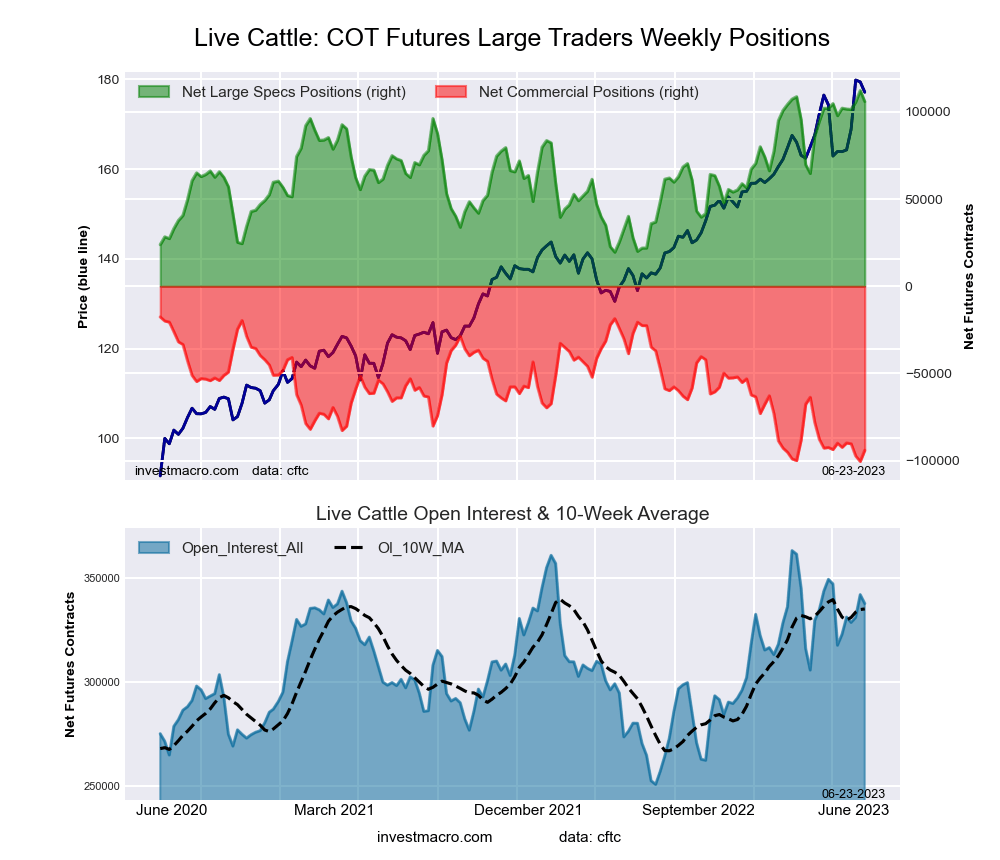 The LIVE CATTLE large speculator standing this week totaled a net position of 105,936 contracts in the data reported through Tuesday. This was a weekly reduction of -6,313 contracts from the previous week which had a total of 112,249 net contracts.
This week’s current strength score (the trader positioning range over the past three years, measured from 0 to 100) shows the speculators are currently Bullish-Extreme with a score of 93.2 percent. The commercials are Bearish-Extreme with a score of 7.7 percent and the small traders (not shown in chart) are Bearish with a score of 23.3 percent.
Price Trend-Following Model: Uptrend
Our weekly trend-following model classifies the current market price position as: Uptrend. The current action for the model is considered to be: Hold – Maintain Long Position.
| LIVE CATTLE Futures Statistics | SPECULATORS | COMMERCIALS | SMALL TRADERS |
| – Percent of Open Interest Longs: | 46.1 | 27.5 | 8.6 |
| – Percent of Open Interest Shorts: | 14.7 | 55.3 | 12.1 |
| – Net Position: | 105,936 | -94,062 | -11,874 |
| – Gross Longs: | 155,744 | 92,892 | 29,165 |
| – Gross Shorts: | 49,808 | 186,954 | 41,039 |
| – Long to Short Ratio: | 3.1 to 1 | 0.5 to 1 | 0.7 to 1 |
| NET POSITION TREND: | |||
| – Strength Index Score (3 Year Range Pct): | 93.2 | 7.7 | 23.3 |
| – Strength Index Reading (3 Year Range): | Bullish-Extreme | Bearish-Extreme | Bearish |
| NET POSITION MOVEMENT INDEX: | |||
| – 6-Week Change in Strength Index: | 8.7 | -4.9 | -22.3 |
LEAN HOGS Futures:
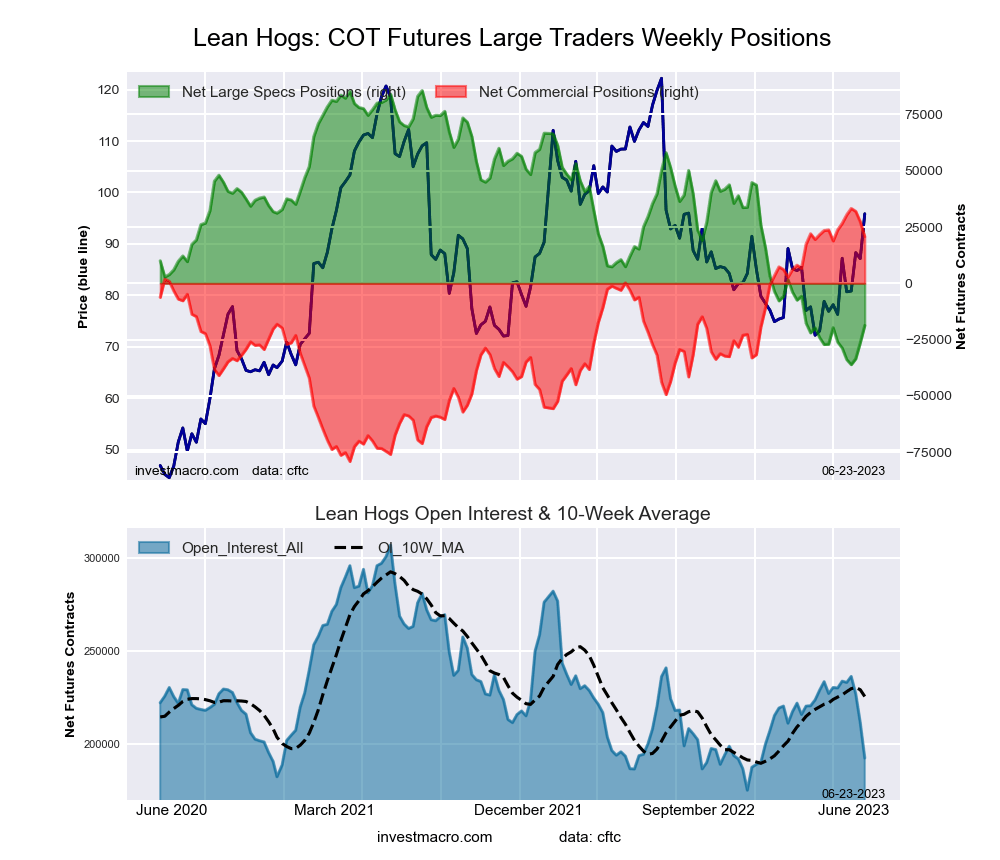 The LEAN HOGS large speculator standing this week totaled a net position of -18,727 contracts in the data reported through Tuesday. This was a weekly gain of 7,704 contracts from the previous week which had a total of -26,431 net contracts.
This week’s current strength score (the trader positioning range over the past three years, measured from 0 to 100) shows the speculators are currently Bearish-Extreme with a score of 14.3 percent. The commercials are Bullish-Extreme with a score of 88.9 percent and the small traders (not shown in chart) are Bullish with a score of 74.2 percent.
Price Trend-Following Model: Strong Uptrend
Our weekly trend-following model classifies the current market price position as: Strong Uptrend. The current action for the model is considered to be: Hold – Maintain Long Position.
| LEAN HOGS Futures Statistics | SPECULATORS | COMMERCIALS | SMALL TRADERS |
| – Percent of Open Interest Longs: | 29.4 | 40.3 | 9.1 |
| – Percent of Open Interest Shorts: | 39.1 | 29.5 | 10.2 |
| – Net Position: | -18,727 | 20,759 | -2,032 |
| – Gross Longs: | 56,562 | 77,522 | 17,534 |
| – Gross Shorts: | 75,289 | 56,763 | 19,566 |
| – Long to Short Ratio: | 0.8 to 1 | 1.4 to 1 | 0.9 to 1 |
| NET POSITION TREND: | |||
| – Strength Index Score (3 Year Range Pct): | 14.3 | 88.9 | 74.2 |
| – Strength Index Reading (3 Year Range): | Bearish-Extreme | Bullish-Extreme | Bullish |
| NET POSITION MOVEMENT INDEX: | |||
| – 6-Week Change in Strength Index: | 6.0 | -2.7 | -19.6 |
COTTON Futures:
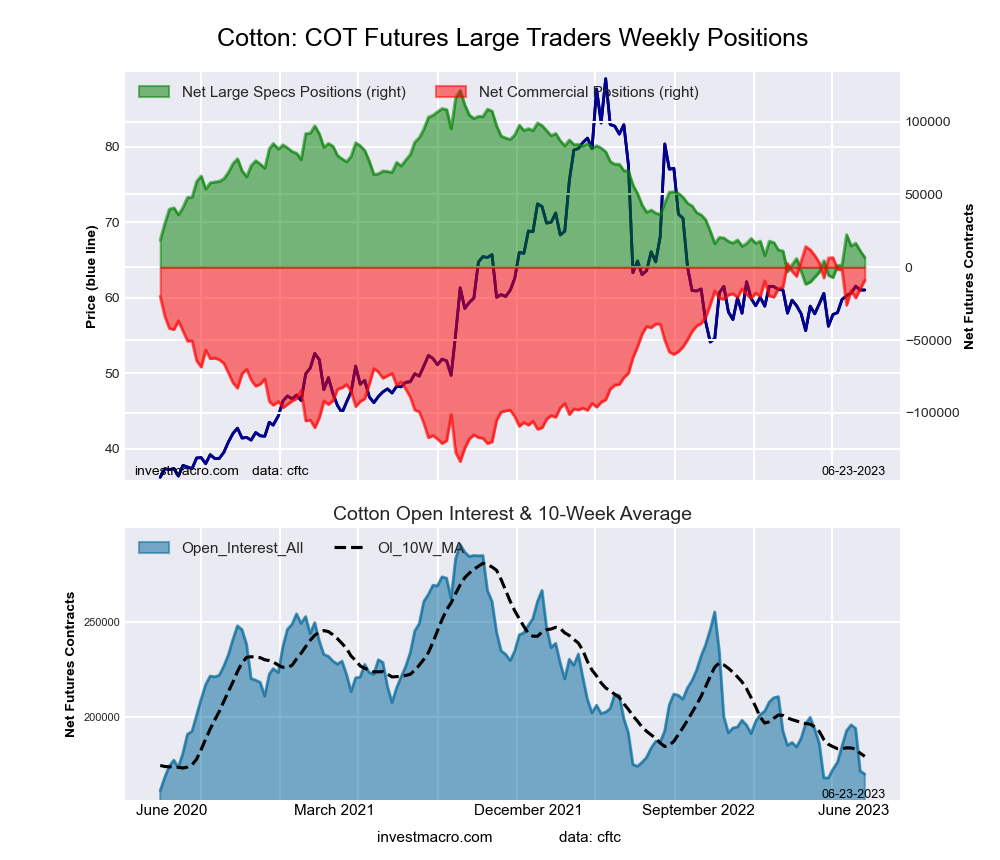 The COTTON large speculator standing this week totaled a net position of 6,658 contracts in the data reported through Tuesday. This was a weekly reduction of -4,552 contracts from the previous week which had a total of 11,210 net contracts.
This week’s current strength score (the trader positioning range over the past three years, measured from 0 to 100) shows the speculators are currently Bearish-Extreme with a score of 13.7 percent. The commercials are Bullish-Extreme with a score of 84.3 percent and the small traders (not shown in chart) are Bearish with a score of 29.4 percent.
Price Trend-Following Model: Uptrend
Our weekly trend-following model classifies the current market price position as: Uptrend. The current action for the model is considered to be: Hold – Maintain Long Position.
| COTTON Futures Statistics | SPECULATORS | COMMERCIALS | SMALL TRADERS |
| – Percent of Open Interest Longs: | 30.8 | 51.0 | 7.8 |
| – Percent of Open Interest Shorts: | 26.9 | 56.2 | 6.5 |
| – Net Position: | 6,658 | -8,868 | 2,210 |
| – Gross Longs: | 52,445 | 86,869 | 13,339 |
| – Gross Shorts: | 45,787 | 95,737 | 11,129 |
| – Long to Short Ratio: | 1.1 to 1 | 0.9 to 1 | 1.2 to 1 |
| NET POSITION TREND: | |||
| – Strength Index Score (3 Year Range Pct): | 13.7 | 84.3 | 29.4 |
| – Strength Index Reading (3 Year Range): | Bearish-Extreme | Bullish-Extreme | Bearish |
| NET POSITION MOVEMENT INDEX: | |||
| – 6-Week Change in Strength Index: | 4.1 | -5.1 | 12.4 |
COCOA Futures:
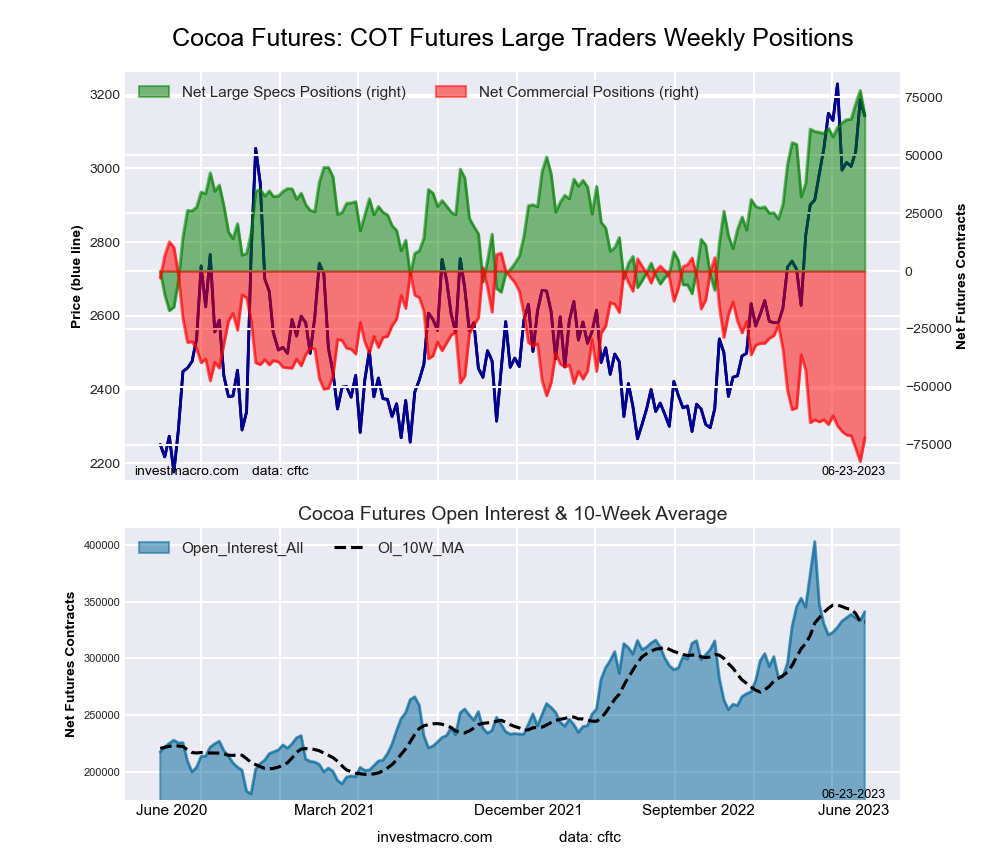 The COCOA large speculator standing this week totaled a net position of 67,342 contracts in the data reported through Tuesday. This was a weekly lowering of -10,597 contracts from the previous week which had a total of 77,939 net contracts.
This week’s current strength score (the trader positioning range over the past three years, measured from 0 to 100) shows the speculators are currently Bullish-Extreme with a score of 88.8 percent. The commercials are Bearish-Extreme with a score of 10.8 percent and the small traders (not shown in chart) are Bearish with a score of 42.8 percent.
Price Trend-Following Model: Uptrend
Our weekly trend-following model classifies the current market price position as: Uptrend. The current action for the model is considered to be: Hold – Maintain Long Position.
| COCOA Futures Statistics | SPECULATORS | COMMERCIALS | SMALL TRADERS |
| – Percent of Open Interest Longs: | 44.7 | 27.9 | 4.3 |
| – Percent of Open Interest Shorts: | 24.9 | 49.0 | 3.0 |
| – Net Position: | 67,342 | -71,968 | 4,626 |
| – Gross Longs: | 152,239 | 95,151 | 14,724 |
| – Gross Shorts: | 84,897 | 167,119 | 10,098 |
| – Long to Short Ratio: | 1.8 to 1 | 0.6 to 1 | 1.5 to 1 |
| NET POSITION TREND: | |||
| – Strength Index Score (3 Year Range Pct): | 88.8 | 10.8 | 42.8 |
| – Strength Index Reading (3 Year Range): | Bullish-Extreme | Bearish-Extreme | Bearish |
| NET POSITION MOVEMENT INDEX: | |||
| – 6-Week Change in Strength Index: | 5.6 | -5.4 | -1.5 |
WHEAT Futures:
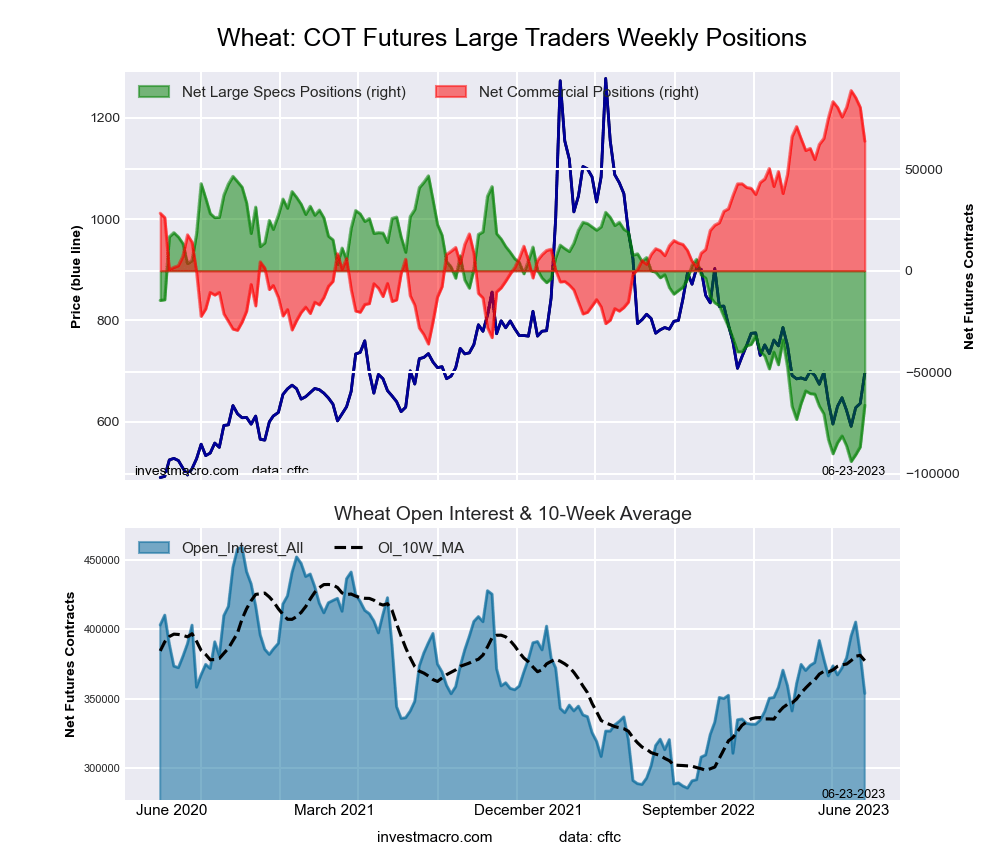 The WHEAT large speculator standing this week totaled a net position of -66,364 contracts in the data reported through Tuesday. This was a weekly lift of 20,463 contracts from the previous week which had a total of -86,827 net contracts.
This week’s current strength score (the trader positioning range over the past three years, measured from 0 to 100) shows the speculators are currently Bearish-Extreme with a score of 19.6 percent. The commercials are Bullish-Extreme with a score of 80.0 percent and the small traders (not shown in chart) are Bullish-Extreme with a score of 81.7 percent.
Price Trend-Following Model: Weak Downtrend
Our weekly trend-following model classifies the current market price position as: Weak Downtrend. The current action for the model is considered to be: Hold – Maintain Short Position.
| WHEAT Futures Statistics | SPECULATORS | COMMERCIALS | SMALL TRADERS |
| – Percent of Open Interest Longs: | 27.7 | 38.6 | 10.0 |
| – Percent of Open Interest Shorts: | 46.5 | 20.5 | 9.3 |
| – Net Position: | -66,364 | 63,862 | 2,502 |
| – Gross Longs: | 98,146 | 136,416 | 35,384 |
| – Gross Shorts: | 164,510 | 72,554 | 32,882 |
| – Long to Short Ratio: | 0.6 to 1 | 1.9 to 1 | 1.1 to 1 |
| NET POSITION TREND: | |||
| – Strength Index Score (3 Year Range Pct): | 19.6 | 80.0 | 81.7 |
| – Strength Index Reading (3 Year Range): | Bearish-Extreme | Bullish-Extreme | Bullish-Extreme |
| NET POSITION MOVEMENT INDEX: | |||
| – 6-Week Change in Strength Index: | 13.1 | -13.4 | -5.7 |
Article By InvestMacro – Receive our weekly COT Newsletter
*COT Report: The COT data, released weekly to the public each Friday, is updated through the most recent Tuesday (data is 3 days old) and shows a quick view of how large speculators or non-commercials (for-profit traders) were positioned in the futures markets.
The CFTC categorizes trader positions according to commercial hedgers (traders who use futures contracts for hedging as part of the business), non-commercials (large traders who speculate to realize trading profits) and nonreportable traders (usually small traders/speculators) as well as their open interest (contracts open in the market at time of reporting). See CFTC criteria here.

- Geopolitical and macroeconomic conditions continue to pressure market sentiment Jul 20, 2026
- USD/JPY Poised to Continue Gains as Expensive Oil and Lack of Support Weigh on Yen Jul 20, 2026
- COT Metals Charts: Weekly Speculator Bets led by Copper & Steel Jul 18, 2026
- COT Bonds Charts: Weekly Speculator Bets led by 2-Year, SOFR 3M & 5-Year Bonds Jul 18, 2026
- COT Energy Charts: Weekly Speculator Bets led by Brent Oil & Heating Oil Jul 18, 2026
- COT Soft Commodities Charts: Weekly Speculator Bets led by Wheat, Corn & Soybean Meal Jul 18, 2026
- The Bank of Canada kept its interest rate unchanged. Platinum prices reached a three‑week high Jul 16, 2026
- Stock indices rose after the release of US inflation data. China’s GDP slowed sharply Jul 15, 2026
- GBP/USD Awaits Political News: What Will Happen Next Jul 15, 2026
- USD/JPY Holds at Highs: Pressure Lingers on Yen Jul 14, 2026