
By InvestMacro
Here are the latest charts and statistics for the Commitment of Traders (COT) reports data published by the Commodities Futures Trading Commission (CFTC).
The latest COT data is updated through Tuesday September 26th and shows a quick view of how large traders (for-profit speculators and commercial hedgers) were positioned in the futures markets.
Weekly Speculator Changes led by 2-Year Bonds & Ultra Treasury Bonds
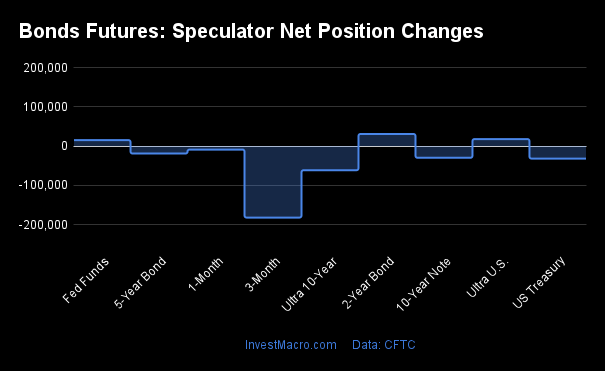
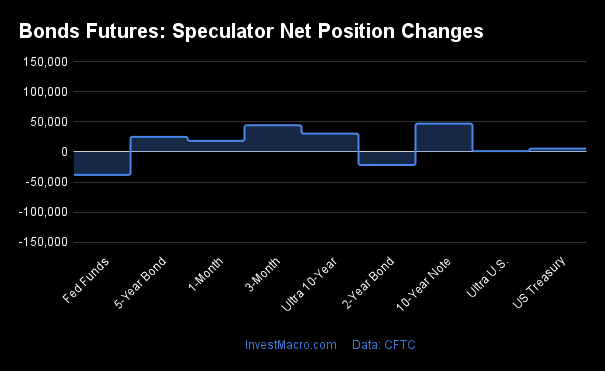
The COT bond market speculator bets were lower this week as three out of the eight bond markets we cover had higher positioning while the other five markets had lower speculator contracts.
Leading the gains for the bond markets was the 2-Year Bonds (31,163 contracts) with the Ultra Treasury Bonds (18,129 contracts) and the Fed Funds (15,454 contracts) also showing positive weeks.
The bond markets with declines in speculator bets for the week was the SOFR 3-Months (-182,231 contracts) with the Ultra 10-Year Bonds (-61,389 contracts), the US Treasury Bonds (-31,704 contracts), the 10-Year Bonds (-29,682 contracts), and the 5-Year Bonds (-18,836 contracts) also registering lower bets on the week.
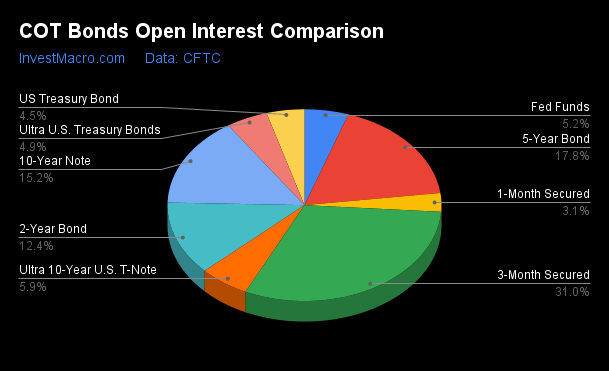
| Sep-26-2023 | OI | OI-Index | Spec-Net | Spec-Index | Com-Net | COM-Index | Smalls-Net | Smalls-Index |
|---|---|---|---|---|---|---|---|---|
| SOFR-3-Months | 9,718,980 | 91 | 317,146 | 89 | -311,986 | 11 | -5,160 | 85 |
| FedFunds | 1,630,236 | 57 | -195,078 | 23 | 217,052 | 79 | -21,974 | 48 |
| 2-Year | 3,903,502 | 96 | -1,210,300 | 4 | 1,080,594 | 95 | 129,706 | 100 |
| Long T-Bond | 1,405,064 | 92 | -232,811 | 9 | 169,018 | 71 | 63,793 | 95 |
| 10-Year | 4,767,698 | 92 | -731,998 | 11 | 679,643 | 90 | 52,355 | 85 |
| 5-Year | 5,579,726 | 91 | -1,025,782 | 17 | 964,605 | 80 | 61,177 | 86 |
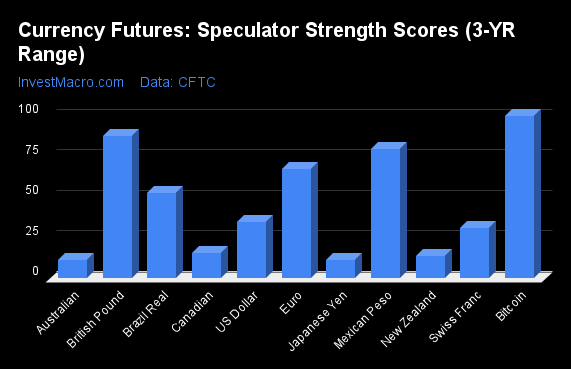
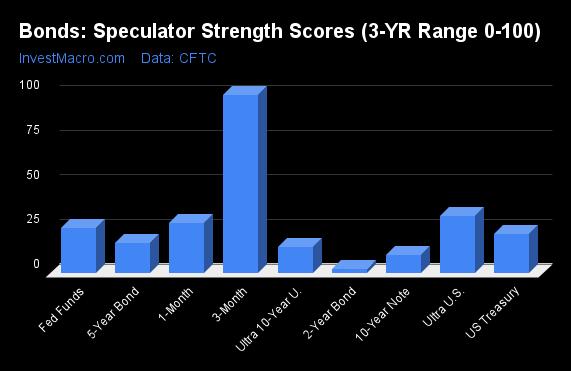
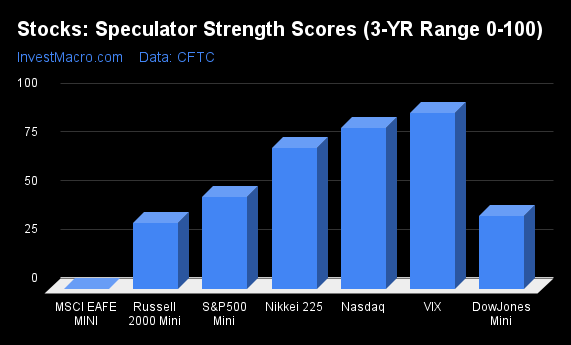
Strength Scores led by SOFR 3-Months & Ultra Treasury Bonds
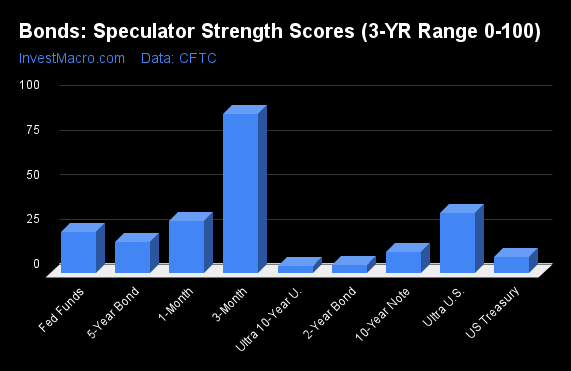
COT Strength Scores (a normalized measure of Speculator positions over a 3-Year range, from 0 to 100 where above 80 is Extreme-Bullish and below 20 is Extreme-Bearish) showed that the SOFR 3-Months (89 percent) leads the bond markets this week. The Ultra Treasury Bonds (34 percent) come in as the next highest in the weekly strength scores.
On the downside, the Ultra 10-Year Bonds (4 percent), the 2-Year Bonds (4 percent), the US Treasury Bonds (9 percent), the 10-Year Bonds (11 percent) and the 5-Year Bond (17 percent) come in at the lowest strength level currently and are in Extreme-Bearish territory (below 20 percent).
Strength Statistics:
Fed Funds (23.1 percent) vs Fed Funds previous week (20.2 percent)
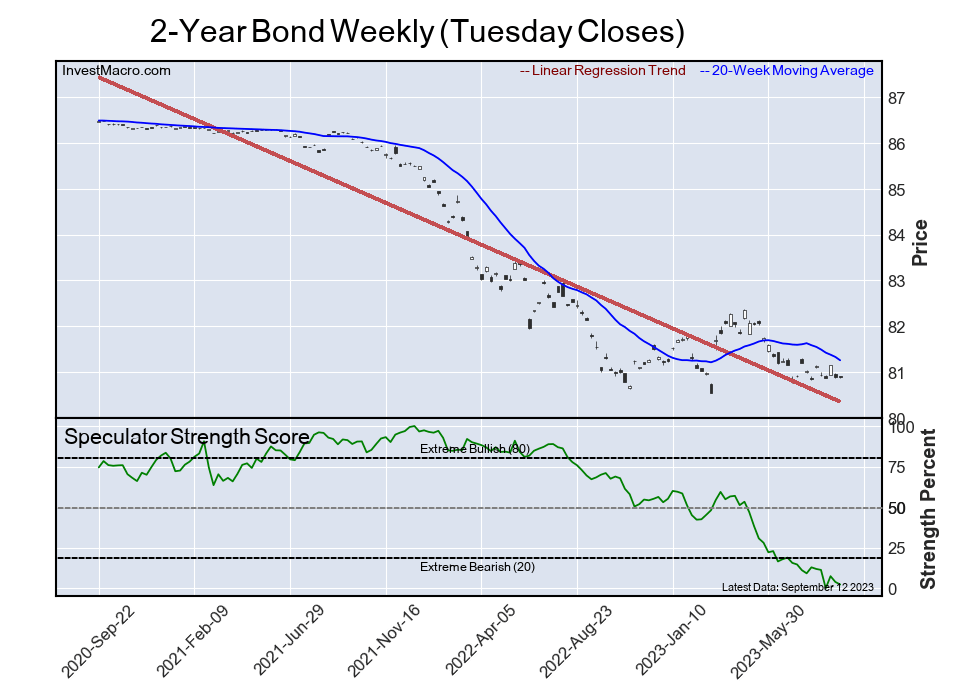
2-Year Bond (4.5 percent) vs 2-Year Bond previous week (2.2 percent)
5-Year Bond (17.1 percent) vs 5-Year Bond previous week (18.5 percent)
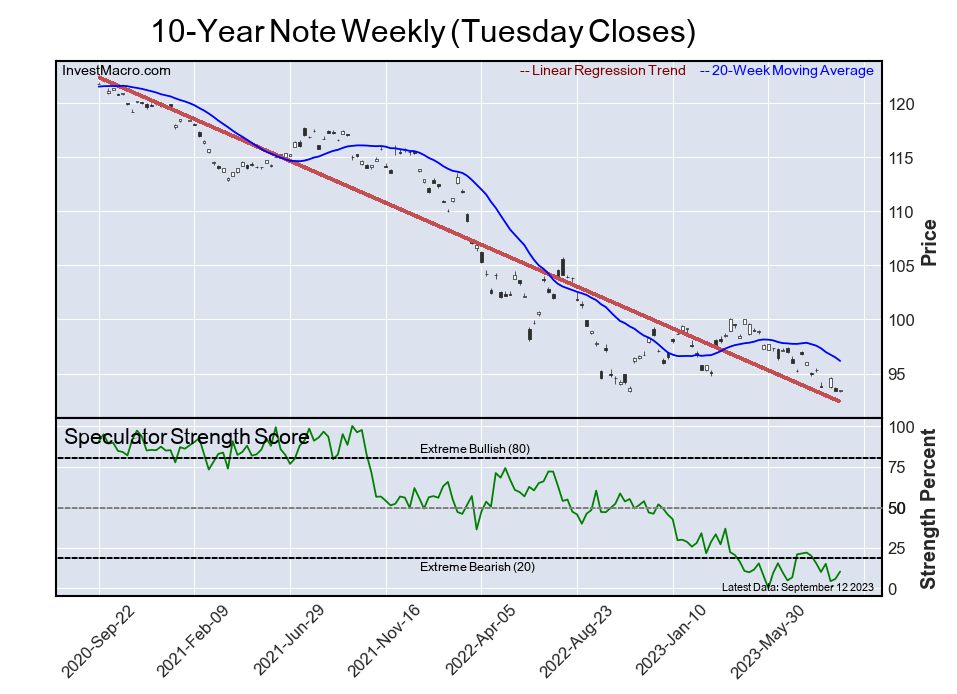
10-Year Bond (11.5 percent) vs 10-Year Bond previous week (14.4 percent)
Ultra 10-Year Bond (4.1 percent) vs Ultra 10-Year Bond previous week (16.6 percent)
US Treasury Bond (8.8 percent) vs US Treasury Bond previous week (19.1 percent)
Ultra US Treasury Bond (33.5 percent) vs Ultra US Treasury Bond previous week (26.2 percent)
SOFR 3-Months (89.1 percent) vs SOFR 3-Months previous week (100.0 percent)
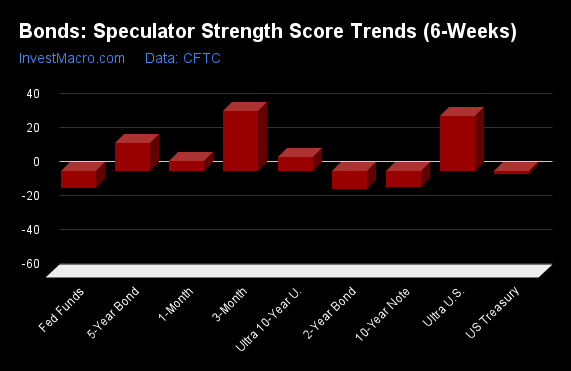
Ultra Treasury Bonds & SOFR 3-Months top the 6-Week Strength Trends
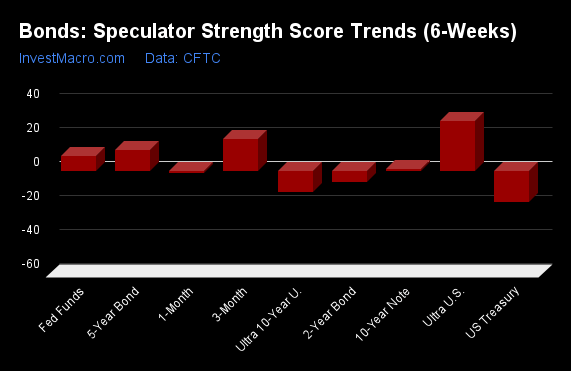
COT Strength Score Trends (or move index, calculates the 6-week changes in strength scores) showed that the Ultra Treasury Bonds (29 percent) and the SOFR 3-Months (19 percent) lead the past six weeks trends for bonds. The 5-Year Bonds (12 percent) and the the next highest positive movers in the latest trends data.
The US Treasury Bonds (-18 percent), the Ultra 10-Year Bonds (-12 percent) and the 2-Year Bonds (-7 percent) lead the downside trend scores currently.
Strength Trend Statistics:
Fed Funds (9.0 percent) vs Fed Funds previous week (-3.2 percent)
2-Year Bond (-6.8 percent) vs 2-Year Bond previous week (-9.7 percent)
5-Year Bond (12.2 percent) vs 5-Year Bond previous week (16.5 percent)
10-Year Bond (1.4 percent) vs 10-Year Bond previous week (-1.0 percent)
Ultra 10-Year Bond (-12.3 percent) vs Ultra 10-Year Bond previous week (2.7 percent)
US Treasury Bond (-18.2 percent) vs US Treasury Bond previous week (-0.5 percent)
Ultra US Treasury Bond (29.1 percent) vs Ultra US Treasury Bond previous week (21.6 percent)
SOFR 3-Months (18.8 percent) vs SOFR 3-Months previous week (33.2 percent)
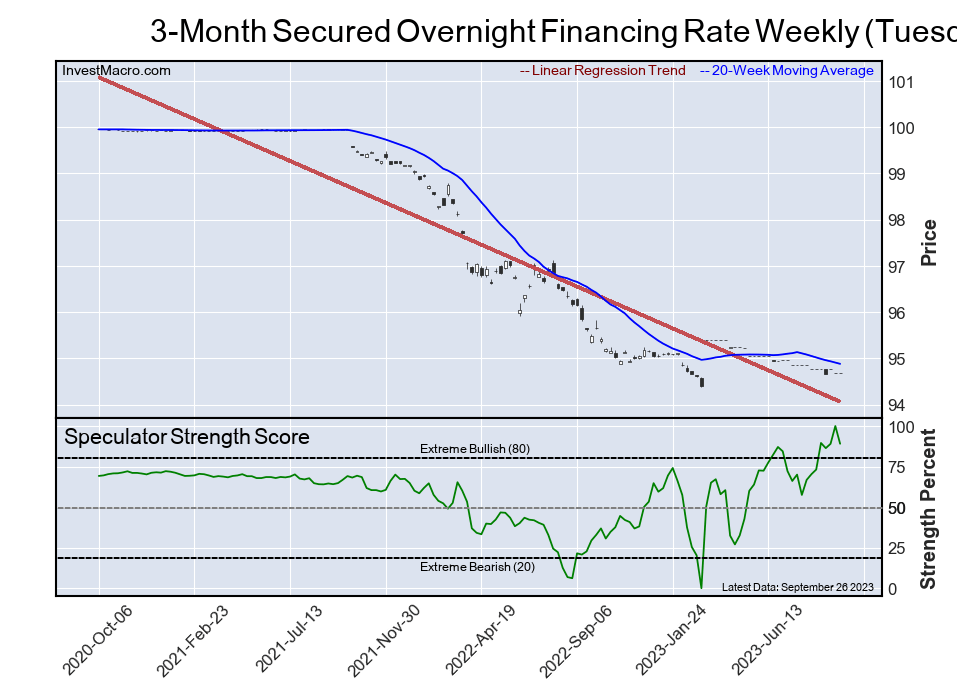
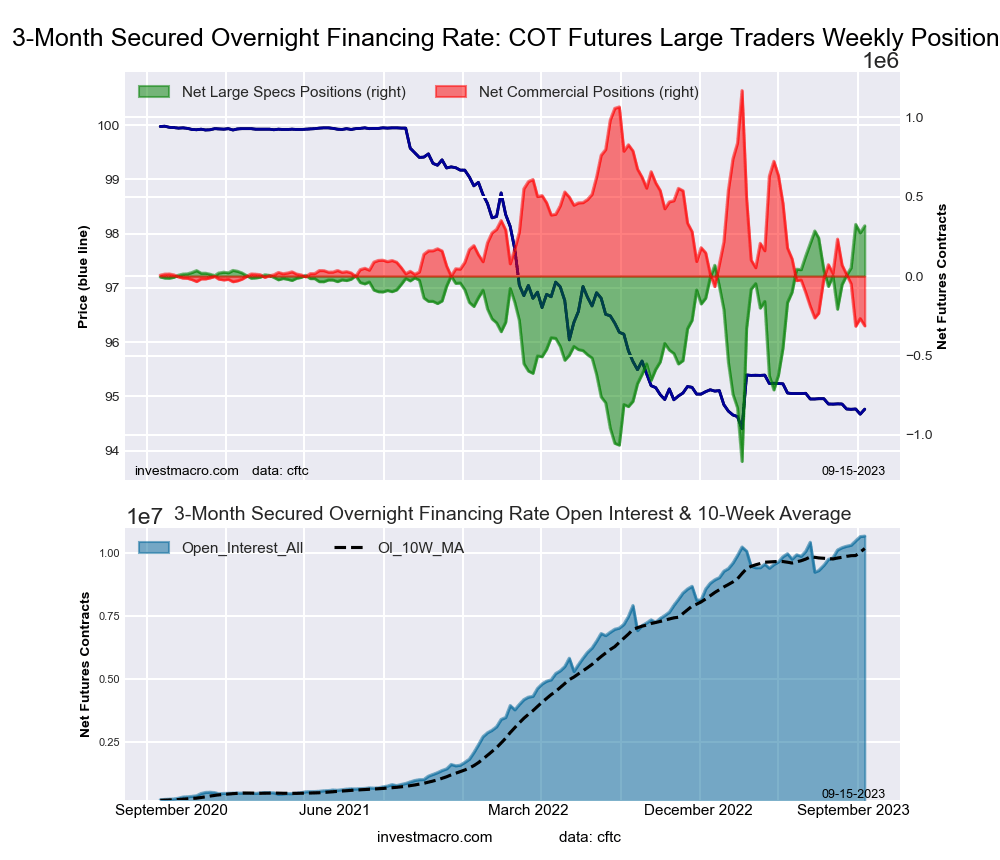
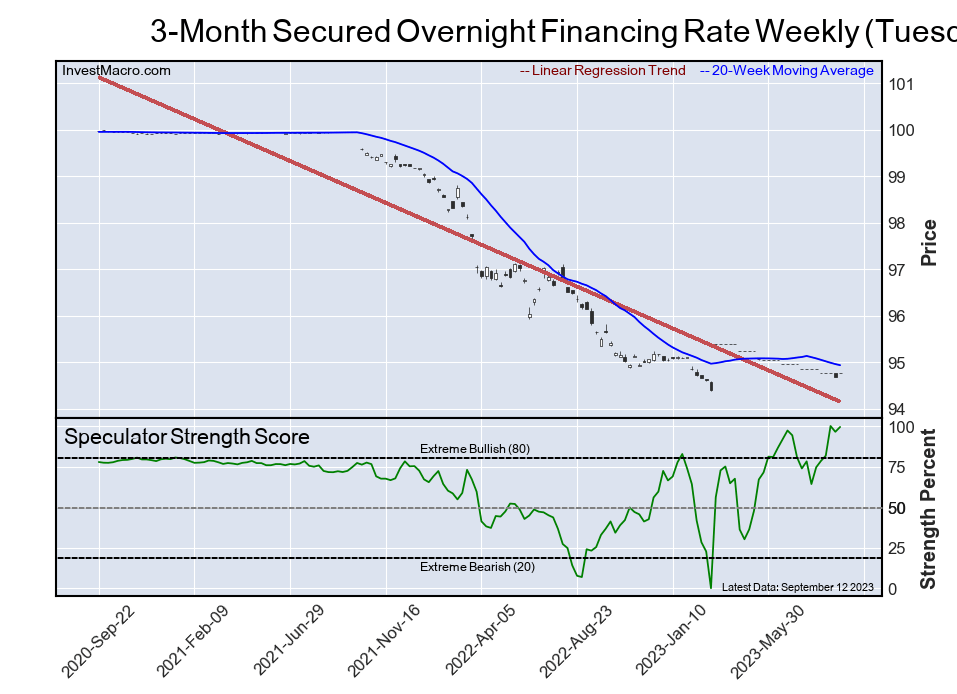
Secured Overnight Financing Rate (3-Month) Futures:
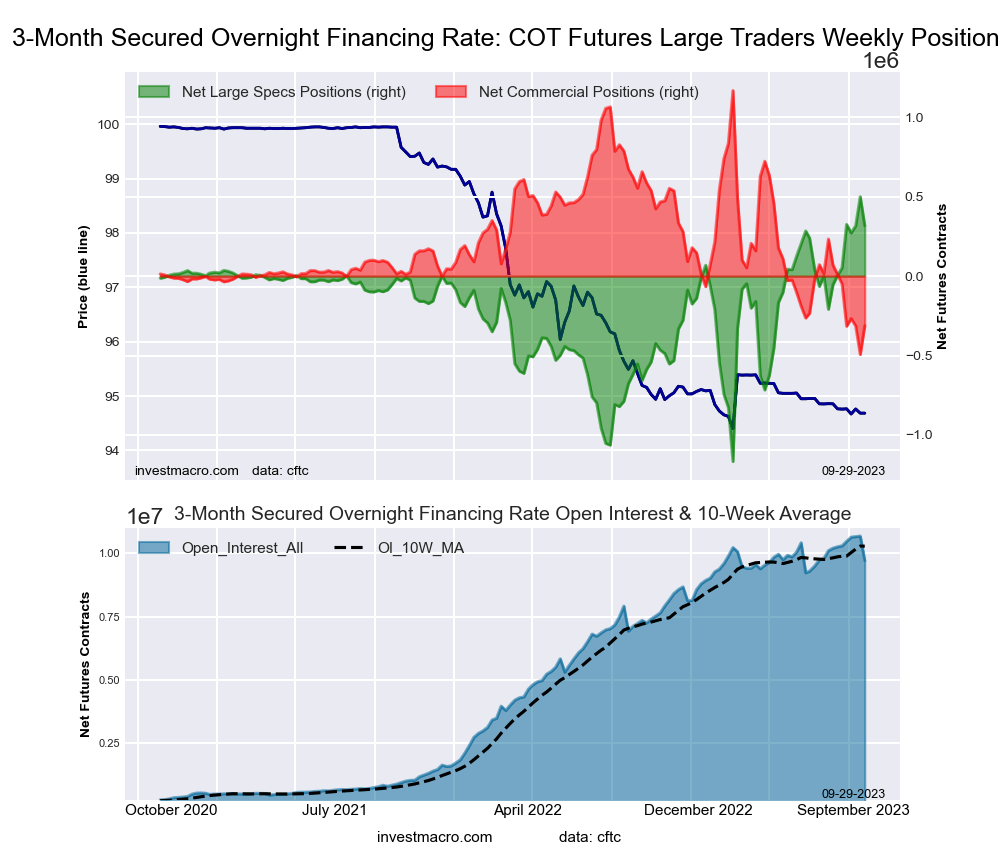 The Secured Overnight Financing Rate (3-Month) large speculator standing this week resulted in a net position of 317,146 contracts in the data reported through Tuesday. This was a weekly fall of -182,231 contracts from the previous week which had a total of 499,377 net contracts.
This week’s current strength score (the trader positioning range over the past three years, measured from 0 to 100) shows the speculators are currently Bullish-Extreme with a score of 89.1 percent. The commercials are Bearish-Extreme with a score of 10.9 percent and the small traders (not shown in chart) are Bullish-Extreme with a score of 85.0 percent.
Price Trend-Following Model: Weak Uptrend
Our weekly trend-following model classifies the current market price position as: Weak Uptrend. The current action for the model is considered to be: Hold – Maintain Long Position.
| SOFR 3-Months Statistics | SPECULATORS | COMMERCIALS | SMALL TRADERS |
| – Percent of Open Interest Longs: | 20.1 | 55.5 | 0.3 |
| – Percent of Open Interest Shorts: | 16.8 | 58.8 | 0.4 |
| – Net Position: | 317,146 | -311,986 | -5,160 |
| – Gross Longs: | 1,953,987 | 5,398,262 | 29,392 |
| – Gross Shorts: | 1,636,841 | 5,710,248 | 34,552 |
| – Long to Short Ratio: | 1.2 to 1 | 0.9 to 1 | 0.9 to 1 |
| NET POSITION TREND: | |||
| – Strength Index Score (3 Year Range Pct): | 89.1 | 10.9 | 85.0 |
| – Strength Index Reading (3 Year Range): | Bullish-Extreme | Bearish-Extreme | Bullish-Extreme |
| NET POSITION MOVEMENT INDEX: | |||
| – 6-Week Change in Strength Index: | 18.8 | -19.4 | 5.6 |
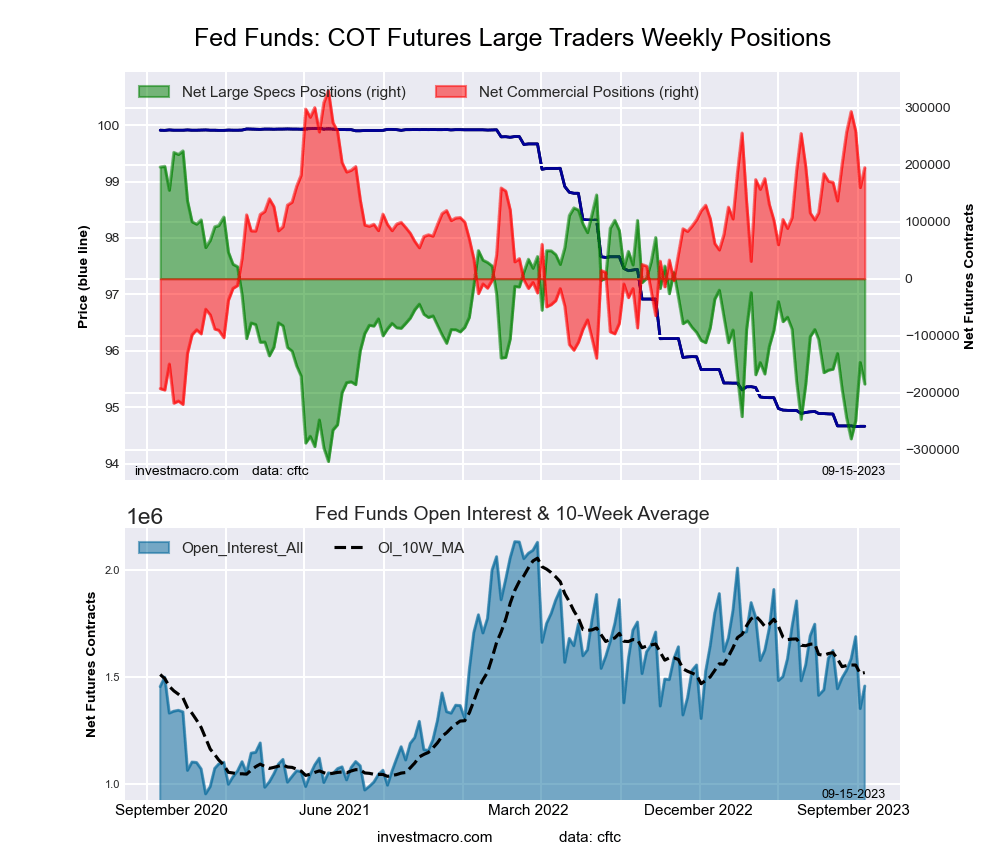
30-Day Federal Funds Futures:
 The 30-Day Federal Funds large speculator standing this week resulted in a net position of -195,078 contracts in the data reported through Tuesday. This was a weekly rise of 15,454 contracts from the previous week which had a total of -210,532 net contracts.
This week’s current strength score (the trader positioning range over the past three years, measured from 0 to 100) shows the speculators are currently Bearish with a score of 23.1 percent. The commercials are Bullish with a score of 79.4 percent and the small traders (not shown in chart) are Bearish with a score of 47.9 percent.
Price Trend-Following Model: Downtrend
Our weekly trend-following model classifies the current market price position as: Downtrend. The current action for the model is considered to be: Hold – Maintain Short Position.
| 30-Day Federal Funds Statistics | SPECULATORS | COMMERCIALS | SMALL TRADERS |
| – Percent of Open Interest Longs: | 7.1 | 75.8 | 1.9 |
| – Percent of Open Interest Shorts: | 19.1 | 62.5 | 3.2 |
| – Net Position: | -195,078 | 217,052 | -21,974 |
| – Gross Longs: | 116,359 | 1,236,201 | 30,537 |
| – Gross Shorts: | 311,437 | 1,019,149 | 52,511 |
| – Long to Short Ratio: | 0.4 to 1 | 1.2 to 1 | 0.6 to 1 |
| NET POSITION TREND: | |||
| – Strength Index Score (3 Year Range Pct): | 23.1 | 79.4 | 47.9 |
| – Strength Index Reading (3 Year Range): | Bearish | Bullish | Bearish |
| NET POSITION MOVEMENT INDEX: | |||
| – 6-Week Change in Strength Index: | 9.0 | -7.3 | -17.3 |
2-Year Treasury Note Futures:
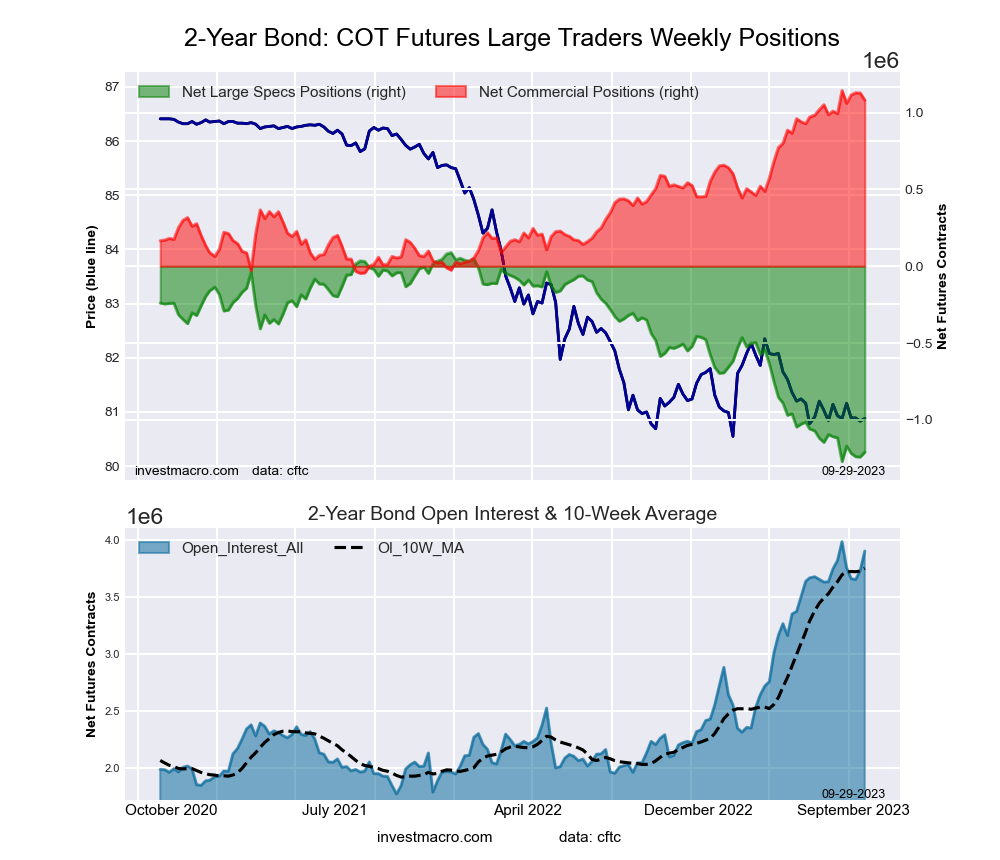 The 2-Year Treasury Note large speculator standing this week resulted in a net position of -1,210,300 contracts in the data reported through Tuesday. This was a weekly advance of 31,163 contracts from the previous week which had a total of -1,241,463 net contracts.
This week’s current strength score (the trader positioning range over the past three years, measured from 0 to 100) shows the speculators are currently Bearish-Extreme with a score of 4.5 percent. The commercials are Bullish-Extreme with a score of 94.7 percent and the small traders (not shown in chart) are Bullish-Extreme with a score of 100.0 percent.
Price Trend-Following Model: Downtrend
Our weekly trend-following model classifies the current market price position as: Downtrend. The current action for the model is considered to be: Hold – Maintain Short Position.
| 2-Year Treasury Note Statistics | SPECULATORS | COMMERCIALS | SMALL TRADERS |
| – Percent of Open Interest Longs: | 11.0 | 80.1 | 6.9 |
| – Percent of Open Interest Shorts: | 42.0 | 52.4 | 3.6 |
| – Net Position: | -1,210,300 | 1,080,594 | 129,706 |
| – Gross Longs: | 429,541 | 3,127,095 | 269,088 |
| – Gross Shorts: | 1,639,841 | 2,046,501 | 139,382 |
| – Long to Short Ratio: | 0.3 to 1 | 1.5 to 1 | 1.9 to 1 |
| NET POSITION TREND: | |||
| – Strength Index Score (3 Year Range Pct): | 4.5 | 94.7 | 100.0 |
| – Strength Index Reading (3 Year Range): | Bearish-Extreme | Bullish-Extreme | Bullish-Extreme |
| NET POSITION MOVEMENT INDEX: | |||
| – 6-Week Change in Strength Index: | -6.8 | 7.5 | 1.7 |
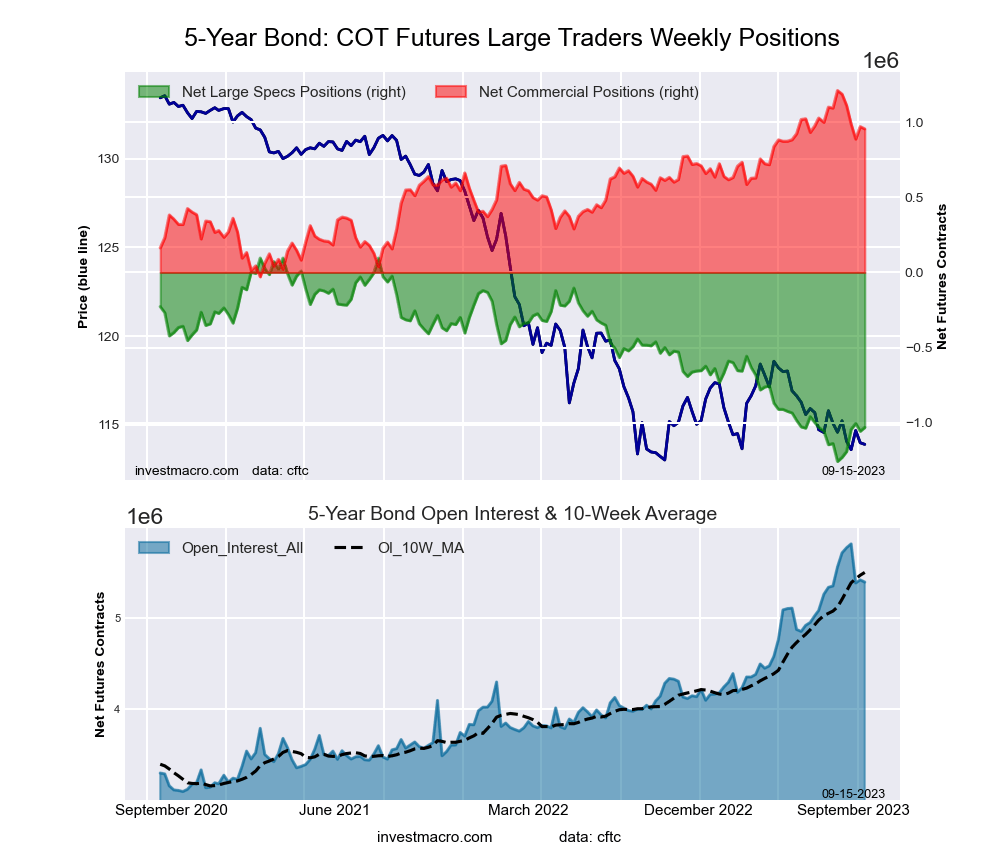
5-Year Treasury Note Futures:
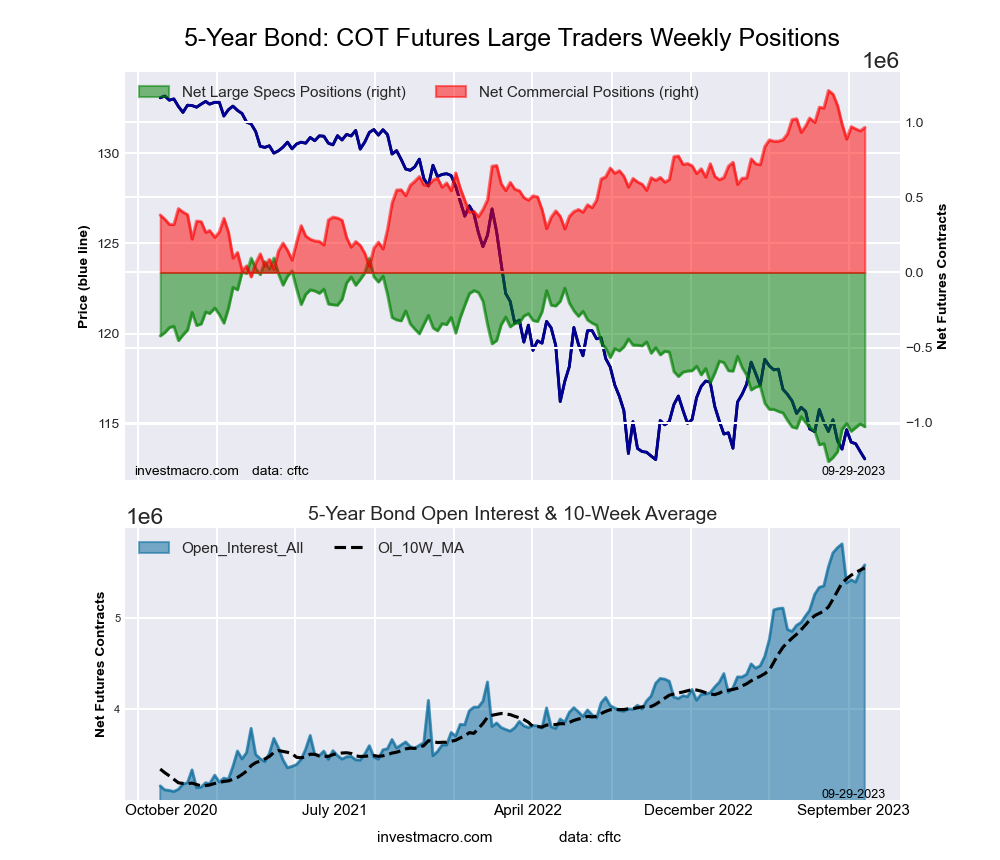 The 5-Year Treasury Note large speculator standing this week resulted in a net position of -1,025,782 contracts in the data reported through Tuesday. This was a weekly fall of -18,836 contracts from the previous week which had a total of -1,006,946 net contracts.
This week’s current strength score (the trader positioning range over the past three years, measured from 0 to 100) shows the speculators are currently Bearish-Extreme with a score of 17.1 percent. The commercials are Bullish-Extreme with a score of 80.2 percent and the small traders (not shown in chart) are Bullish-Extreme with a score of 86.3 percent.
Price Trend-Following Model: Strong Downtrend
Our weekly trend-following model classifies the current market price position as: Strong Downtrend. The current action for the model is considered to be: Hold – Maintain Short Position.
| 5-Year Treasury Note Statistics | SPECULATORS | COMMERCIALS | SMALL TRADERS |
| – Percent of Open Interest Longs: | 8.8 | 82.6 | 7.2 |
| – Percent of Open Interest Shorts: | 27.2 | 65.3 | 6.1 |
| – Net Position: | -1,025,782 | 964,605 | 61,177 |
| – Gross Longs: | 492,741 | 4,610,560 | 404,260 |
| – Gross Shorts: | 1,518,523 | 3,645,955 | 343,083 |
| – Long to Short Ratio: | 0.3 to 1 | 1.3 to 1 | 1.2 to 1 |
| NET POSITION TREND: | |||
| – Strength Index Score (3 Year Range Pct): | 17.1 | 80.2 | 86.3 |
| – Strength Index Reading (3 Year Range): | Bearish-Extreme | Bullish-Extreme | Bullish-Extreme |
| NET POSITION MOVEMENT INDEX: | |||
| – 6-Week Change in Strength Index: | 12.2 | -11.8 | -4.8 |
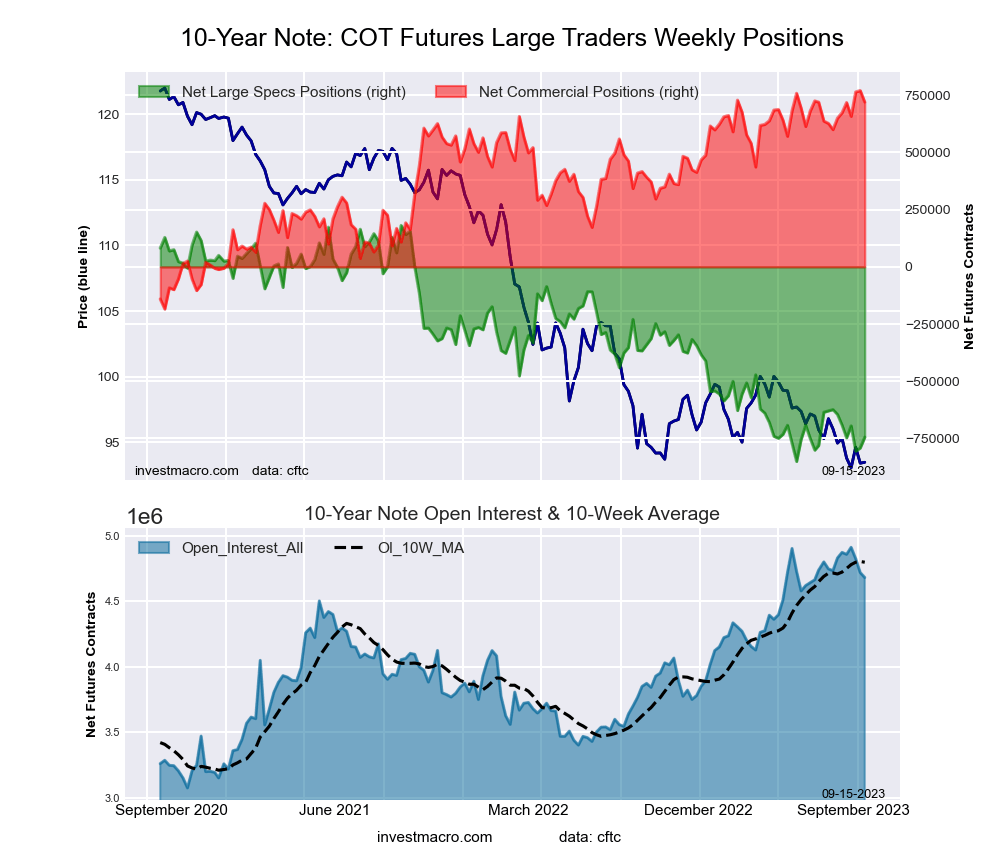
10-Year Treasury Note Futures:
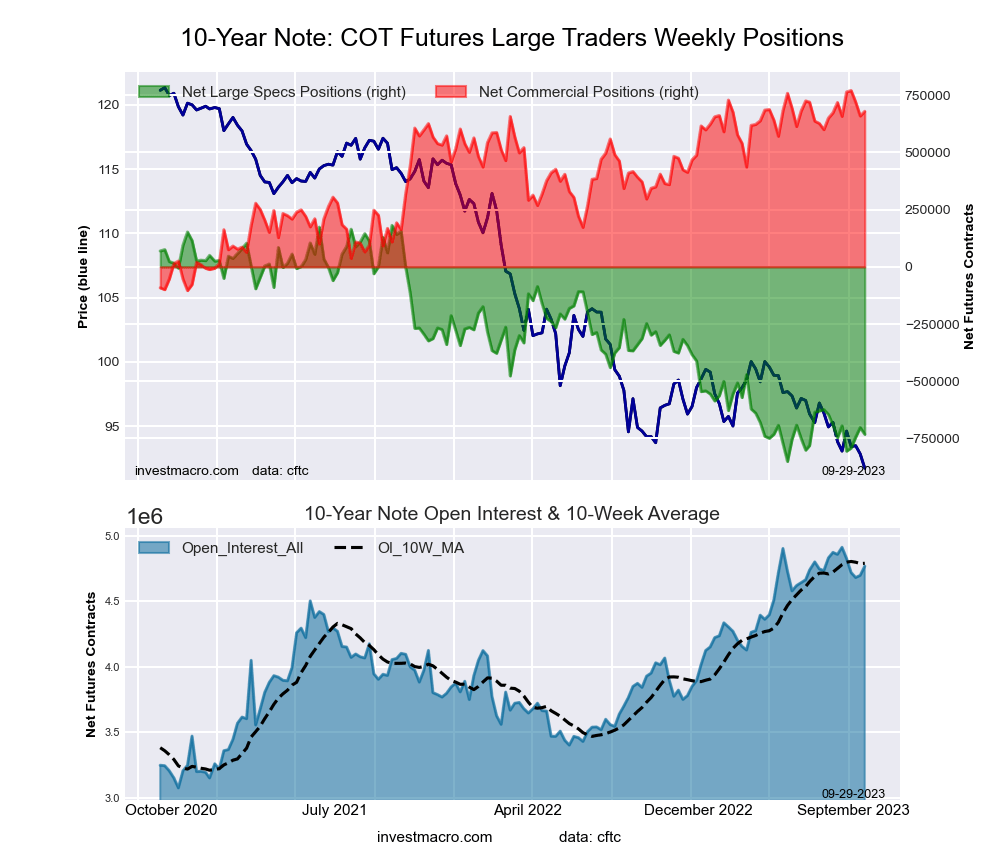 The 10-Year Treasury Note large speculator standing this week resulted in a net position of -731,998 contracts in the data reported through Tuesday. This was a weekly reduction of -29,682 contracts from the previous week which had a total of -702,316 net contracts.
This week’s current strength score (the trader positioning range over the past three years, measured from 0 to 100) shows the speculators are currently Bearish-Extreme with a score of 11.5 percent. The commercials are Bullish-Extreme with a score of 89.6 percent and the small traders (not shown in chart) are Bullish-Extreme with a score of 84.9 percent.
Price Trend-Following Model: Strong Downtrend
Our weekly trend-following model classifies the current market price position as: Strong Downtrend. The current action for the model is considered to be: Hold – Maintain Short Position.
| 10-Year Treasury Note Statistics | SPECULATORS | COMMERCIALS | SMALL TRADERS |
| – Percent of Open Interest Longs: | 10.7 | 78.1 | 9.1 |
| – Percent of Open Interest Shorts: | 26.0 | 63.9 | 8.0 |
| – Net Position: | -731,998 | 679,643 | 52,355 |
| – Gross Longs: | 509,578 | 3,724,693 | 434,390 |
| – Gross Shorts: | 1,241,576 | 3,045,050 | 382,035 |
| – Long to Short Ratio: | 0.4 to 1 | 1.2 to 1 | 1.1 to 1 |
| NET POSITION TREND: | |||
| – Strength Index Score (3 Year Range Pct): | 11.5 | 89.6 | 84.9 |
| – Strength Index Reading (3 Year Range): | Bearish-Extreme | Bullish-Extreme | Bullish-Extreme |
| NET POSITION MOVEMENT INDEX: | |||
| – 6-Week Change in Strength Index: | 1.4 | -4.4 | 5.2 |
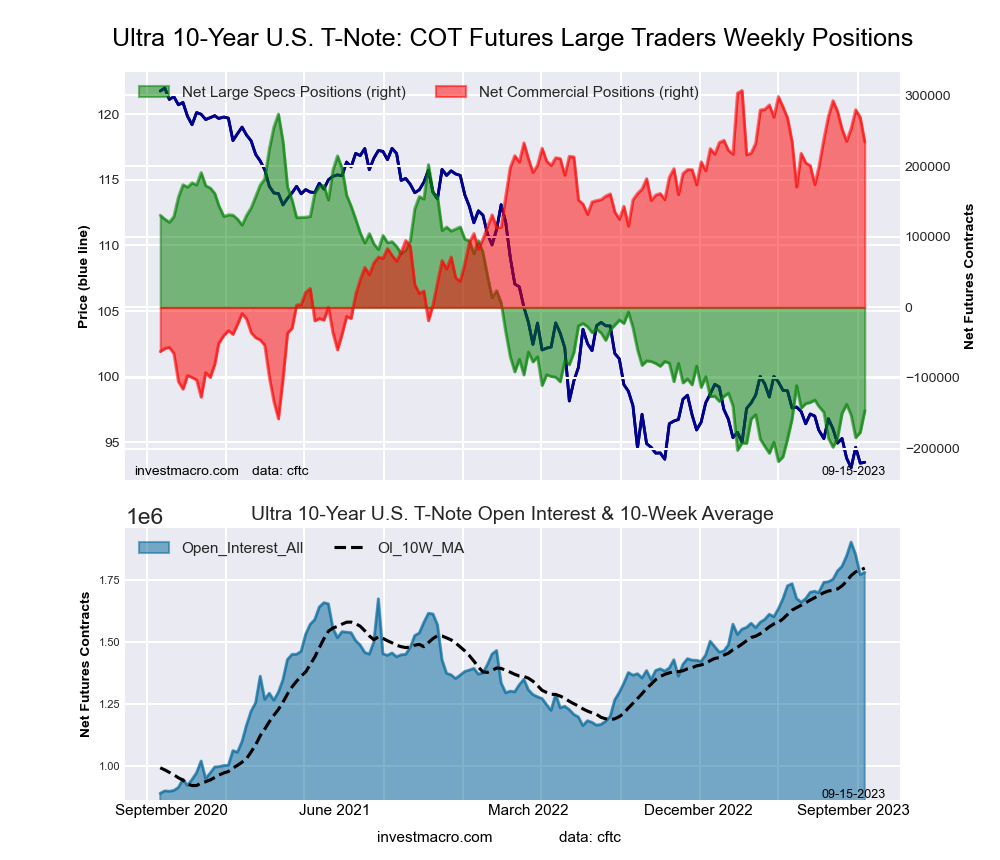
Ultra 10-Year Notes Futures:
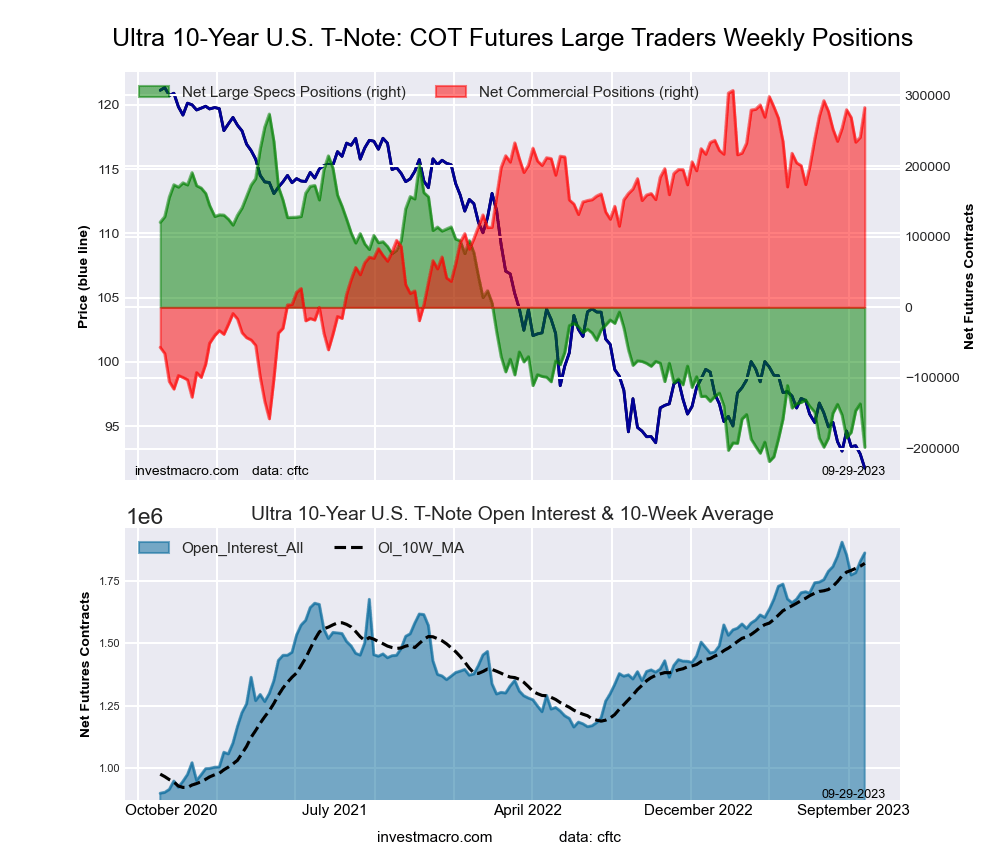 The Ultra 10-Year Notes large speculator standing this week resulted in a net position of -198,126 contracts in the data reported through Tuesday. This was a weekly fall of -61,389 contracts from the previous week which had a total of -136,737 net contracts.
This week’s current strength score (the trader positioning range over the past three years, measured from 0 to 100) shows the speculators are currently Bearish-Extreme with a score of 4.1 percent. The commercials are Bullish-Extreme with a score of 94.8 percent and the small traders (not shown in chart) are Bullish with a score of 63.8 percent.
Price Trend-Following Model: Weak Uptrend
Our weekly trend-following model classifies the current market price position as: Weak Uptrend. The current action for the model is considered to be: Hold – Maintain Long Position.
| Ultra 10-Year Notes Statistics | SPECULATORS | COMMERCIALS | SMALL TRADERS |
| – Percent of Open Interest Longs: | 9.6 | 77.5 | 10.7 |
| – Percent of Open Interest Shorts: | 20.3 | 62.3 | 15.2 |
| – Net Position: | -198,126 | 282,654 | -84,528 |
| – Gross Longs: | 179,408 | 1,441,650 | 198,446 |
| – Gross Shorts: | 377,534 | 1,158,996 | 282,974 |
| – Long to Short Ratio: | 0.5 to 1 | 1.2 to 1 | 0.7 to 1 |
| NET POSITION TREND: | |||
| – Strength Index Score (3 Year Range Pct): | 4.1 | 94.8 | 63.8 |
| – Strength Index Reading (3 Year Range): | Bearish-Extreme | Bullish-Extreme | Bullish |
| NET POSITION MOVEMENT INDEX: | |||
| – 6-Week Change in Strength Index: | -12.3 | 10.2 | 7.9 |
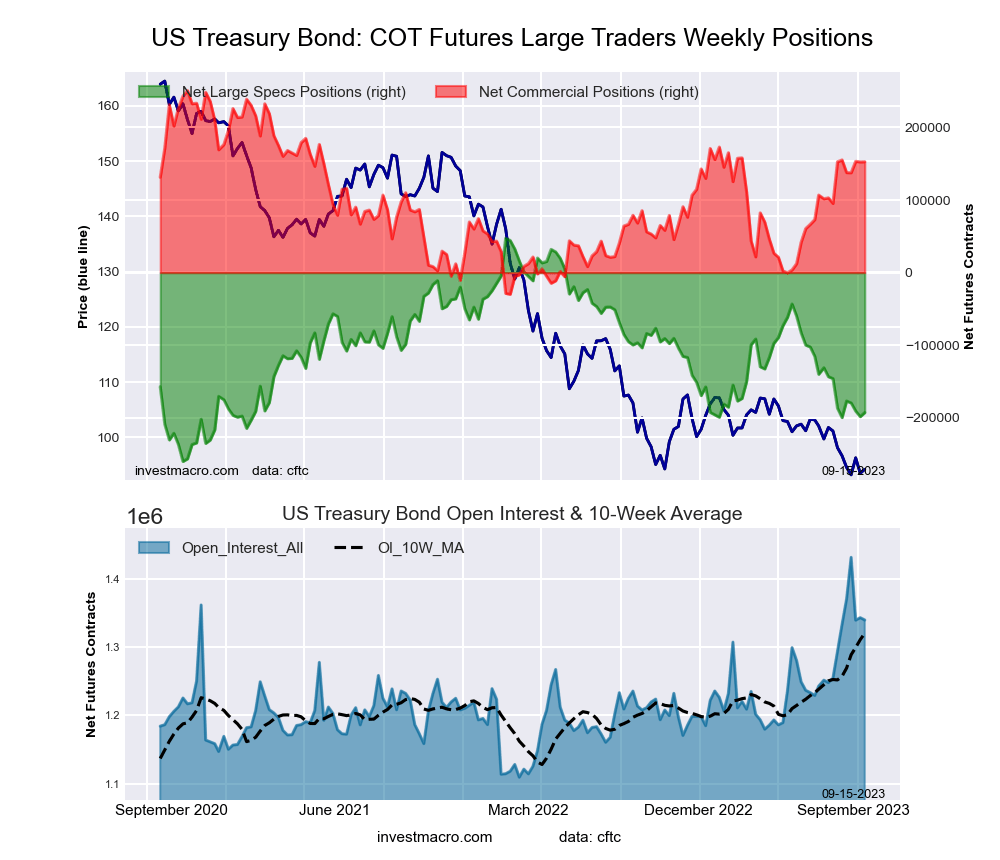
US Treasury Bonds Futures:
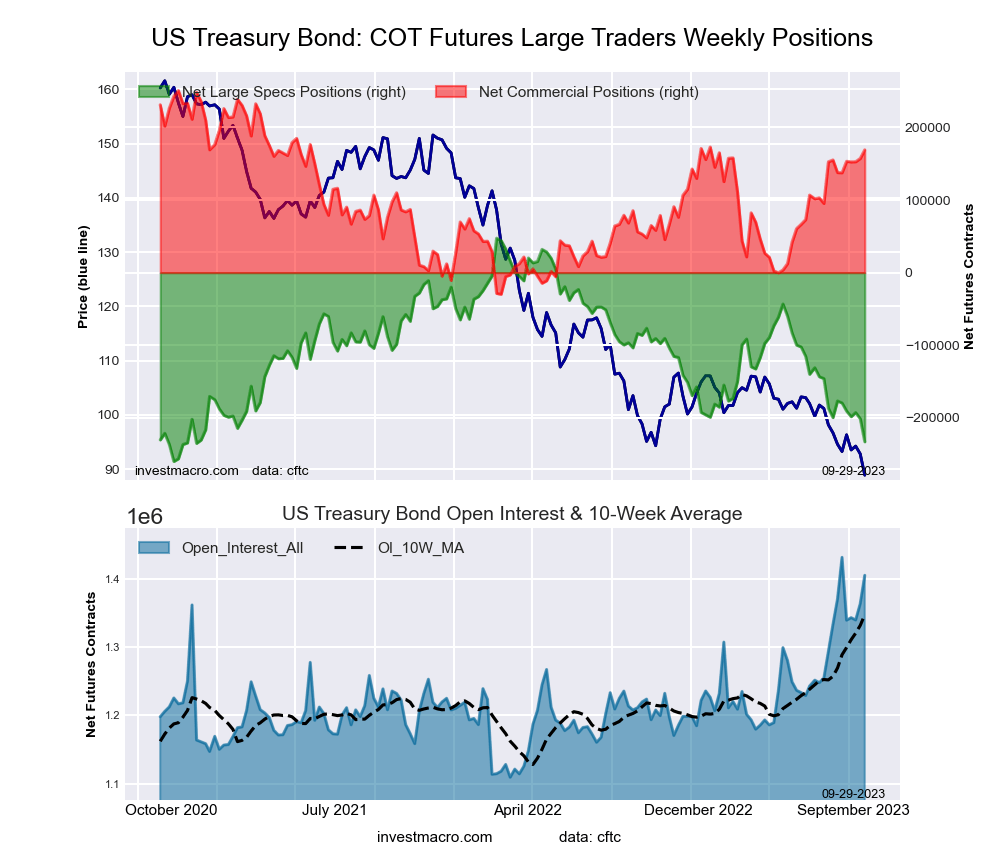 The US Treasury Bonds large speculator standing this week resulted in a net position of -232,811 contracts in the data reported through Tuesday. This was a weekly fall of -31,704 contracts from the previous week which had a total of -201,107 net contracts.
This week’s current strength score (the trader positioning range over the past three years, measured from 0 to 100) shows the speculators are currently Bearish-Extreme with a score of 8.8 percent. The commercials are Bullish with a score of 70.9 percent and the small traders (not shown in chart) are Bullish-Extreme with a score of 94.9 percent.
Price Trend-Following Model: Strong Downtrend
Our weekly trend-following model classifies the current market price position as: Strong Downtrend. The current action for the model is considered to be: Hold – Maintain Short Position.
| US Treasury Bonds Statistics | SPECULATORS | COMMERCIALS | SMALL TRADERS |
| – Percent of Open Interest Longs: | 5.3 | 79.2 | 14.6 |
| – Percent of Open Interest Shorts: | 21.8 | 67.2 | 10.0 |
| – Net Position: | -232,811 | 169,018 | 63,793 |
| – Gross Longs: | 74,134 | 1,113,332 | 204,449 |
| – Gross Shorts: | 306,945 | 944,314 | 140,656 |
| – Long to Short Ratio: | 0.2 to 1 | 1.2 to 1 | 1.5 to 1 |
| NET POSITION TREND: | |||
| – Strength Index Score (3 Year Range Pct): | 8.8 | 70.9 | 94.9 |
| – Strength Index Reading (3 Year Range): | Bearish-Extreme | Bullish | Bullish-Extreme |
| NET POSITION MOVEMENT INDEX: | |||
| – 6-Week Change in Strength Index: | -18.2 | 11.2 | 18.1 |
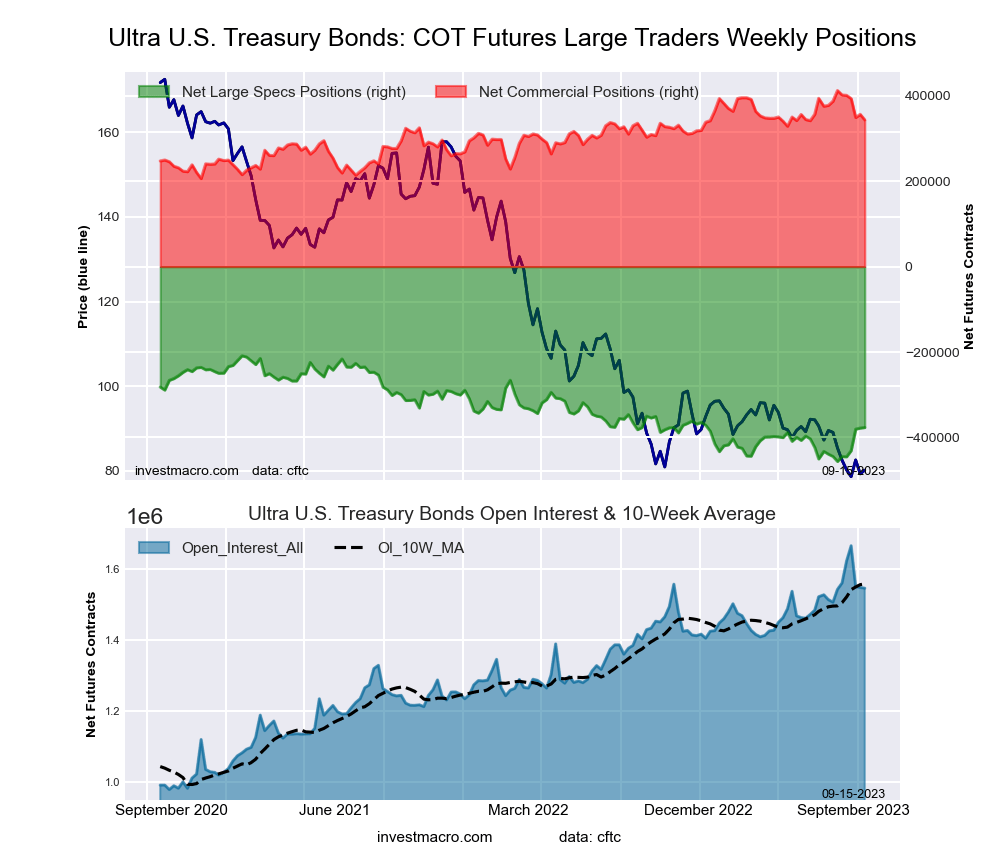
Ultra US Treasury Bonds Futures:
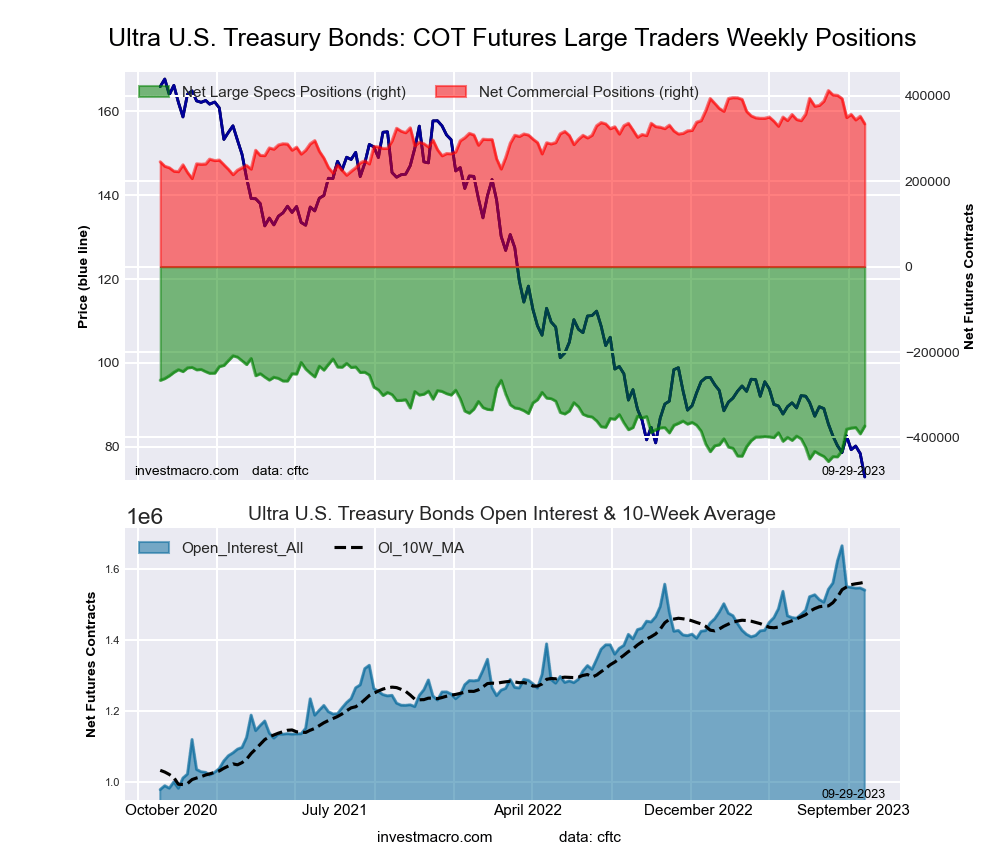 The Ultra US Treasury Bonds large speculator standing this week resulted in a net position of -373,447 contracts in the data reported through Tuesday. This was a weekly rise of 18,129 contracts from the previous week which had a total of -391,576 net contracts.
This week’s current strength score (the trader positioning range over the past three years, measured from 0 to 100) shows the speculators are currently Bearish with a score of 33.5 percent. The commercials are Bullish with a score of 62.1 percent and the small traders (not shown in chart) are Bullish with a score of 74.0 percent.
Price Trend-Following Model: Strong Downtrend
Our weekly trend-following model classifies the current market price position as: Strong Downtrend. The current action for the model is considered to be: Hold – Maintain Short Position.
| Ultra US Treasury Bonds Statistics | SPECULATORS | COMMERCIALS | SMALL TRADERS |
| – Percent of Open Interest Longs: | 5.7 | 81.6 | 12.2 |
| – Percent of Open Interest Shorts: | 30.0 | 59.8 | 9.7 |
| – Net Position: | -373,447 | 334,479 | 38,968 |
| – Gross Longs: | 87,944 | 1,256,355 | 187,791 |
| – Gross Shorts: | 461,391 | 921,876 | 148,823 |
| – Long to Short Ratio: | 0.2 to 1 | 1.4 to 1 | 1.3 to 1 |
| NET POSITION TREND: | |||
| – Strength Index Score (3 Year Range Pct): | 33.5 | 62.1 | 74.0 |
| – Strength Index Reading (3 Year Range): | Bearish | Bullish | Bullish |
| NET POSITION MOVEMENT INDEX: | |||
| – 6-Week Change in Strength Index: | 29.1 | -32.4 | -5.0 |
Article By InvestMacro – Receive our weekly COT Newsletter
See our Weekly Trend Model Readings and Actions for each COT Futures Market and Category. All information contained in this data are for general informational purposes only and do not constitute investment advice.
*COT Report: The COT data, released weekly to the public each Friday, is updated through the most recent Tuesday (data is 3 days old) and shows a quick view of how large speculators or non-commercials (for-profit traders) were positioned in the futures markets.
The CFTC categorizes trader positions according to commercial hedgers (traders who use futures contracts for hedging as part of the business), non-commercials (large traders who speculate to realize trading profits) and nonreportable traders (usually small traders/speculators) as well as their open interest (contracts open in the market at time of reporting). See CFTC criteria here.


