
By InvestMacro

Here are the latest charts and statistics for the Commitment of Traders (COT) data published by the Commodities Futures Trading Commission (CFTC).
The latest COT data is updated through Tuesday October 31st and shows a quick view of how large market participants (for-profit speculators and commercial traders) were positioned in the futures markets. All currency positions are in direct relation to the US dollar where, for example, a bet for the euro is a bet that the euro will rise versus the dollar while a bet against the euro will be a bet that the euro will decline versus the dollar.
Weekly Speculator Changes led by Australian Dollar & Brazilian Real
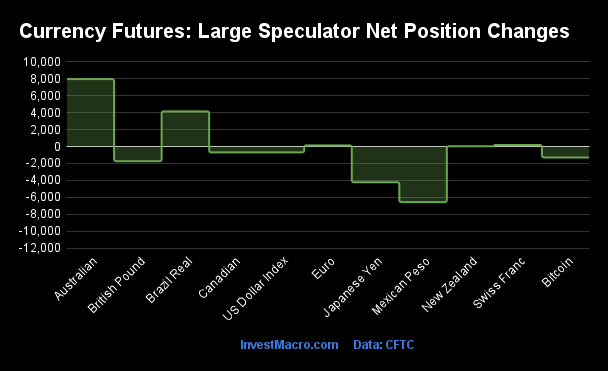
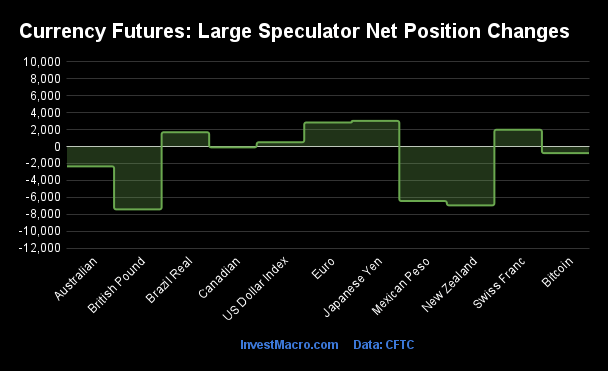
The COT currency market speculator bets were lower this week as five out of the eleven currency markets we cover had higher positioning while the other six markets had lower speculator contracts.
Leading the gains for the currency markets was the Australian Dollar (7,971 contracts) with the Brazilian Real (4,161 contracts), Swiss Franc (185 contracts), the Euro (136 contracts) and the New Zealand Dollar (34 contracts) also showing positive weeks.
The currencies seeing declines in speculator bets on the week were the Mexican Peso (-6,564 contracts), the Japanese Yen (-4,219 contracts), the British Pound (-1,735 contracts), Bitcoin (-1,292 contracts), the Canadian Dollar (-693 contracts) the US Dollar Index (-686 contracts) also registering lower bets on the week.
Speculators push Australian Dollar bets higher as RBA possibly to raise rate
Highlighting the COT currency’s data this week is the boost in the speculator’s positioning for the Australian dollar. Large speculative Aussie currency positions gained this week by almost +8,000 net contracts, the largest weekly gain in six weeks. This improved sentiment has pushed the speculators bets higher for the fourth time out of the past six weeks.
The overall Aussie speculator positioning has been consistently bearish since dropping from a net bullish position to a net bearish position on May 25th of 2021. This week marks the 128th consecutive week of bearish speculator positions with the most bearish level being seen on September 19th at a total of -96,946 contracts.
There is a chance that the worst of the positioning for the AUD has been seen because of a possible divergence in central bank interest rate moves. The Reserve Bank of Australia (RBA) is widely expected to raise their benchmark rate (currently at 4.15 percent) in the next policy meeting on November 7th to combat stubborn inflation that has surpassed expectations of a faster decline.
The US Federal Reserve, meanwhile, held its own rate policy steady at the most recent meeting and the current market expectation (95 percent in CME FedWatch Tool) is for the Fed to hold again at the December 13th meeting.
The Australian dollar (versus the US Dollar) saw a strong rise this week and just got over the 0.6500 psychological level to close out the week. The AUD has been in a long downtrend since reaching a high in 2021 near 0.80 exchange rate and has a long ways to go for a turnaround but so far, the currency has seen strong support at 0.6300 and has been able to avoid dropping to the 2022 lows.
| Oct-31-2023 | OI | OI-Index | Spec-Net | Spec-Index | Com-Net | COM-Index | Smalls-Net | Smalls-Index |
|---|---|---|---|---|---|---|---|---|
| USD Index | 42,803 | 42 | 18,985 | 57 | -20,096 | 44 | 1,111 | 19 |
| EUR | 694,962 | 31 | 85,389 | 57 | -109,031 | 48 | 23,642 | 17 |
| GBP | 229,991 | 55 | -20,371 | 42 | 34,154 | 65 | -13,783 | 31 |
| JPY | 277,272 | 94 | -103,848 | 8 | 107,566 | 88 | -3,718 | 46 |
| CHF | 56,353 | 83 | -14,910 | 16 | 25,967 | 87 | -11,057 | 21 |
| CAD | 198,528 | 60 | -49,332 | 9 | 56,052 | 94 | -6,720 | 8 |
| AUD | 196,866 | 55 | -75,110 | 20 | 86,432 | 82 | -11,322 | 25 |
| NZD | 57,676 | 75 | -12,817 | 22 | 16,236 | 82 | -3,419 | 9 |
| MXN | 199,078 | 37 | 31,297 | 58 | -33,883 | 41 | 2,586 | 28 |
| RUB | 20,930 | 4 | 7,543 | 31 | -7,150 | 69 | -393 | 24 |
| BRL | 67,068 | 63 | 9,346 | 47 | -11,022 | 52 | 1,676 | 50 |
| Bitcoin | 19,603 | 99 | -1,746 | 40 | 903 | 0 | 843 | 32 |
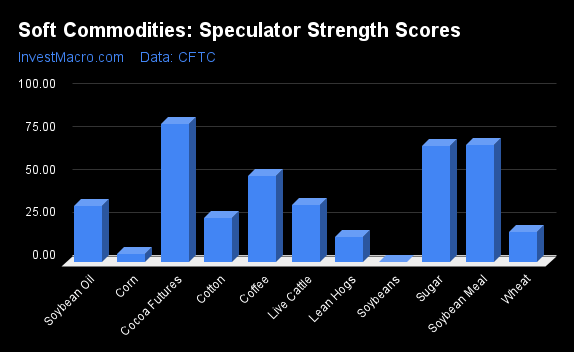
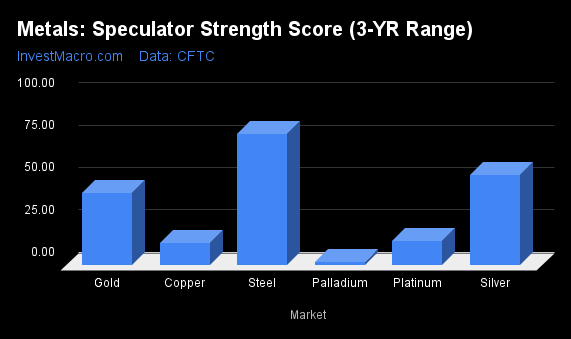
Strength Scores led by Mexican Peso, Euro & US Dollar Index

COT Strength Scores (a normalized measure of Speculator positions over a 3-Year range, from 0 to 100 where above 80 is Extreme-Bullish and below 20 is Extreme-Bearish) showed that the Mexican Peso (58 percent), the Euro (57 percent) and the US Dollar Index (57 percent) lead the currency markets this week.
On the downside, the Japanese Yen (8 percent), the Canadian Dollar (9 percent) and the Swiss Franc (16 percent) come in at the lowest strength levels currently and are in Extreme-Bearish territory (below 20 percent).
Strength Statistics:
US Dollar Index (56.6 percent) vs US Dollar Index previous week (57.7 percent)
EuroFX (56.7 percent) vs EuroFX previous week (56.6 percent)
British Pound Sterling (41.6 percent) vs British Pound Sterling previous week (42.8 percent)
Japanese Yen (8.4 percent) vs Japanese Yen previous week (10.9 percent)
Swiss Franc (15.7 percent) vs Swiss Franc previous week (15.2 percent)
Canadian Dollar (8.6 percent) vs Canadian Dollar previous week (9.2 percent)
Australian Dollar (20.0 percent) vs Australian Dollar previous week (12.7 percent)
New Zealand Dollar (22.0 percent) vs New Zealand Dollar previous week (21.9 percent)
Mexican Peso (58.2 percent) vs Mexican Peso previous week (62.2 percent)
Brazilian Real (46.6 percent) vs Brazilian Real previous week (41.2 percent)
Bitcoin (40.1 percent) vs Bitcoin previous week (59.6 percent)
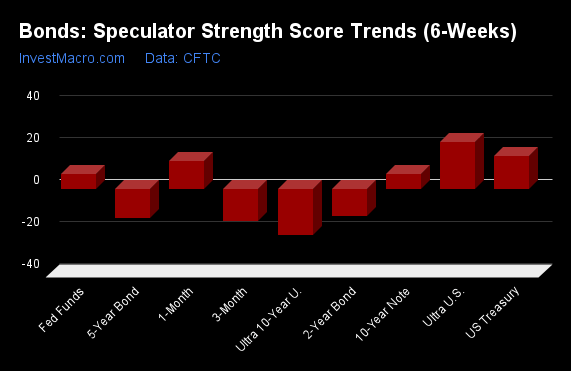
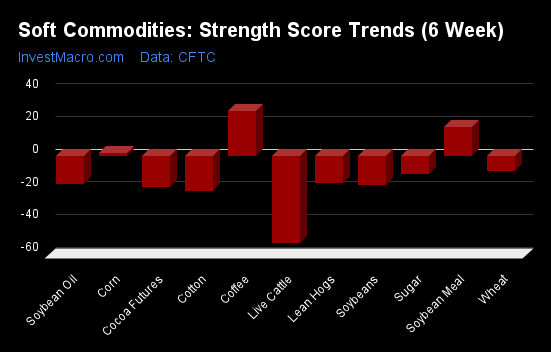
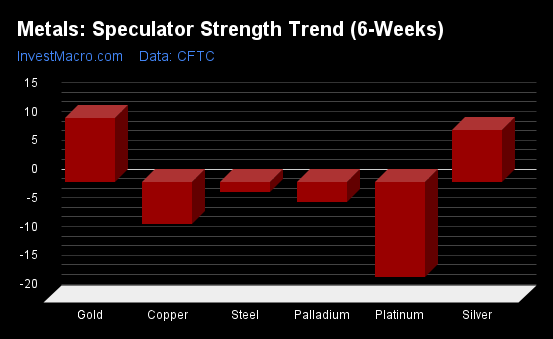
New Zealand Dollar & Australian Dollar top the 6-Week Strength Trends
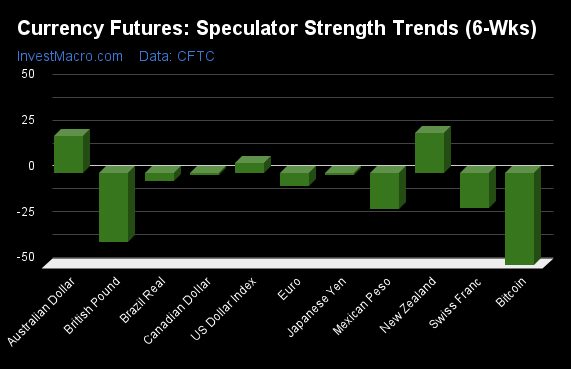
COT Strength Score Trends (or move index, calculates the 6-week changes in strength scores) showed that the New Zealand Dollar (22 percent) and the Australian Dollar (20 percent) lead the past six weeks trends for the currencies. The US Dollar Index (6 percent) is the next highest positive mover in the latest trends data.
Bitcoin (-50 percent) leads the downside trend scores currently with the British Pound (-38 percent), the Mexican Peso (-20 percent) and the Swiss Franc (-19 percent) following next with lower trend scores.
Strength Trend Statistics:
US Dollar Index (5.6 percent) vs US Dollar Index previous week (22.7 percent)
EuroFX (-7.1 percent) vs EuroFX previous week (-11.9 percent)
British Pound Sterling (-37.5 percent) vs British Pound Sterling previous week (-45.0 percent)
Japanese Yen (-1.3 percent) vs Japanese Yen previous week (-0.5 percent)
Swiss Franc (-19.1 percent) vs Swiss Franc previous week (-15.8 percent)
Canadian Dollar (-1.2 percent) vs Canadian Dollar previous week (-6.3 percent)
Australian Dollar (20.0 percent) vs Australian Dollar previous week (-3.2 percent)
New Zealand Dollar (22.0 percent) vs New Zealand Dollar previous week (4.6 percent)
Mexican Peso (-19.7 percent) vs Mexican Peso previous week (-17.7 percent)
Brazilian Real (-4.5 percent) vs Brazilian Real previous week (-10.4 percent)
Bitcoin (-50.3 percent) vs Bitcoin previous week (-40.4 percent)
Individual COT Forex Markets:
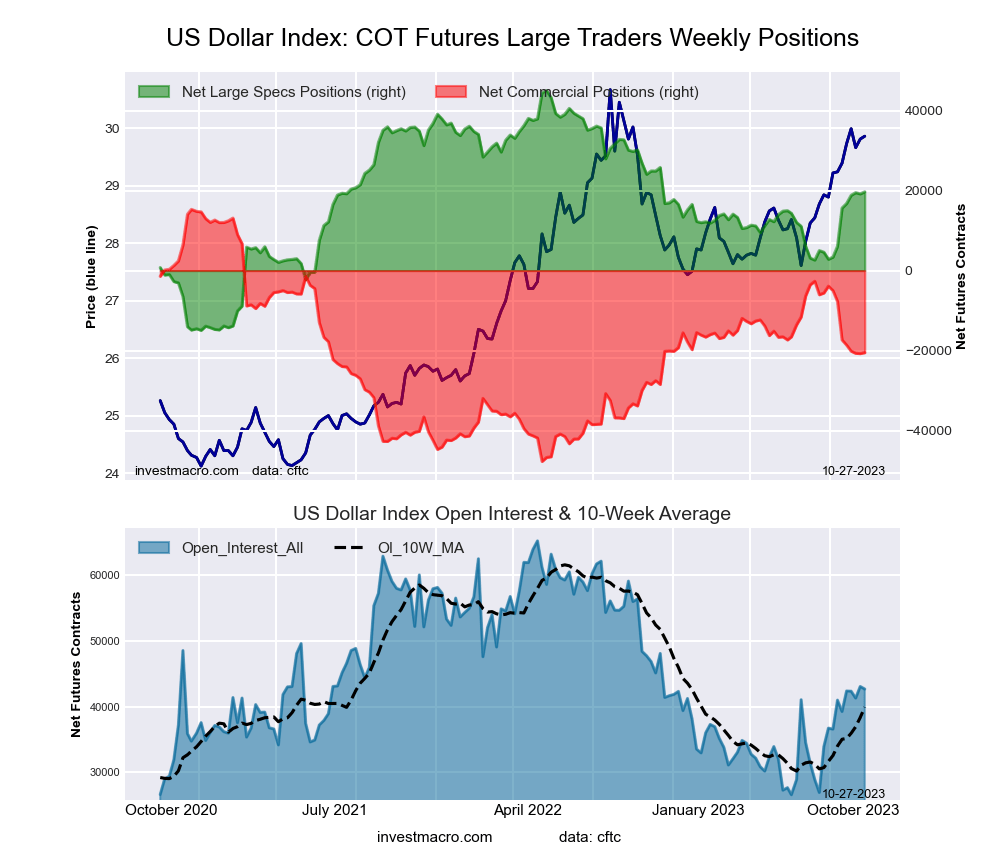
US Dollar Index Futures:
 The US Dollar Index large speculator standing this week totaled a net position of 18,985 contracts in the data reported through Tuesday. This was a weekly fall of -686 contracts from the previous week which had a total of 19,671 net contracts.
This week’s current strength score (the trader positioning range over the past three years, measured from 0 to 100) shows the speculators are currently Bullish with a score of 56.6 percent. The commercials are Bearish with a score of 43.9 percent and the small traders (not shown in chart) are Bearish-Extreme with a score of 19.0 percent.
Price Trend-Following Model: Uptrend
Our weekly trend-following model classifies the current market price position as: Uptrend. The current action for the model is considered to be: Hold – Maintain Long Position.
| US DOLLAR INDEX Statistics | SPECULATORS | COMMERCIALS | SMALL TRADERS |
| – Percent of Open Interest Longs: | 64.4 | 22.6 | 10.4 |
| – Percent of Open Interest Shorts: | 20.1 | 69.5 | 7.8 |
| – Net Position: | 18,985 | -20,096 | 1,111 |
| – Gross Longs: | 27,571 | 9,671 | 4,441 |
| – Gross Shorts: | 8,586 | 29,767 | 3,330 |
| – Long to Short Ratio: | 3.2 to 1 | 0.3 to 1 | 1.3 to 1 |
| NET POSITION TREND: | |||
| – Strength Index Score (3 Year Range Pct): | 56.6 | 43.9 | 19.0 |
| – Strength Index Reading (3 Year Range): | Bullish | Bearish | Bearish-Extreme |
| NET POSITION MOVEMENT INDEX: | |||
| – 6-Week Change in Strength Index: | 5.6 | -4.4 | -7.5 |
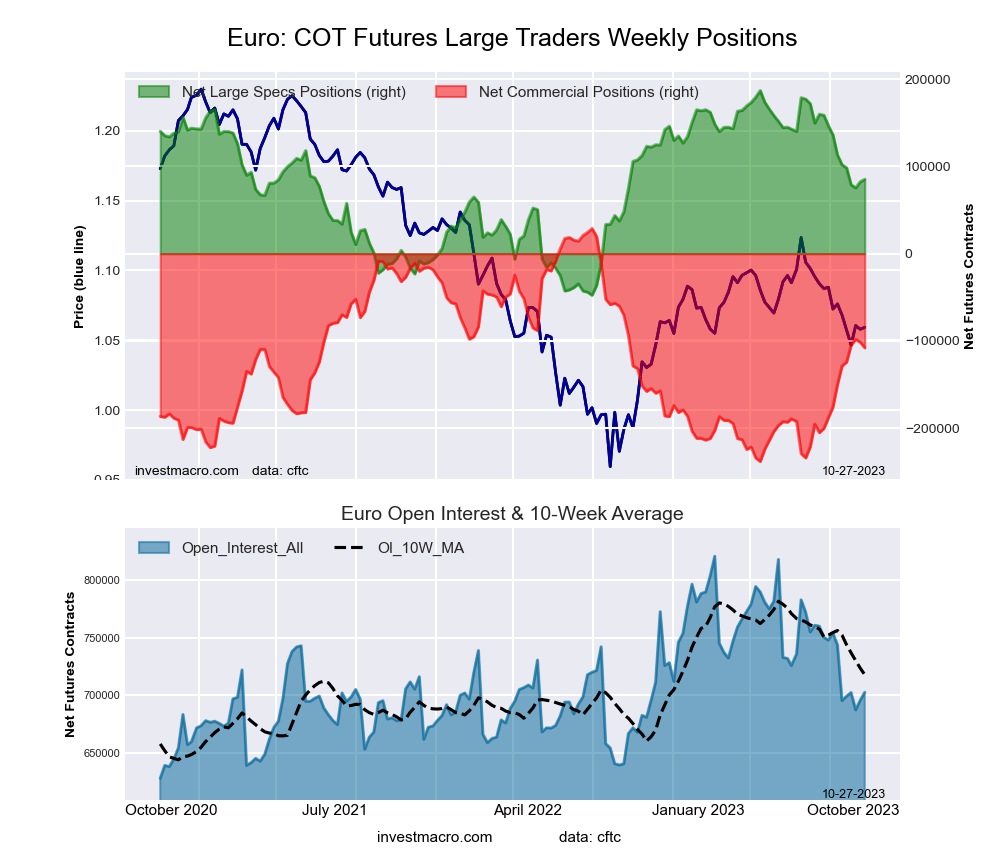
Euro Currency Futures:
 The Euro Currency large speculator standing this week totaled a net position of 85,389 contracts in the data reported through Tuesday. This was a weekly gain of 136 contracts from the previous week which had a total of 85,253 net contracts.
This week’s current strength score (the trader positioning range over the past three years, measured from 0 to 100) shows the speculators are currently Bullish with a score of 56.7 percent. The commercials are Bearish with a score of 48.4 percent and the small traders (not shown in chart) are Bearish-Extreme with a score of 16.7 percent.
Price Trend-Following Model: Downtrend
Our weekly trend-following model classifies the current market price position as: Downtrend. The current action for the model is considered to be: Hold – Maintain Short Position.
| EURO Currency Statistics | SPECULATORS | COMMERCIALS | SMALL TRADERS |
| – Percent of Open Interest Longs: | 30.3 | 56.6 | 11.4 |
| – Percent of Open Interest Shorts: | 18.1 | 72.3 | 8.0 |
| – Net Position: | 85,389 | -109,031 | 23,642 |
| – Gross Longs: | 210,834 | 393,348 | 79,333 |
| – Gross Shorts: | 125,445 | 502,379 | 55,691 |
| – Long to Short Ratio: | 1.7 to 1 | 0.8 to 1 | 1.4 to 1 |
| NET POSITION TREND: | |||
| – Strength Index Score (3 Year Range Pct): | 56.7 | 48.4 | 16.7 |
| – Strength Index Reading (3 Year Range): | Bullish | Bearish | Bearish-Extreme |
| NET POSITION MOVEMENT INDEX: | |||
| – 6-Week Change in Strength Index: | -7.1 | 7.4 | -5.0 |
British Pound Sterling Futures:
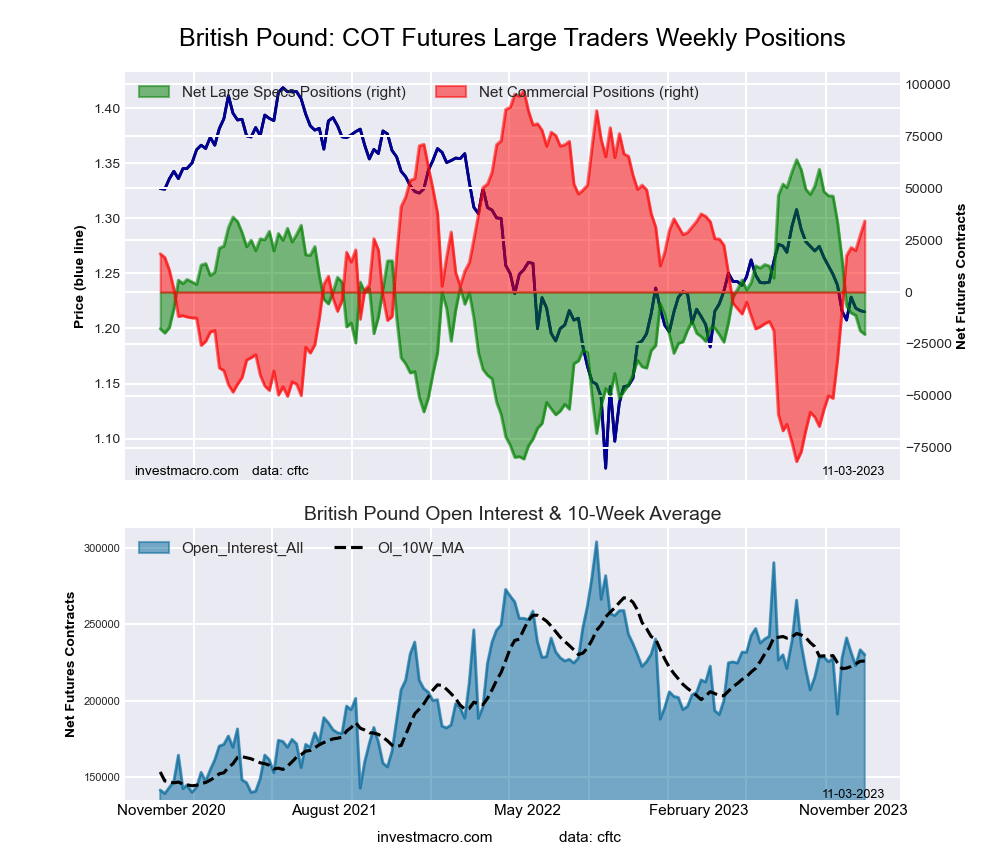 The British Pound Sterling large speculator standing this week totaled a net position of -20,371 contracts in the data reported through Tuesday. This was a weekly fall of -1,735 contracts from the previous week which had a total of -18,636 net contracts.
This week’s current strength score (the trader positioning range over the past three years, measured from 0 to 100) shows the speculators are currently Bearish with a score of 41.6 percent. The commercials are Bullish with a score of 64.8 percent and the small traders (not shown in chart) are Bearish with a score of 31.0 percent.
Price Trend-Following Model: Downtrend
Our weekly trend-following model classifies the current market price position as: Downtrend. The current action for the model is considered to be: Hold – Maintain Short Position.
| BRITISH POUND Statistics | SPECULATORS | COMMERCIALS | SMALL TRADERS |
| – Percent of Open Interest Longs: | 27.7 | 59.5 | 9.7 |
| – Percent of Open Interest Shorts: | 36.6 | 44.7 | 15.7 |
| – Net Position: | -20,371 | 34,154 | -13,783 |
| – Gross Longs: | 63,712 | 136,888 | 22,325 |
| – Gross Shorts: | 84,083 | 102,734 | 36,108 |
| – Long to Short Ratio: | 0.8 to 1 | 1.3 to 1 | 0.6 to 1 |
| NET POSITION TREND: | |||
| – Strength Index Score (3 Year Range Pct): | 41.6 | 64.8 | 31.0 |
| – Strength Index Reading (3 Year Range): | Bearish | Bullish | Bearish |
| NET POSITION MOVEMENT INDEX: | |||
| – 6-Week Change in Strength Index: | -37.5 | 37.4 | -24.9 |
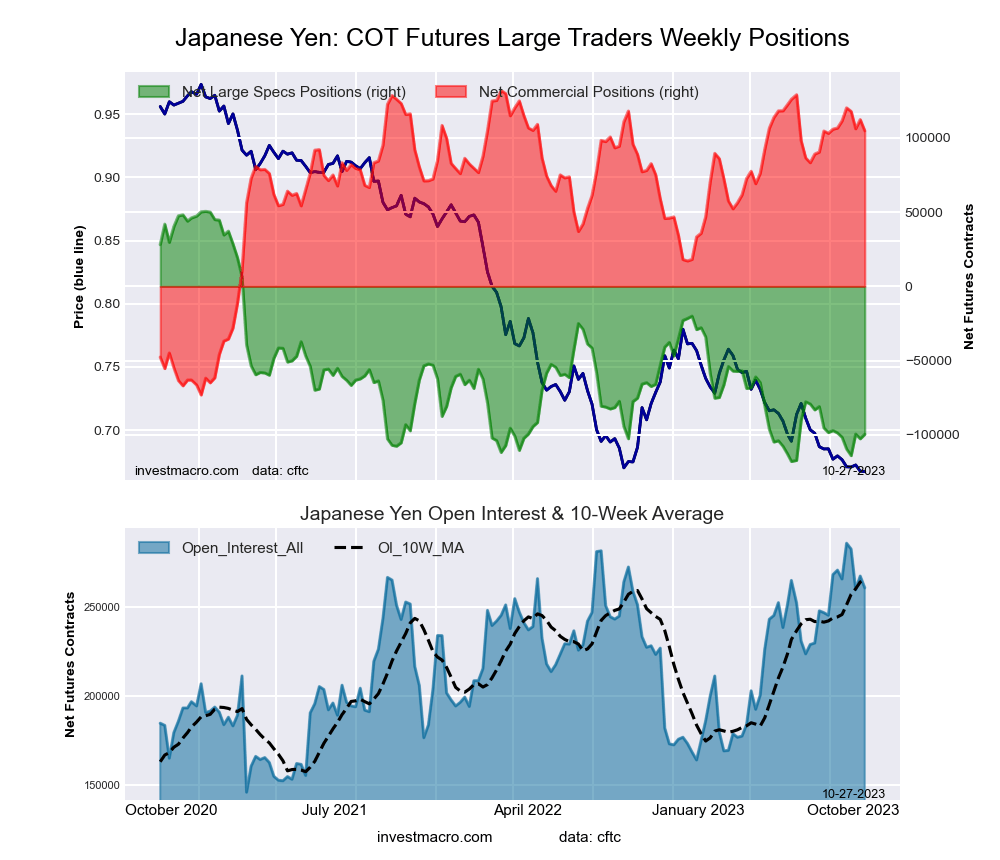
Japanese Yen Futures:
 The Japanese Yen large speculator standing this week totaled a net position of -103,848 contracts in the data reported through Tuesday. This was a weekly decline of -4,219 contracts from the previous week which had a total of -99,629 net contracts.
This week’s current strength score (the trader positioning range over the past three years, measured from 0 to 100) shows the speculators are currently Bearish-Extreme with a score of 8.4 percent. The commercials are Bullish-Extreme with a score of 88.1 percent and the small traders (not shown in chart) are Bearish with a score of 45.9 percent.
Price Trend-Following Model: Downtrend
Our weekly trend-following model classifies the current market price position as: Downtrend. The current action for the model is considered to be: Hold – Maintain Short Position.
| JAPANESE YEN Statistics | SPECULATORS | COMMERCIALS | SMALL TRADERS |
| – Percent of Open Interest Longs: | 13.6 | 69.8 | 15.1 |
| – Percent of Open Interest Shorts: | 51.0 | 31.0 | 16.4 |
| – Net Position: | -103,848 | 107,566 | -3,718 |
| – Gross Longs: | 37,641 | 193,460 | 41,836 |
| – Gross Shorts: | 141,489 | 85,894 | 45,554 |
| – Long to Short Ratio: | 0.3 to 1 | 2.3 to 1 | 0.9 to 1 |
| NET POSITION TREND: | |||
| – Strength Index Score (3 Year Range Pct): | 8.4 | 88.1 | 45.9 |
| – Strength Index Reading (3 Year Range): | Bearish-Extreme | Bullish-Extreme | Bearish |
| NET POSITION MOVEMENT INDEX: | |||
| – 6-Week Change in Strength Index: | -1.3 | -1.9 | 12.4 |
Swiss Franc Futures:
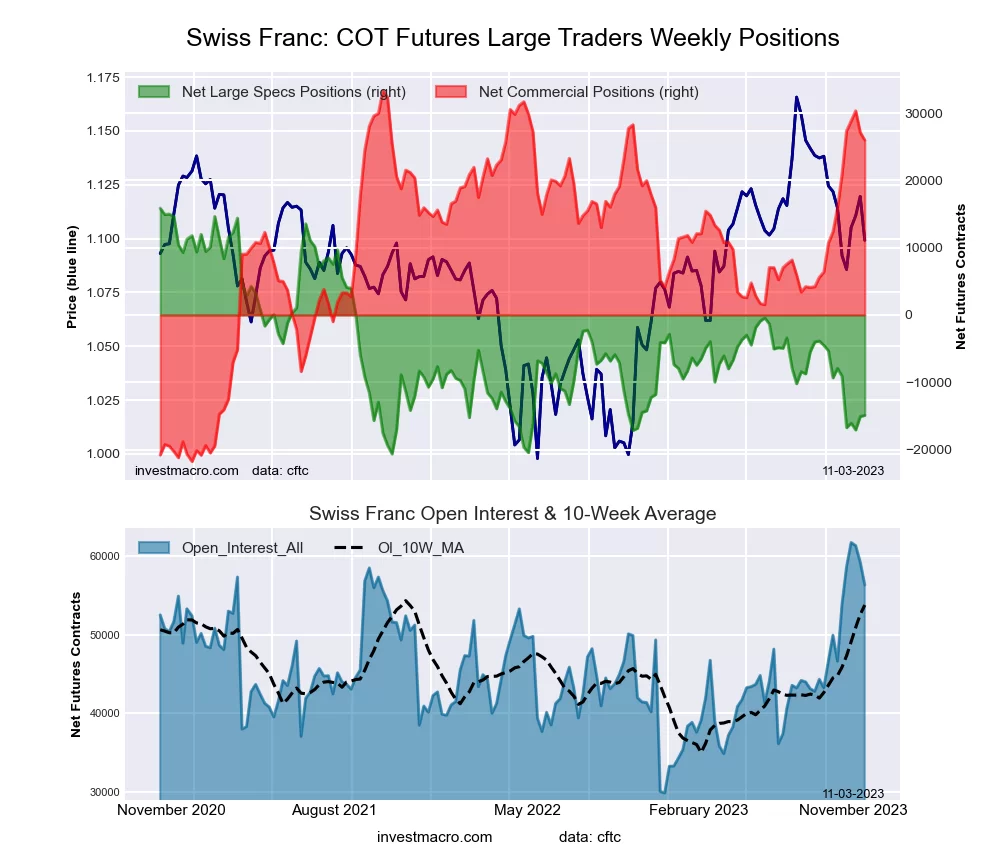 The Swiss Franc large speculator standing this week totaled a net position of -14,910 contracts in the data reported through Tuesday. This was a weekly boost of 185 contracts from the previous week which had a total of -15,095 net contracts.
This week’s current strength score (the trader positioning range over the past three years, measured from 0 to 100) shows the speculators are currently Bearish-Extreme with a score of 15.7 percent. The commercials are Bullish-Extreme with a score of 86.6 percent and the small traders (not shown in chart) are Bearish with a score of 21.4 percent.
Price Trend-Following Model: Downtrend
Our weekly trend-following model classifies the current market price position as: Downtrend. The current action for the model is considered to be: Hold – Maintain Short Position.
| SWISS FRANC Statistics | SPECULATORS | COMMERCIALS | SMALL TRADERS |
| – Percent of Open Interest Longs: | 15.8 | 67.8 | 16.3 |
| – Percent of Open Interest Shorts: | 42.2 | 21.7 | 35.9 |
| – Net Position: | -14,910 | 25,967 | -11,057 |
| – Gross Longs: | 8,888 | 38,201 | 9,178 |
| – Gross Shorts: | 23,798 | 12,234 | 20,235 |
| – Long to Short Ratio: | 0.4 to 1 | 3.1 to 1 | 0.5 to 1 |
| NET POSITION TREND: | |||
| – Strength Index Score (3 Year Range Pct): | 15.7 | 86.6 | 21.4 |
| – Strength Index Reading (3 Year Range): | Bearish-Extreme | Bullish-Extreme | Bearish |
| NET POSITION MOVEMENT INDEX: | |||
| – 6-Week Change in Strength Index: | -19.1 | 18.4 | -11.3 |
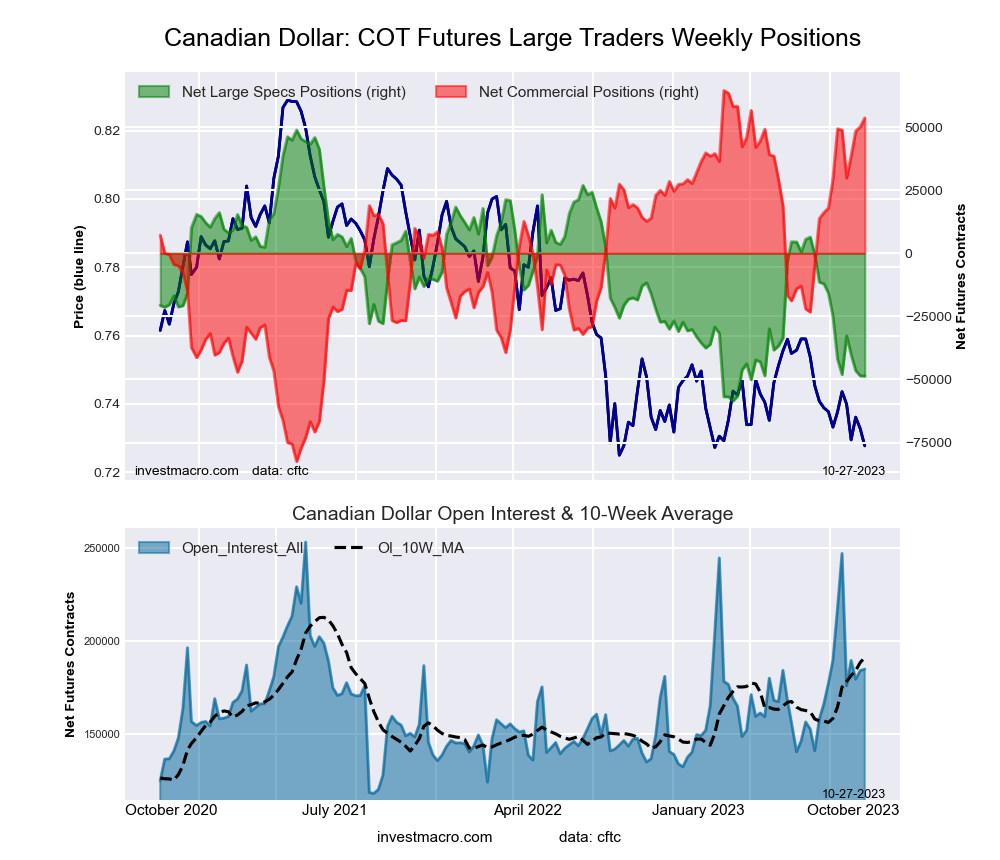
Canadian Dollar Futures:
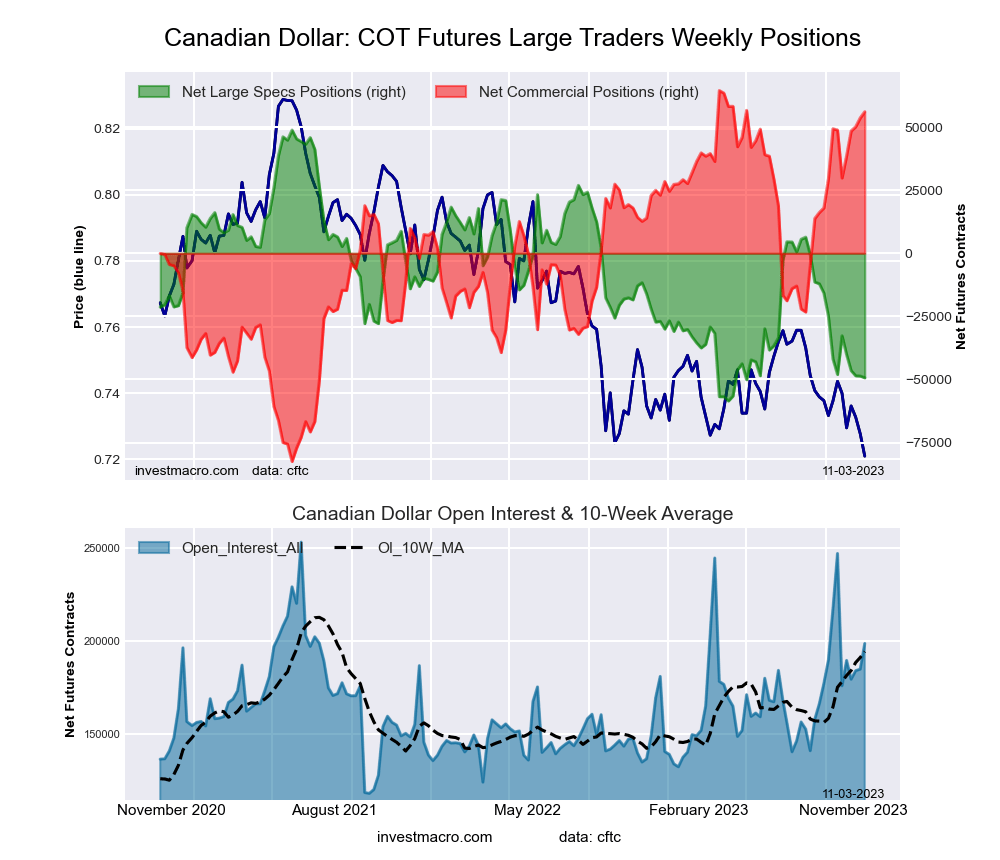 The Canadian Dollar large speculator standing this week totaled a net position of -49,332 contracts in the data reported through Tuesday. This was a weekly lowering of -693 contracts from the previous week which had a total of -48,639 net contracts.
This week’s current strength score (the trader positioning range over the past three years, measured from 0 to 100) shows the speculators are currently Bearish-Extreme with a score of 8.6 percent. The commercials are Bullish-Extreme with a score of 94.3 percent and the small traders (not shown in chart) are Bearish-Extreme with a score of 7.9 percent.
Price Trend-Following Model: Downtrend
Our weekly trend-following model classifies the current market price position as: Downtrend. The current action for the model is considered to be: Hold – Maintain Short Position.
| CANADIAN DOLLAR Statistics | SPECULATORS | COMMERCIALS | SMALL TRADERS |
| – Percent of Open Interest Longs: | 12.8 | 67.2 | 17.1 |
| – Percent of Open Interest Shorts: | 37.7 | 39.0 | 20.5 |
| – Net Position: | -49,332 | 56,052 | -6,720 |
| – Gross Longs: | 25,418 | 133,433 | 33,889 |
| – Gross Shorts: | 74,750 | 77,381 | 40,609 |
| – Long to Short Ratio: | 0.3 to 1 | 1.7 to 1 | 0.8 to 1 |
| NET POSITION TREND: | |||
| – Strength Index Score (3 Year Range Pct): | 8.6 | 94.3 | 7.9 |
| – Strength Index Reading (3 Year Range): | Bearish-Extreme | Bullish-Extreme | Bearish-Extreme |
| NET POSITION MOVEMENT INDEX: | |||
| – 6-Week Change in Strength Index: | -1.2 | 4.9 | -13.2 |
Australian Dollar Futures:
 The Australian Dollar large speculator standing this week totaled a net position of -75,110 contracts in the data reported through Tuesday. This was a weekly rise of 7,971 contracts from the previous week which had a total of -83,081 net contracts.
This week’s current strength score (the trader positioning range over the past three years, measured from 0 to 100) shows the speculators are currently Bearish-Extreme with a score of 20.0 percent. The commercials are Bullish-Extreme with a score of 82.2 percent and the small traders (not shown in chart) are Bearish with a score of 24.8 percent.
Price Trend-Following Model: Weak Downtrend
Our weekly trend-following model classifies the current market price position as: Weak Downtrend. The current action for the model is considered to be: Hold – Maintain Short Position.
| AUSTRALIAN DOLLAR Statistics | SPECULATORS | COMMERCIALS | SMALL TRADERS |
| – Percent of Open Interest Longs: | 16.7 | 68.9 | 11.5 |
| – Percent of Open Interest Shorts: | 54.8 | 25.0 | 17.2 |
| – Net Position: | -75,110 | 86,432 | -11,322 |
| – Gross Longs: | 32,805 | 135,553 | 22,592 |
| – Gross Shorts: | 107,915 | 49,121 | 33,914 |
| – Long to Short Ratio: | 0.3 to 1 | 2.8 to 1 | 0.7 to 1 |
| NET POSITION TREND: | |||
| – Strength Index Score (3 Year Range Pct): | 20.0 | 82.2 | 24.8 |
| – Strength Index Reading (3 Year Range): | Bearish-Extreme | Bullish-Extreme | Bearish |
| NET POSITION MOVEMENT INDEX: | |||
| – 6-Week Change in Strength Index: | 20.0 | -17.8 | 4.3 |
New Zealand Dollar Futures:
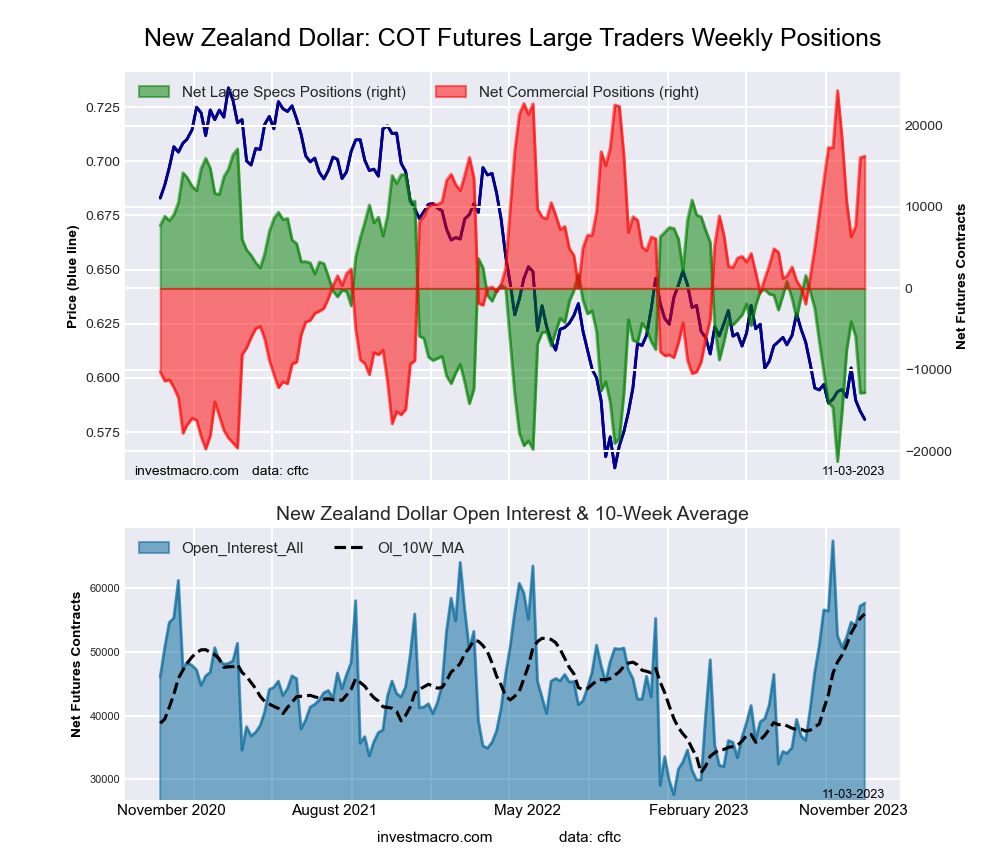 The New Zealand Dollar large speculator standing this week totaled a net position of -12,817 contracts in the data reported through Tuesday. This was a weekly increase of 34 contracts from the previous week which had a total of -12,851 net contracts.
This week’s current strength score (the trader positioning range over the past three years, measured from 0 to 100) shows the speculators are currently Bearish with a score of 22.0 percent. The commercials are Bullish-Extreme with a score of 81.7 percent and the small traders (not shown in chart) are Bearish-Extreme with a score of 9.3 percent.
Price Trend-Following Model: Downtrend
Our weekly trend-following model classifies the current market price position as: Downtrend. The current action for the model is considered to be: Hold – Maintain Short Position.
| NEW ZEALAND DOLLAR Statistics | SPECULATORS | COMMERCIALS | SMALL TRADERS |
| – Percent of Open Interest Longs: | 24.8 | 68.5 | 5.0 |
| – Percent of Open Interest Shorts: | 47.1 | 40.4 | 11.0 |
| – Net Position: | -12,817 | 16,236 | -3,419 |
| – Gross Longs: | 14,332 | 39,509 | 2,907 |
| – Gross Shorts: | 27,149 | 23,273 | 6,326 |
| – Long to Short Ratio: | 0.5 to 1 | 1.7 to 1 | 0.5 to 1 |
| NET POSITION TREND: | |||
| – Strength Index Score (3 Year Range Pct): | 22.0 | 81.7 | 9.3 |
| – Strength Index Reading (3 Year Range): | Bearish | Bullish-Extreme | Bearish-Extreme |
| NET POSITION MOVEMENT INDEX: | |||
| – 6-Week Change in Strength Index: | 22.0 | -18.3 | -4.6 |
Mexican Peso Futures:
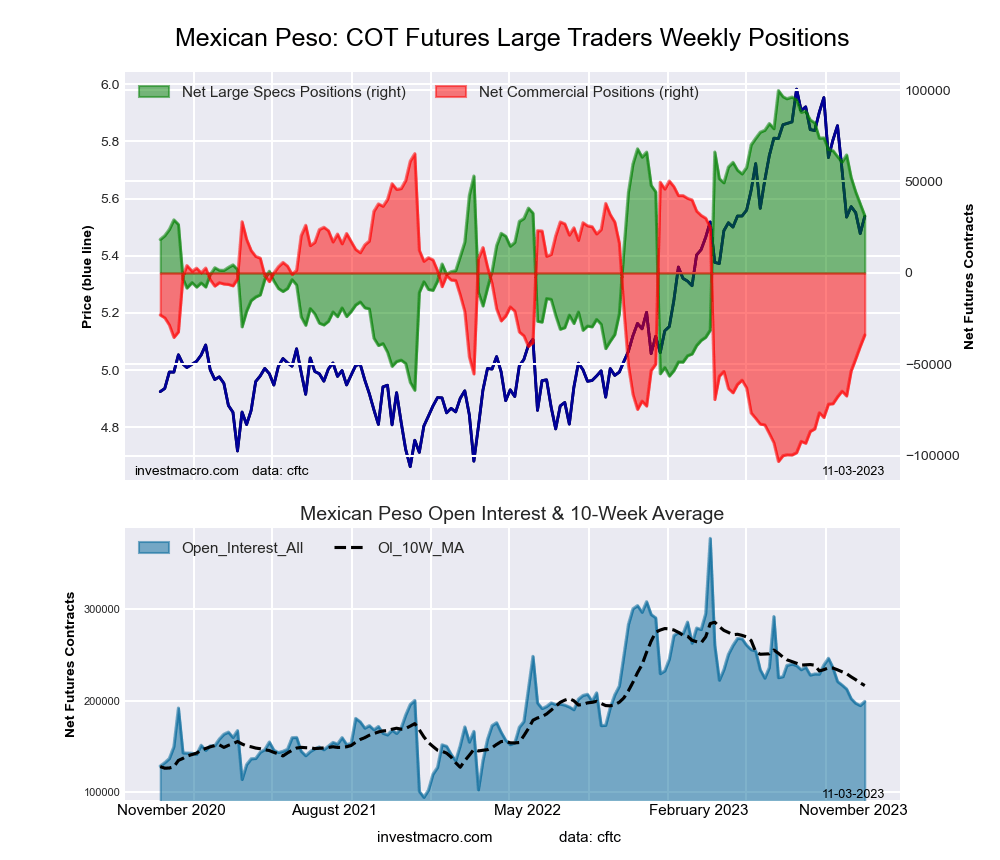 The Mexican Peso large speculator standing this week totaled a net position of 31,297 contracts in the data reported through Tuesday. This was a weekly decrease of -6,564 contracts from the previous week which had a total of 37,861 net contracts.
This week’s current strength score (the trader positioning range over the past three years, measured from 0 to 100) shows the speculators are currently Bullish with a score of 58.2 percent. The commercials are Bearish with a score of 41.1 percent and the small traders (not shown in chart) are Bearish with a score of 27.7 percent.
Price Trend-Following Model: Downtrend
Our weekly trend-following model classifies the current market price position as: Downtrend. The current action for the model is considered to be: Hold – Maintain Short Position.
| MEXICAN PESO Statistics | SPECULATORS | COMMERCIALS | SMALL TRADERS |
| – Percent of Open Interest Longs: | 28.9 | 68.0 | 2.9 |
| – Percent of Open Interest Shorts: | 13.1 | 85.0 | 1.6 |
| – Net Position: | 31,297 | -33,883 | 2,586 |
| – Gross Longs: | 57,470 | 135,287 | 5,745 |
| – Gross Shorts: | 26,173 | 169,170 | 3,159 |
| – Long to Short Ratio: | 2.2 to 1 | 0.8 to 1 | 1.8 to 1 |
| NET POSITION TREND: | |||
| – Strength Index Score (3 Year Range Pct): | 58.2 | 41.1 | 27.7 |
| – Strength Index Reading (3 Year Range): | Bullish | Bearish | Bearish |
| NET POSITION MOVEMENT INDEX: | |||
| – 6-Week Change in Strength Index: | -19.7 | 20.1 | -9.6 |
Brazilian Real Futures:
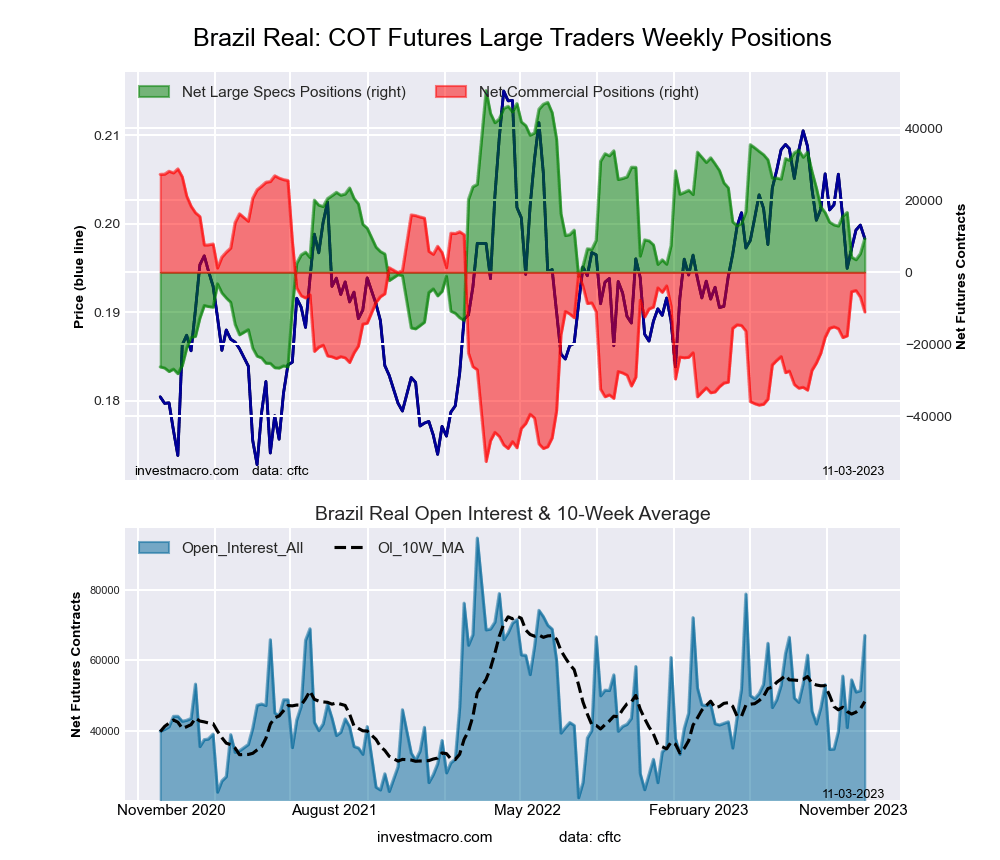 The Brazilian Real large speculator standing this week totaled a net position of 9,346 contracts in the data reported through Tuesday. This was a weekly increase of 4,161 contracts from the previous week which had a total of 5,185 net contracts.
This week’s current strength score (the trader positioning range over the past three years, measured from 0 to 100) shows the speculators are currently Bearish with a score of 46.6 percent. The commercials are Bullish with a score of 52.3 percent and the small traders (not shown in chart) are Bullish with a score of 50.1 percent.
Price Trend-Following Model: Weak Downtrend
Our weekly trend-following model classifies the current market price position as: Weak Downtrend. The current action for the model is considered to be: Hold – Maintain Short Position.
| BRAZIL REAL Statistics | SPECULATORS | COMMERCIALS | SMALL TRADERS |
| – Percent of Open Interest Longs: | 44.4 | 46.9 | 4.9 |
| – Percent of Open Interest Shorts: | 30.5 | 63.3 | 2.4 |
| – Net Position: | 9,346 | -11,022 | 1,676 |
| – Gross Longs: | 29,781 | 31,449 | 3,265 |
| – Gross Shorts: | 20,435 | 42,471 | 1,589 |
| – Long to Short Ratio: | 1.5 to 1 | 0.7 to 1 | 2.1 to 1 |
| NET POSITION TREND: | |||
| – Strength Index Score (3 Year Range Pct): | 46.6 | 52.3 | 50.1 |
| – Strength Index Reading (3 Year Range): | Bearish | Bullish | Bullish |
| NET POSITION MOVEMENT INDEX: | |||
| – 6-Week Change in Strength Index: | -4.5 | 5.9 | -10.6 |
Bitcoin Futures:
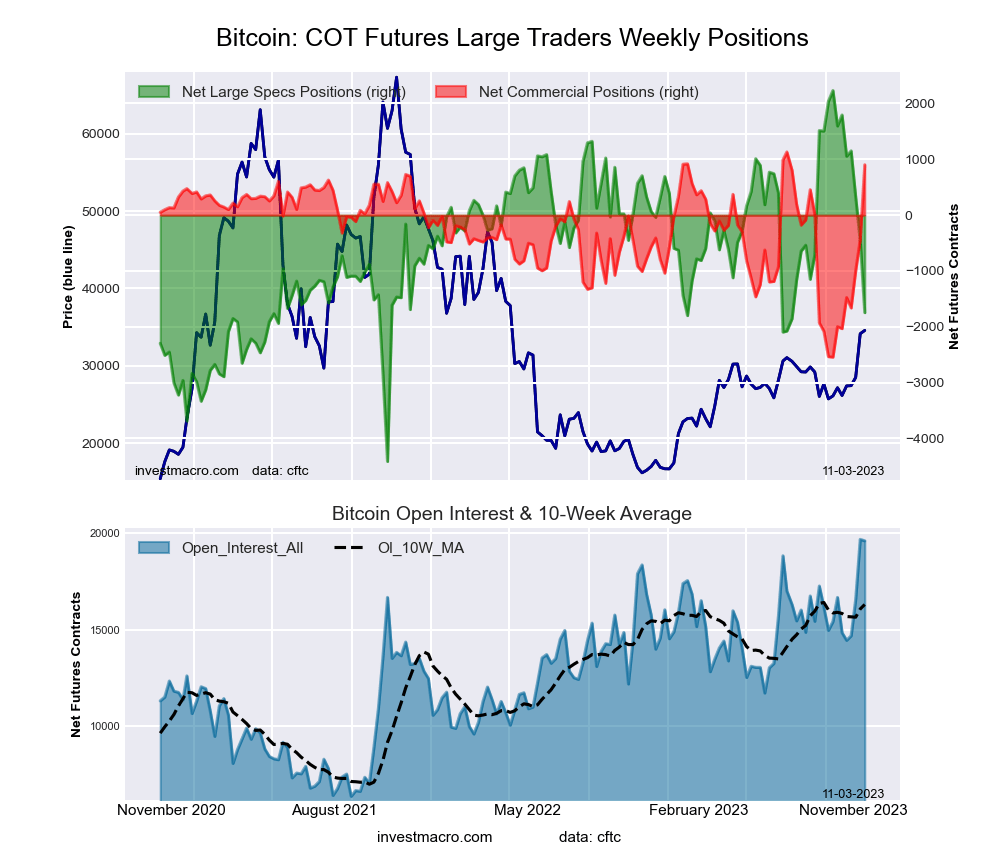 The Bitcoin large speculator standing this week totaled a net position of -1,746 contracts in the data reported through Tuesday. This was a weekly fall of -1,292 contracts from the previous week which had a total of -454 net contracts.
This week’s current strength score (the trader positioning range over the past three years, measured from 0 to 100) shows the speculators are currently Bearish with a score of 40.1 percent. The commercials are Bullish-Extreme with a score of 93.8 percent and the small traders (not shown in chart) are Bearish with a score of 32.1 percent.
Price Trend-Following Model: Strong Uptrend
Our weekly trend-following model classifies the current market price position as: Strong Uptrend. The current action for the model is considered to be: New Buy – Long Position.
| BITCOIN Statistics | SPECULATORS | COMMERCIALS | SMALL TRADERS |
| – Percent of Open Interest Longs: | 79.0 | 8.2 | 7.5 |
| – Percent of Open Interest Shorts: | 88.0 | 3.6 | 3.2 |
| – Net Position: | -1,746 | 903 | 843 |
| – Gross Longs: | 15,495 | 1,599 | 1,468 |
| – Gross Shorts: | 17,241 | 696 | 625 |
| – Long to Short Ratio: | 0.9 to 1 | 2.3 to 1 | 2.3 to 1 |
| NET POSITION TREND: | |||
| – Strength Index Score (3 Year Range Pct): | 40.1 | 93.8 | 32.1 |
| – Strength Index Reading (3 Year Range): | Bearish | Bullish-Extreme | Bearish |
| NET POSITION MOVEMENT INDEX: | |||
| – 6-Week Change in Strength Index: | -50.3 | 78.9 | 10.1 |
Article By InvestMacro – Receive our weekly COT Newsletter
*COT Report: The COT data, released weekly to the public each Friday, is updated through the most recent Tuesday (data is 3 days old) and shows a quick view of how large speculators or non-commercials (for-profit traders) were positioned in the futures markets.
The CFTC categorizes trader positions according to commercial hedgers (traders who use futures contracts for hedging as part of the business), non-commercials (large traders who speculate to realize trading profits) and nonreportable traders (usually small traders/speculators) as well as their open interest (contracts open in the market at time of reporting). See CFTC criteria here.


