
By InvestMacro
Here are the latest charts and statistics for the Commitment of Traders (COT) reports data published by the Commodities Futures Trading Commission (CFTC).
The latest COT data is updated through Tuesday February 27th and shows a quick view of how large traders (for-profit speculators and commercial hedgers) were positioned in the futures markets.
Weekly Speculator Changes led by 2-Year Bonds & US Treasury Bonds
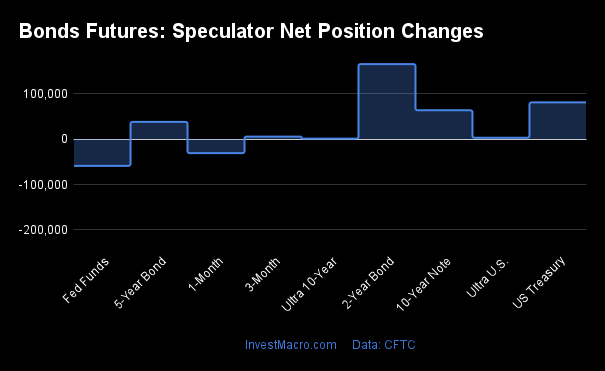
The COT bond market speculator bets were overall higher this week as seven out of the eight bond markets we cover had higher positioning while the other one markets had lower speculator contracts.
Free Reports:
 Get our Weekly Commitment of Traders Reports - See where the biggest traders (Hedge Funds and Commercial Hedgers) are positioned in the futures markets on a weekly basis.
 Download Our Metatrader 4 Indicators – Put Our Free MetaTrader 4 Custom Indicators on your charts when you join our Weekly Newsletter
Leading the gains for the bond markets was the 2-Year Bonds (165,226 contracts) with the US Treasury Bonds (80,756 contracts), the 10-Year Bonds (63,484 contracts), the 5-Year Bonds (37,907 contracts), the SOFR 3-Months (5,584 contracts), the Ultra Treasury Bonds (2,977 contracts) and the Ultra 10-Year Bonds (1,139 contracts) also having positive weeks.
The only market with a decline was the Fed Funds with a drop by -58,874 contracts for the week.
Bonds Net Speculators Leaderboard
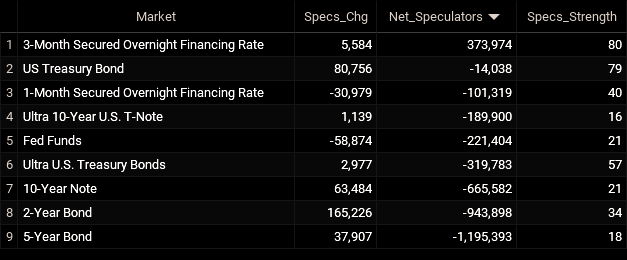
Legend: Weekly Speculators Change | Speculators Current Net Position | Speculators Strength Score compared to last 3-Years (0-100 range)
Strength Scores led by SOFR 3-Months & US Treasury Bonds
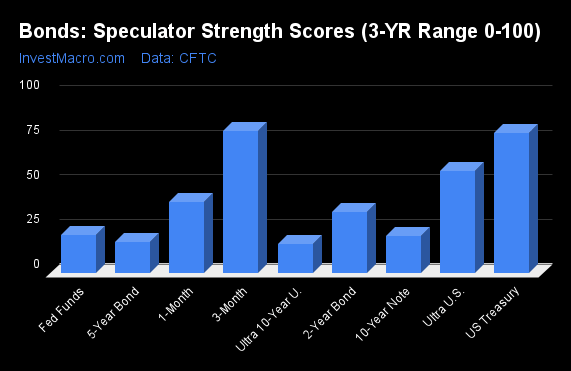
COT Strength Scores (a normalized measure of Speculator positions over a 3-Year range, from 0 to 100 where above 80 is Extreme-Bullish and below 20 is Extreme-Bearish) showed that the SOFR 3-Months (80 percent) and the US Treasury Bonds (79 percent) lead the bond markets this week. The Ultra Treasury Bonds (57 percent) comes in as the next highest in the weekly strength scores.
On the downside, the Ultra 10-Year Bonds (16 percent) and the 5-Year Bonds (17 percent) come in at the lowest strength level currently and are in Extreme-Bearish territory (below 20 percent). The next lowest strength scores were the 10-Year Bonds (21 percent) and the Fed Funds (21 percent).
Strength Statistics:
Fed Funds (21.3 percent) vs Fed Funds previous week (33.8 percent)
2-Year Bond (34.0 percent) vs 2-Year Bond previous week (23.5 percent)
5-Year Bond (17.5 percent) vs 5-Year Bond previous week (15.0 percent)
10-Year Bond (20.9 percent) vs 10-Year Bond previous week (15.0 percent)
Ultra 10-Year Bond (16.0 percent) vs Ultra 10-Year Bond previous week (15.8 percent)
US Treasury Bond (78.6 percent) vs US Treasury Bond previous week (50.5 percent)
Ultra US Treasury Bond (56.9 percent) vs Ultra US Treasury Bond previous week (55.7 percent)
SOFR 3-Months (79.6 percent) vs SOFR 3-Months previous week (79.3 percent)
US Treasury Bonds & 10-Year Bonds top the 6-Week Strength Trends
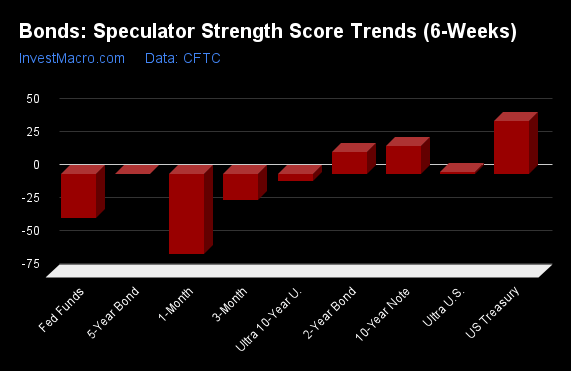
COT Strength Score Trends (or move index, calculates the 6-week changes in strength scores) showed that the US Treasury Bonds (40 percent) and the 10-Year Bonds (21 percent) lead the past six weeks trends for bonds. The 2-Year Bonds (17 percent) are the next highest positive mover in the latest trends data.
The Fed Funds (-33 percent) and the SOFR 3-Months (-19 percent) lead the downside trend scores currently with the Ultra 10-Year Bonds (-5 percent) following next with lower trend scores.
Strength Trend Statistics:
Fed Funds (-33.2 percent) vs Fed Funds previous week (-5.6 percent)
2-Year Bond (16.5 percent) vs 2-Year Bond previous week (8.3 percent)
5-Year Bond (0.1 percent) vs 5-Year Bond previous week (-4.0 percent)
10-Year Bond (20.9 percent) vs 10-Year Bond previous week (5.4 percent)
Ultra 10-Year Bond (-5.4 percent) vs Ultra 10-Year Bond previous week (-3.1 percent)
US Treasury Bond (39.6 percent) vs US Treasury Bond previous week (21.2 percent)
Ultra US Treasury Bond (1.2 percent) vs Ultra US Treasury Bond previous week (-4.0 percent)
SOFR 3-Months (-19.5 percent) vs SOFR 3-Months previous week (-16.4 percent)
Secured Overnight Financing Rate (3-Month) Futures:
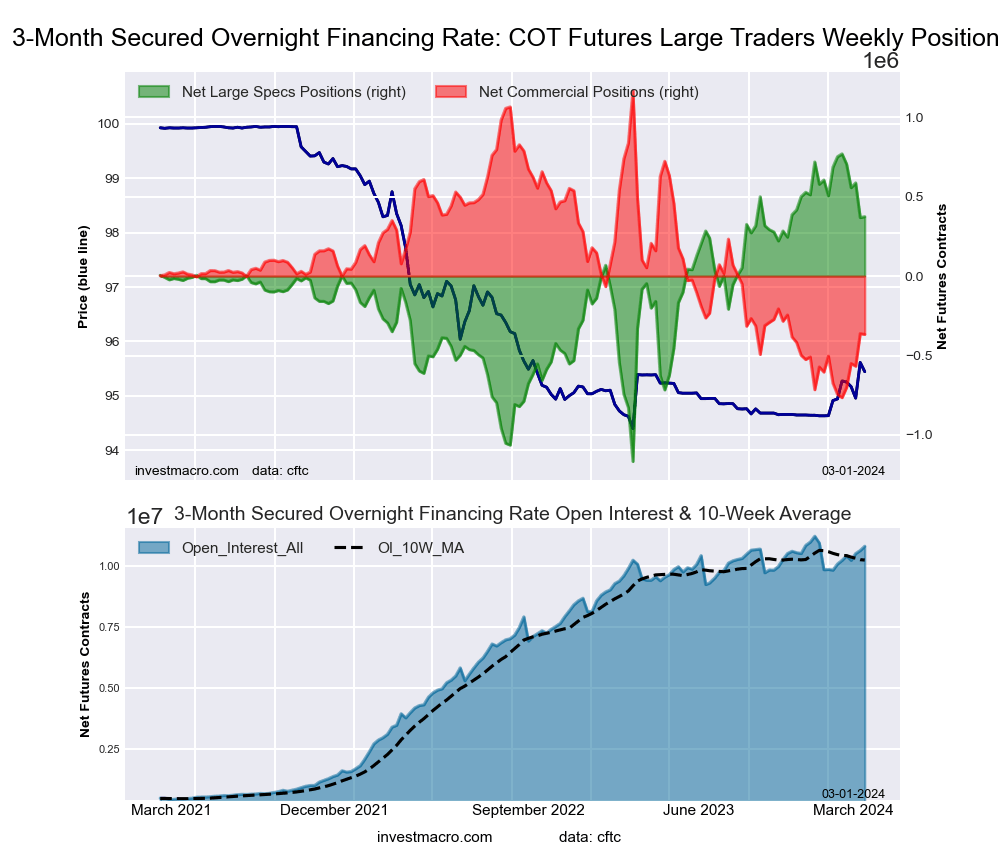 The Secured Overnight Financing Rate (3-Month) large speculator standing this week resulted in a net position of 373,974 contracts in the data reported through Tuesday. This was a weekly lift of 5,584 contracts from the previous week which had a total of 368,390 net contracts.
This week’s current strength score (the trader positioning range over the past three years, measured from 0 to 100) shows the speculators are currently Bullish with a score of 79.6 percent. The commercials are Bearish with a score of 20.6 percent and the small traders (not shown in chart) are Bullish-Extreme with a score of 84.0 percent.
Price Trend-Following Model: Weak Uptrend
Our weekly trend-following model classifies the current market price position as: Weak Uptrend. The current action for the model is considered to be: Hold – Maintain Long Position.
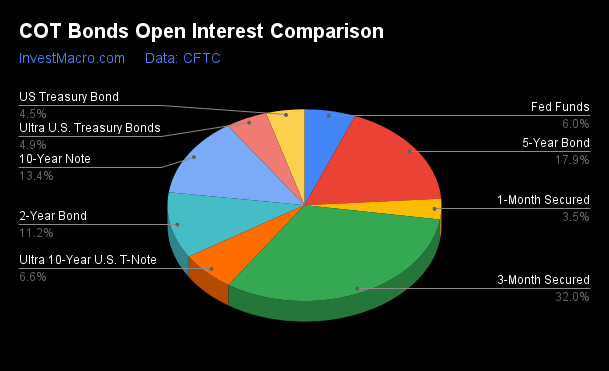
| SOFR 3-Months Statistics | SPECULATORS | COMMERCIALS | SMALL TRADERS |
| – Percent of Open Interest Longs: | 16.9 | 54.7 | 0.2 |
| – Percent of Open Interest Shorts: | 13.4 | 58.1 | 0.3 |
| – Net Position: | 373,974 | -366,966 | -7,008 |
| – Gross Longs: | 1,825,958 | 5,914,861 | 26,690 |
| – Gross Shorts: | 1,451,984 | 6,281,827 | 33,698 |
| – Long to Short Ratio: | 1.3 to 1 | 0.9 to 1 | 0.8 to 1 |
| NET POSITION TREND: | |||
| – Strength Index Score (3 Year Range Pct): | 79.6 | 20.6 | 84.0 |
| – Strength Index Reading (3 Year Range): | Bullish | Bearish | Bullish-Extreme |
| NET POSITION MOVEMENT INDEX: | |||
| – 6-Week Change in Strength Index: | -19.5 | 19.6 | -0.4 |
30-Day Federal Funds Futures:
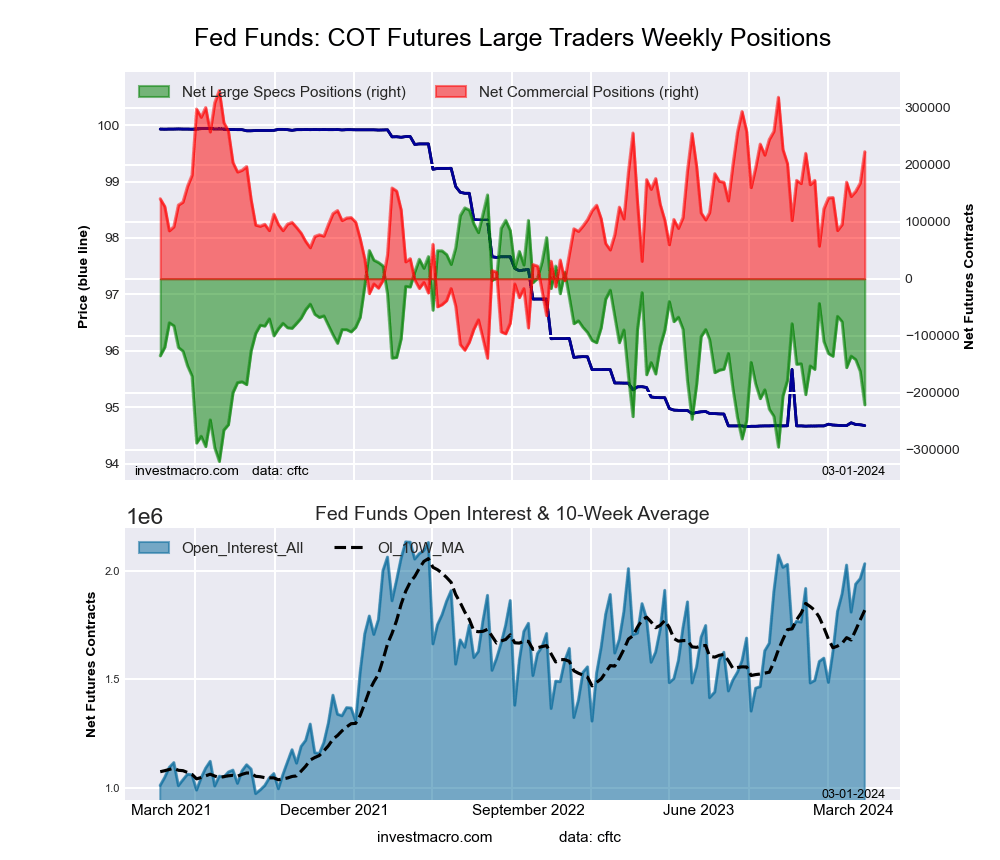 The 30-Day Federal Funds large speculator standing this week resulted in a net position of -221,404 contracts in the data reported through Tuesday. This was a weekly lowering of -58,874 contracts from the previous week which had a total of -162,530 net contracts.
This week’s current strength score (the trader positioning range over the past three years, measured from 0 to 100) shows the speculators are currently Bearish with a score of 21.3 percent. The commercials are Bullish with a score of 77.1 percent and the small traders (not shown in chart) are Bullish-Extreme with a score of 87.7 percent.
Price Trend-Following Model: Downtrend
Our weekly trend-following model classifies the current market price position as: Downtrend. The current action for the model is considered to be: Hold – Maintain Short Position.
| 30-Day Federal Funds Statistics | SPECULATORS | COMMERCIALS | SMALL TRADERS |
| – Percent of Open Interest Longs: | 13.0 | 70.3 | 1.7 |
| – Percent of Open Interest Shorts: | 23.9 | 59.3 | 1.8 |
| – Net Position: | -221,404 | 223,075 | -1,671 |
| – Gross Longs: | 264,244 | 1,427,609 | 34,288 |
| – Gross Shorts: | 485,648 | 1,204,534 | 35,959 |
| – Long to Short Ratio: | 0.5 to 1 | 1.2 to 1 | 1.0 to 1 |
| NET POSITION TREND: | |||
| – Strength Index Score (3 Year Range Pct): | 21.3 | 77.1 | 87.7 |
| – Strength Index Reading (3 Year Range): | Bearish | Bullish | Bullish-Extreme |
| NET POSITION MOVEMENT INDEX: | |||
| – 6-Week Change in Strength Index: | -33.2 | 29.4 | 33.2 |
2-Year Treasury Note Futures:
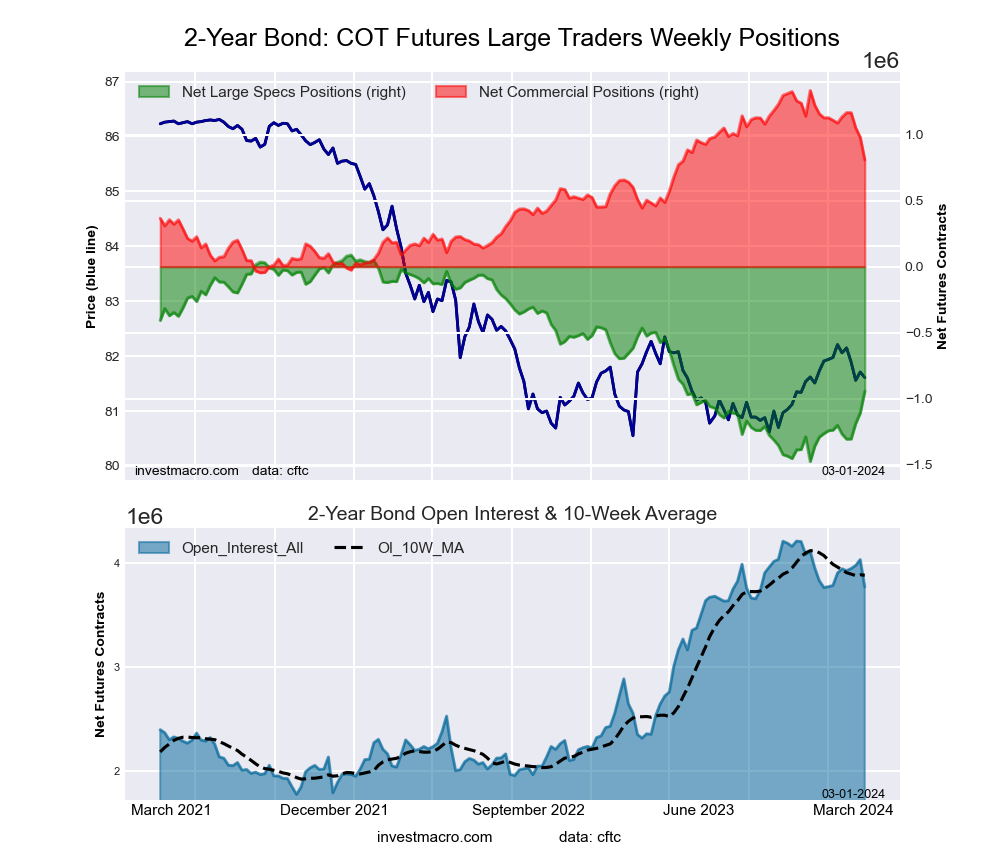 The 2-Year Treasury Note large speculator standing this week resulted in a net position of -943,898 contracts in the data reported through Tuesday. This was a weekly lift of 165,226 contracts from the previous week which had a total of -1,109,124 net contracts.
This week’s current strength score (the trader positioning range over the past three years, measured from 0 to 100) shows the speculators are currently Bearish with a score of 34.0 percent. The commercials are Bullish with a score of 62.0 percent and the small traders (not shown in chart) are Bullish-Extreme with a score of 95.0 percent.
Price Trend-Following Model: Uptrend
Our weekly trend-following model classifies the current market price position as: Uptrend. The current action for the model is considered to be: Hold – Maintain Long Position.
| 2-Year Treasury Note Statistics | SPECULATORS | COMMERCIALS | SMALL TRADERS |
| – Percent of Open Interest Longs: | 10.3 | 80.4 | 7.1 |
| – Percent of Open Interest Shorts: | 35.3 | 58.9 | 3.5 |
| – Net Position: | -943,898 | 809,780 | 134,118 |
| – Gross Longs: | 387,138 | 3,030,544 | 267,240 |
| – Gross Shorts: | 1,331,036 | 2,220,764 | 133,122 |
| – Long to Short Ratio: | 0.3 to 1 | 1.4 to 1 | 2.0 to 1 |
| NET POSITION TREND: | |||
| – Strength Index Score (3 Year Range Pct): | 34.0 | 62.0 | 95.0 |
| – Strength Index Reading (3 Year Range): | Bearish | Bullish | Bullish-Extreme |
| NET POSITION MOVEMENT INDEX: | |||
| – 6-Week Change in Strength Index: | 16.5 | -20.2 | 7.6 |
5-Year Treasury Note Futures:
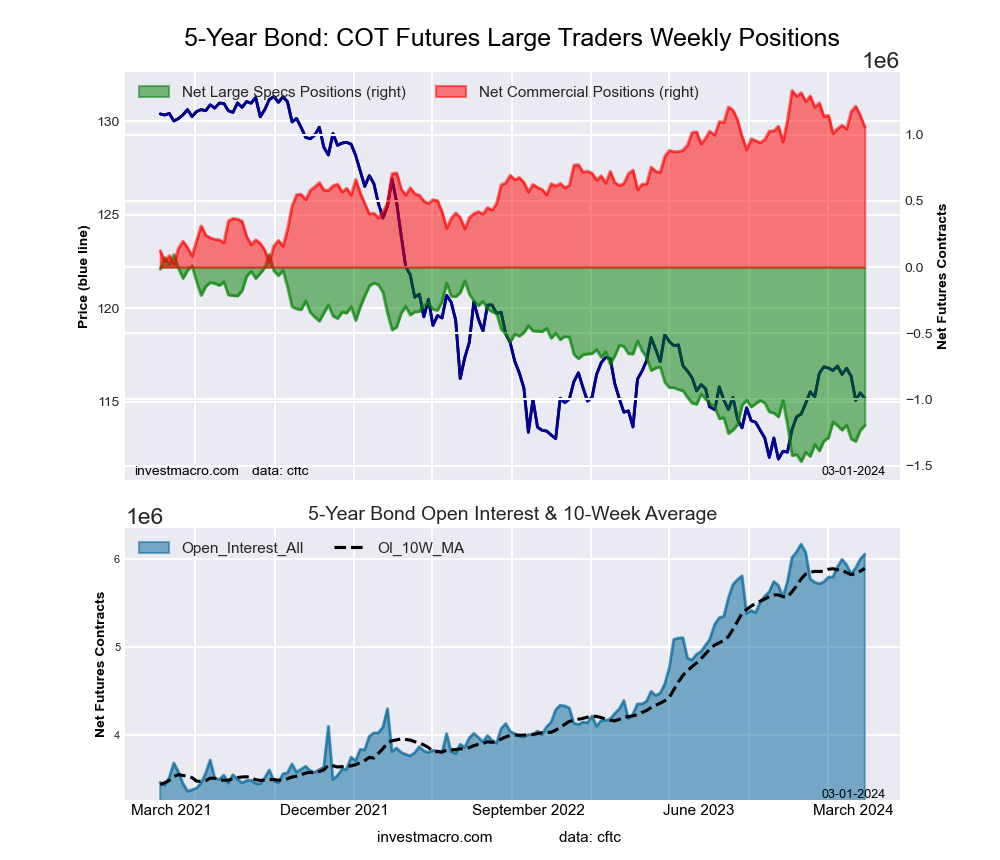 The 5-Year Treasury Note large speculator standing this week resulted in a net position of -1,195,393 contracts in the data reported through Tuesday. This was a weekly advance of 37,907 contracts from the previous week which had a total of -1,233,300 net contracts.
This week’s current strength score (the trader positioning range over the past three years, measured from 0 to 100) shows the speculators are currently Bearish-Extreme with a score of 17.5 percent. The commercials are Bullish with a score of 79.0 percent and the small traders (not shown in chart) are Bullish-Extreme with a score of 91.8 percent.
Price Trend-Following Model: Uptrend
Our weekly trend-following model classifies the current market price position as: Uptrend. The current action for the model is considered to be: Hold – Maintain Long Position.
| 5-Year Treasury Note Statistics | SPECULATORS | COMMERCIALS | SMALL TRADERS |
| – Percent of Open Interest Longs: | 6.3 | 83.8 | 7.1 |
| – Percent of Open Interest Shorts: | 26.0 | 66.3 | 4.8 |
| – Net Position: | -1,195,393 | 1,058,803 | 136,590 |
| – Gross Longs: | 382,396 | 5,074,656 | 428,067 |
| – Gross Shorts: | 1,577,789 | 4,015,853 | 291,477 |
| – Long to Short Ratio: | 0.2 to 1 | 1.3 to 1 | 1.5 to 1 |
| NET POSITION TREND: | |||
| – Strength Index Score (3 Year Range Pct): | 17.5 | 79.0 | 91.8 |
| – Strength Index Reading (3 Year Range): | Bearish-Extreme | Bullish | Bullish-Extreme |
| NET POSITION MOVEMENT INDEX: | |||
| – 6-Week Change in Strength Index: | 0.1 | 1.0 | -3.1 |
10-Year Treasury Note Futures:
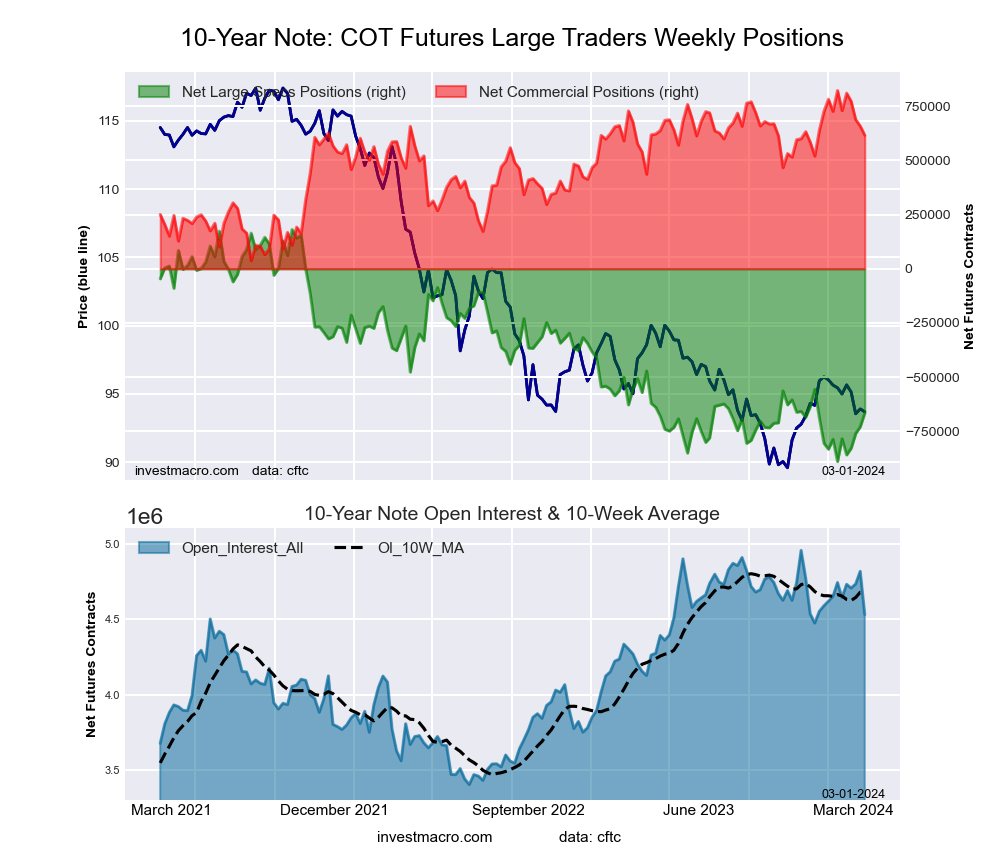 The 10-Year Treasury Note large speculator standing this week resulted in a net position of -665,582 contracts in the data reported through Tuesday. This was a weekly boost of 63,484 contracts from the previous week which had a total of -729,066 net contracts.
This week’s current strength score (the trader positioning range over the past three years, measured from 0 to 100) shows the speculators are currently Bearish with a score of 20.9 percent. The commercials are Bullish with a score of 73.7 percent and the small traders (not shown in chart) are Bullish-Extreme with a score of 84.2 percent.
Price Trend-Following Model: Uptrend
Our weekly trend-following model classifies the current market price position as: Uptrend. The current action for the model is considered to be: Hold – Maintain Long Position.
| 10-Year Treasury Note Statistics | SPECULATORS | COMMERCIALS | SMALL TRADERS |
| – Percent of Open Interest Longs: | 10.5 | 77.1 | 9.5 |
| – Percent of Open Interest Shorts: | 25.2 | 63.5 | 8.4 |
| – Net Position: | -665,582 | 616,385 | 49,197 |
| – Gross Longs: | 474,529 | 3,492,870 | 429,894 |
| – Gross Shorts: | 1,140,111 | 2,876,485 | 380,697 |
| – Long to Short Ratio: | 0.4 to 1 | 1.2 to 1 | 1.1 to 1 |
| NET POSITION TREND: | |||
| – Strength Index Score (3 Year Range Pct): | 20.9 | 73.7 | 84.2 |
| – Strength Index Reading (3 Year Range): | Bearish | Bullish | Bullish-Extreme |
| NET POSITION MOVEMENT INDEX: | |||
| – 6-Week Change in Strength Index: | 20.9 | -26.3 | -3.8 |
Ultra 10-Year Notes Futures:
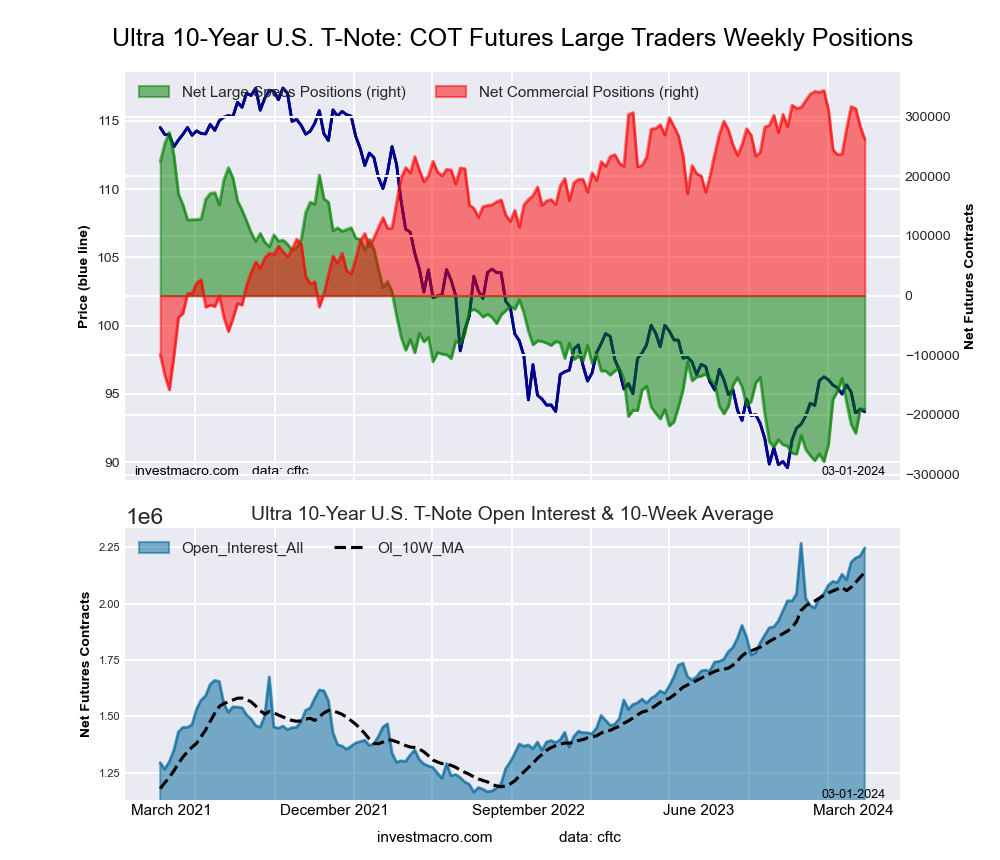 The Ultra 10-Year Notes large speculator standing this week resulted in a net position of -189,900 contracts in the data reported through Tuesday. This was a weekly gain of 1,139 contracts from the previous week which had a total of -191,039 net contracts.
This week’s current strength score (the trader positioning range over the past three years, measured from 0 to 100) shows the speculators are currently Bearish-Extreme with a score of 16.0 percent. The commercials are Bullish-Extreme with a score of 83.6 percent and the small traders (not shown in chart) are Bullish with a score of 71.3 percent.
Price Trend-Following Model: Weak Uptrend
Our weekly trend-following model classifies the current market price position as: Weak Uptrend. The current action for the model is considered to be: Hold – Maintain Long Position.
| Ultra 10-Year Notes Statistics | SPECULATORS | COMMERCIALS | SMALL TRADERS |
| – Percent of Open Interest Longs: | 12.5 | 75.5 | 9.4 |
| – Percent of Open Interest Shorts: | 21.0 | 63.8 | 12.6 |
| – Net Position: | -189,900 | 261,839 | -71,939 |
| – Gross Longs: | 281,655 | 1,696,545 | 210,640 |
| – Gross Shorts: | 471,555 | 1,434,706 | 282,579 |
| – Long to Short Ratio: | 0.6 to 1 | 1.2 to 1 | 0.7 to 1 |
| NET POSITION TREND: | |||
| – Strength Index Score (3 Year Range Pct): | 16.0 | 83.6 | 71.3 |
| – Strength Index Reading (3 Year Range): | Bearish-Extreme | Bullish-Extreme | Bullish |
| NET POSITION MOVEMENT INDEX: | |||
| – 6-Week Change in Strength Index: | -5.4 | 5.1 | 2.5 |
US Treasury Bonds Futures:
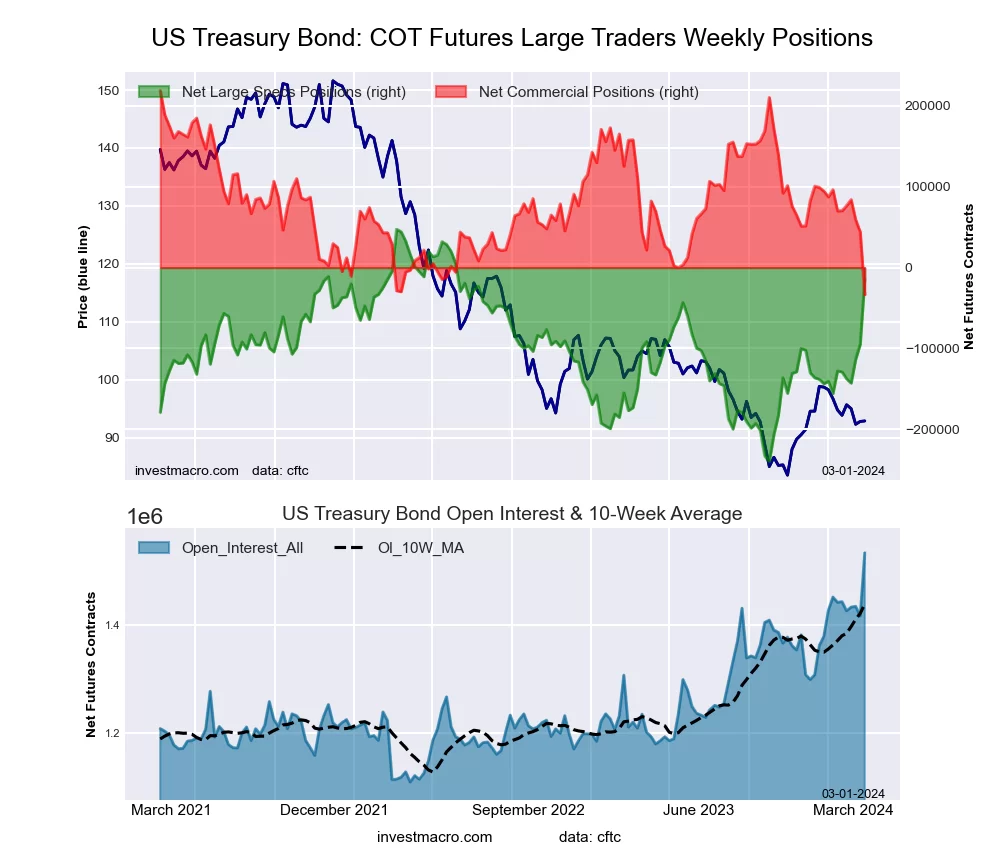 The US Treasury Bonds large speculator standing this week resulted in a net position of -14,038 contracts in the data reported through Tuesday. This was a weekly gain of 80,756 contracts from the previous week which had a total of -94,794 net contracts.
This week’s current strength score (the trader positioning range over the past three years, measured from 0 to 100) shows the speculators are currently Bullish with a score of 78.6 percent. The commercials are Bearish-Extreme with a score of 0.0 percent and the small traders (not shown in chart) are Bullish-Extreme with a score of 83.0 percent.
Price Trend-Following Model: Uptrend
Our weekly trend-following model classifies the current market price position as: Uptrend. The current action for the model is considered to be: Hold – Maintain Long Position.
| US Treasury Bonds Statistics | SPECULATORS | COMMERCIALS | SMALL TRADERS |
| – Percent of Open Interest Longs: | 15.5 | 66.2 | 13.1 |
| – Percent of Open Interest Shorts: | 16.4 | 68.4 | 10.0 |
| – Net Position: | -14,038 | -33,382 | 47,420 |
| – Gross Longs: | 237,978 | 1,015,447 | 201,594 |
| – Gross Shorts: | 252,016 | 1,048,829 | 154,174 |
| – Long to Short Ratio: | 0.9 to 1 | 1.0 to 1 | 1.3 to 1 |
| NET POSITION TREND: | |||
| – Strength Index Score (3 Year Range Pct): | 78.6 | 0.0 | 83.0 |
| – Strength Index Reading (3 Year Range): | Bullish | Bearish-Extreme | Bullish-Extreme |
| NET POSITION MOVEMENT INDEX: | |||
| – 6-Week Change in Strength Index: | 39.6 | -41.0 | -7.4 |
Ultra US Treasury Bonds Futures:
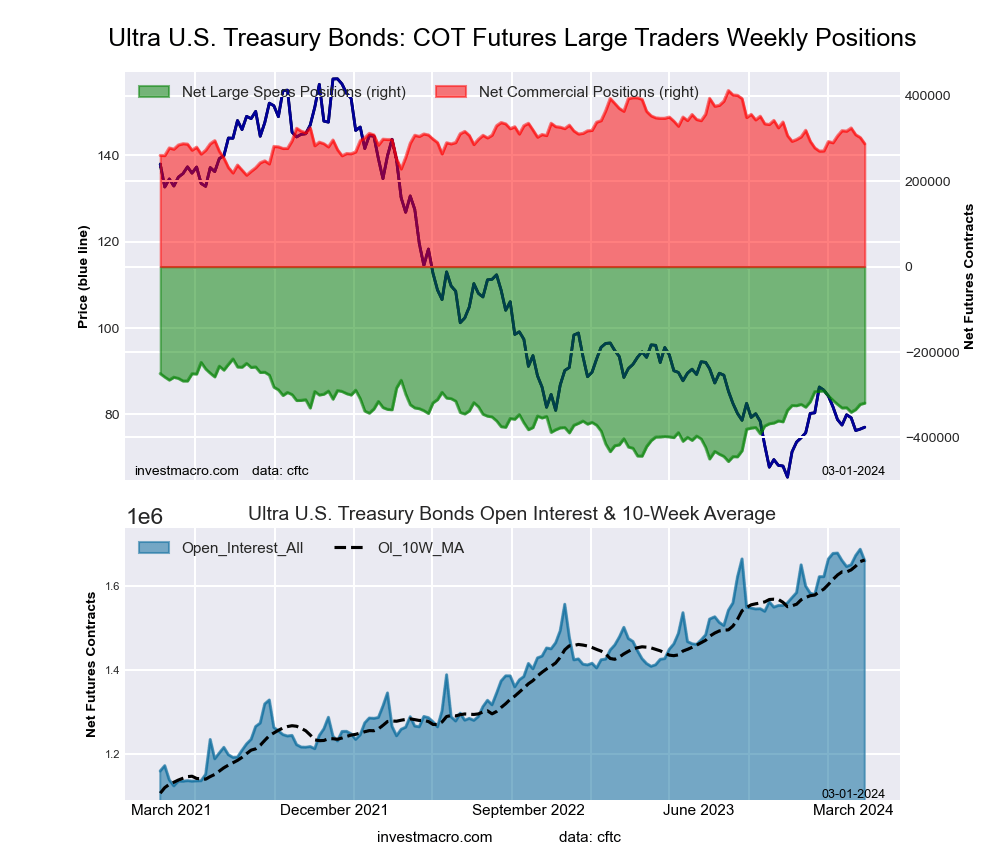 The Ultra US Treasury Bonds large speculator standing this week resulted in a net position of -319,783 contracts in the data reported through Tuesday. This was a weekly lift of 2,977 contracts from the previous week which had a total of -322,760 net contracts.
This week’s current strength score (the trader positioning range over the past three years, measured from 0 to 100) shows the speculators are currently Bullish with a score of 56.9 percent. The commercials are Bearish with a score of 37.1 percent and the small traders (not shown in chart) are Bullish with a score of 67.4 percent.
Price Trend-Following Model: Uptrend
Our weekly trend-following model classifies the current market price position as: Uptrend. The current action for the model is considered to be: Hold – Maintain Long Position.
| Ultra US Treasury Bonds Statistics | SPECULATORS | COMMERCIALS | SMALL TRADERS |
| – Percent of Open Interest Longs: | 8.8 | 77.5 | 10.8 |
| – Percent of Open Interest Shorts: | 28.1 | 60.2 | 8.9 |
| – Net Position: | -319,783 | 287,818 | 31,965 |
| – Gross Longs: | 146,336 | 1,287,850 | 179,326 |
| – Gross Shorts: | 466,119 | 1,000,032 | 147,361 |
| – Long to Short Ratio: | 0.3 to 1 | 1.3 to 1 | 1.2 to 1 |
| NET POSITION TREND: | |||
| – Strength Index Score (3 Year Range Pct): | 56.9 | 37.1 | 67.4 |
| – Strength Index Reading (3 Year Range): | Bullish | Bearish | Bullish |
| NET POSITION MOVEMENT INDEX: | |||
| – 6-Week Change in Strength Index: | 1.2 | -9.2 | 14.6 |
Article By InvestMacro – Receive our weekly COT Newsletter
*COT Report: The COT data, released weekly to the public each Friday, is updated through the most recent Tuesday (data is 3 days old) and shows a quick view of how large speculators or non-commercials (for-profit traders) were positioned in the futures markets.
The CFTC categorizes trader positions according to commercial hedgers (traders who use futures contracts for hedging as part of the business), non-commercials (large traders who speculate to realize trading profits) and nonreportable traders (usually small traders/speculators) as well as their open interest (contracts open in the market at time of reporting). See CFTC criteria here.

- Geopolitical and macroeconomic conditions continue to pressure market sentiment Jul 20, 2026
- USD/JPY Poised to Continue Gains as Expensive Oil and Lack of Support Weigh on Yen Jul 20, 2026
- COT Metals Charts: Weekly Speculator Bets led by Copper & Steel Jul 18, 2026
- COT Bonds Charts: Weekly Speculator Bets led by 2-Year, SOFR 3M & 5-Year Bonds Jul 18, 2026
- COT Energy Charts: Weekly Speculator Bets led by Brent Oil & Heating Oil Jul 18, 2026
- COT Soft Commodities Charts: Weekly Speculator Bets led by Wheat, Corn & Soybean Meal Jul 18, 2026
- The Bank of Canada kept its interest rate unchanged. Platinum prices reached a three‑week high Jul 16, 2026
- Stock indices rose after the release of US inflation data. China’s GDP slowed sharply Jul 15, 2026
- GBP/USD Awaits Political News: What Will Happen Next Jul 15, 2026
- USD/JPY Holds at Highs: Pressure Lingers on Yen Jul 14, 2026