
By InvestMacro
Here are the latest charts and statistics for the Commitment of Traders (COT) data published by the Commodities Futures Trading Commission (CFTC).
The latest COT data is updated through Tuesday February 20th and shows a quick view of how large traders (for-profit speculators and commercial entities) were positioned in the futures markets.
Weekly Speculator Changes led by VIX & Russell-Mini
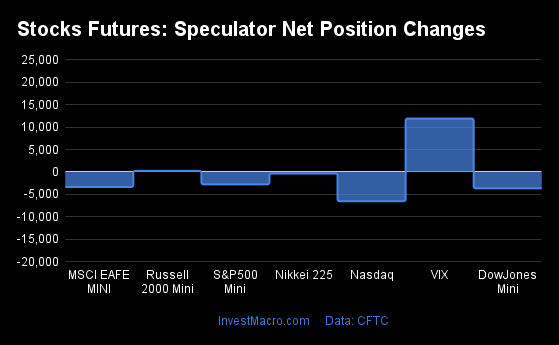
The COT stock markets speculator bets were lower this week as just two out of the seven stock markets we cover had higher positioning while the other five markets had lower speculator contracts.
Free Reports:
 Sign Up for Our Stock Market Newsletter – Get updated on News, Charts & Rankings of Public Companies when you join our Stocks Newsletter
 Get our Weekly Commitment of Traders Reports - See where the biggest traders (Hedge Funds and Commercial Hedgers) are positioned in the futures markets on a weekly basis.
Leading the gains for the stock markets was the VIX (11,895 contracts) with the Russell-Mini (246 contracts) also showing a small positive week.
The markets with the declines in speculator bets this week were the Nasdaq-Mini (-6,515 contracts), the DowJones-Mini (-3,641 contracts), the S&P500-Mini (-2,752 contracts), the MSCI EAFE-Mini (-3,346 contracts) and the Nikkei 225 (-332 contracts).
Stock Net Speculators Leaderboard
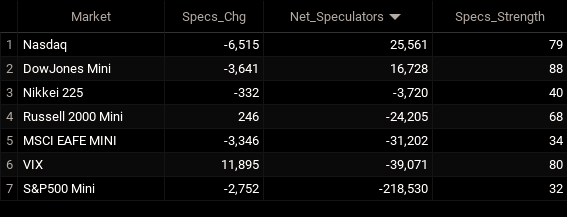
Legend: Weekly Speculators Change | Speculators Current Net Position | Speculators Strength Score compared to last 3-Years (0-100 range)
Strength Scores led by DowJones-Mini & VIX
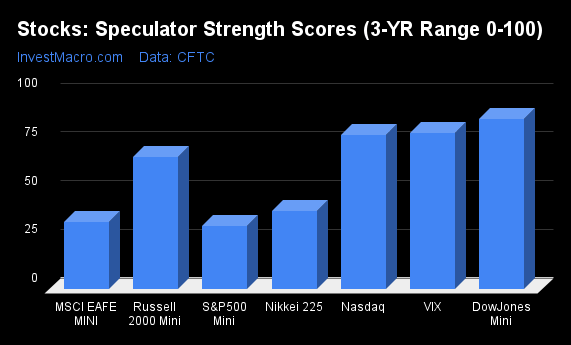
COT Strength Scores (a normalized measure of Speculator positions over a 3-Year range, from 0 to 100 where above 80 is Extreme-Bullish and below 20 is Extreme-Bearish) showed that the DowJones-Mini (88 percent) and the VIX (80 percent) lead the stock markets this week. The Nasdaq-Mini (79 percent) and Russell-Mini (68 percent) come in as the next highest in the weekly strength scores.
On the downside, the S&P500-Mini (32 percent) comes in at the lowest strength level currently followed by the MSCI EAFE-Mini at 34 percent.
Strength Statistics:
VIX (79.9 percent) vs VIX previous week (70.4 percent)
S&P500-Mini (32.2 percent) vs S&P500-Mini previous week (32.6 percent)
DowJones-Mini (87.5 percent) vs DowJones-Mini previous week (93.4 percent)
Nasdaq-Mini (78.8 percent) vs Nasdaq-Mini previous week (88.9 percent)
Russell2000-Mini (67.9 percent) vs Russell2000-Mini previous week (67.7 percent)
Nikkei USD (40.2 percent) vs Nikkei USD previous week (42.5 percent)
EAFE-Mini (34.1 percent) vs EAFE-Mini previous week (37.6 percent)
VIX & MSCI EAFE-Mini top the 6-Week Strength Trends
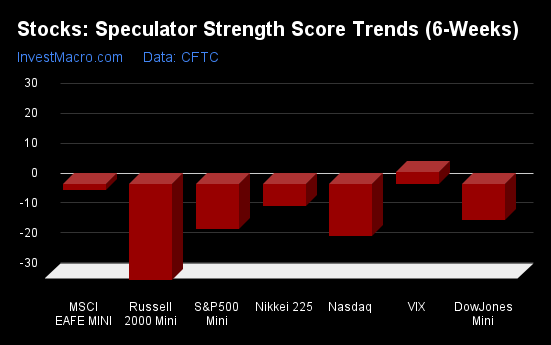
COT Strength Score Trends (or move index, calculates the 6-week changes in strength scores) showed that the VIX (4 percent) leads the past six weeks trends and is the only positive mover for the stock markets this week.
The Russell-Mini (-32 percent) leads the downside trend scores currently with the Nasdaq-Mini (-17 percent) coming in as the next lowest market for trend scores.
Strength Trend Statistics:
VIX (4.1 percent) vs VIX previous week (-4.8 percent)
S&P500-Mini (-15.1 percent) vs S&P500-Mini previous week (-0.3 percent)
DowJones-Mini (-12.0 percent) vs DowJones-Mini previous week (1.3 percent)
Nasdaq-Mini (-17.4 percent) vs Nasdaq-Mini previous week (-10.8 percent)
Russell2000-Mini (-32.1 percent) vs Russell2000-Mini previous week (-16.7 percent)
Nikkei USD (-7.5 percent) vs Nikkei USD previous week (0.2 percent)
EAFE-Mini (-2.1 percent) vs EAFE-Mini previous week (9.2 percent)
Individual Stock Market Charts:
VIX Volatility Futures:
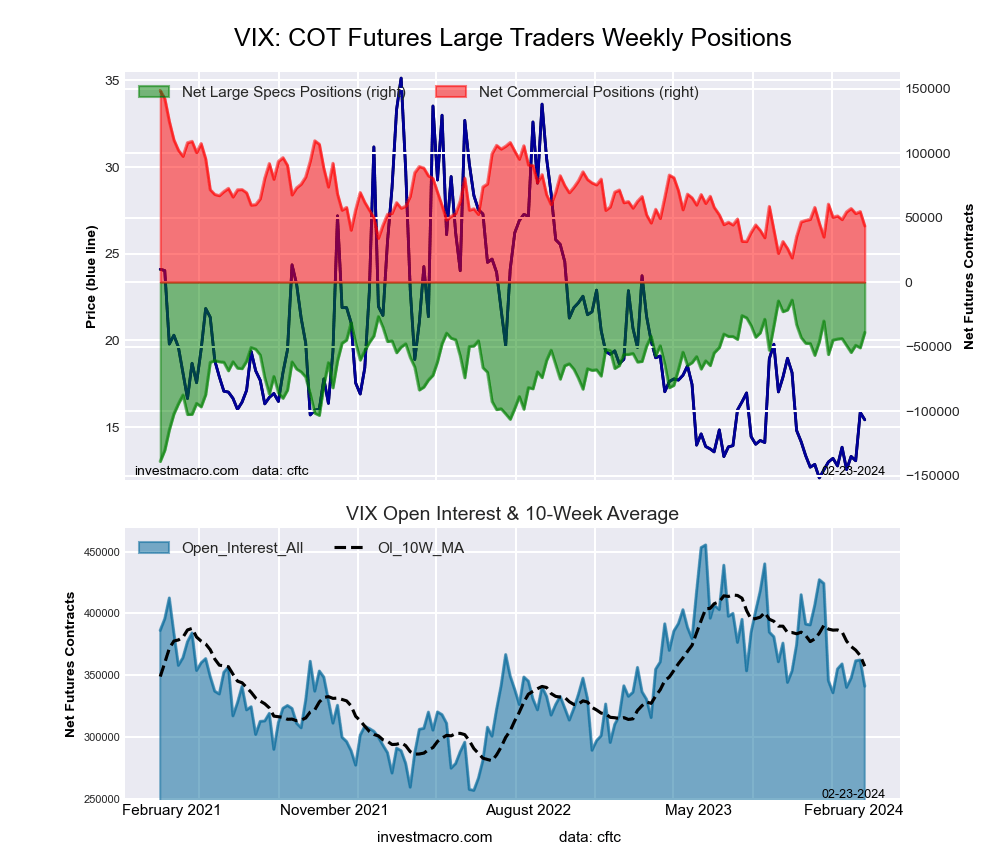 The VIX Volatility large speculator standing this week equaled a net position of -39,071 contracts in the data reported through Tuesday. This was a weekly advance of 11,895 contracts from the previous week which had a total of -50,966 net contracts.
This week’s current strength score (the trader positioning range over the past three years, measured from 0 to 100) shows the speculators are currently Bullish with a score of 79.9 percent. The commercials are Bearish-Extreme with a score of 19.1 percent and the small traders (not shown in chart) are Bullish with a score of 73.9 percent.
Price Trend-Following Model: Weak Downtrend
Our weekly trend-following model classifies the current market price position as: Weak Downtrend. The current action for the model is considered to be: Hold – Maintain Short Position.
| VIX Volatility Futures Statistics | SPECULATORS | COMMERCIALS | SMALL TRADERS |
| – Percent of Open Interest Longs: | 21.9 | 44.8 | 7.5 |
| – Percent of Open Interest Shorts: | 33.3 | 32.0 | 8.8 |
| – Net Position: | -39,071 | 43,488 | -4,417 |
| – Gross Longs: | 74,671 | 152,747 | 25,470 |
| – Gross Shorts: | 113,742 | 109,259 | 29,887 |
| – Long to Short Ratio: | 0.7 to 1 | 1.4 to 1 | 0.9 to 1 |
| NET POSITION TREND: | |||
| – Strength Index Score (3 Year Range Pct): | 79.9 | 19.1 | 73.9 |
| – Strength Index Reading (3 Year Range): | Bullish | Bearish-Extreme | Bullish |
| NET POSITION MOVEMENT INDEX: | |||
| – 6-Week Change in Strength Index: | 4.1 | -6.0 | 13.6 |
S&P500 Mini Futures:
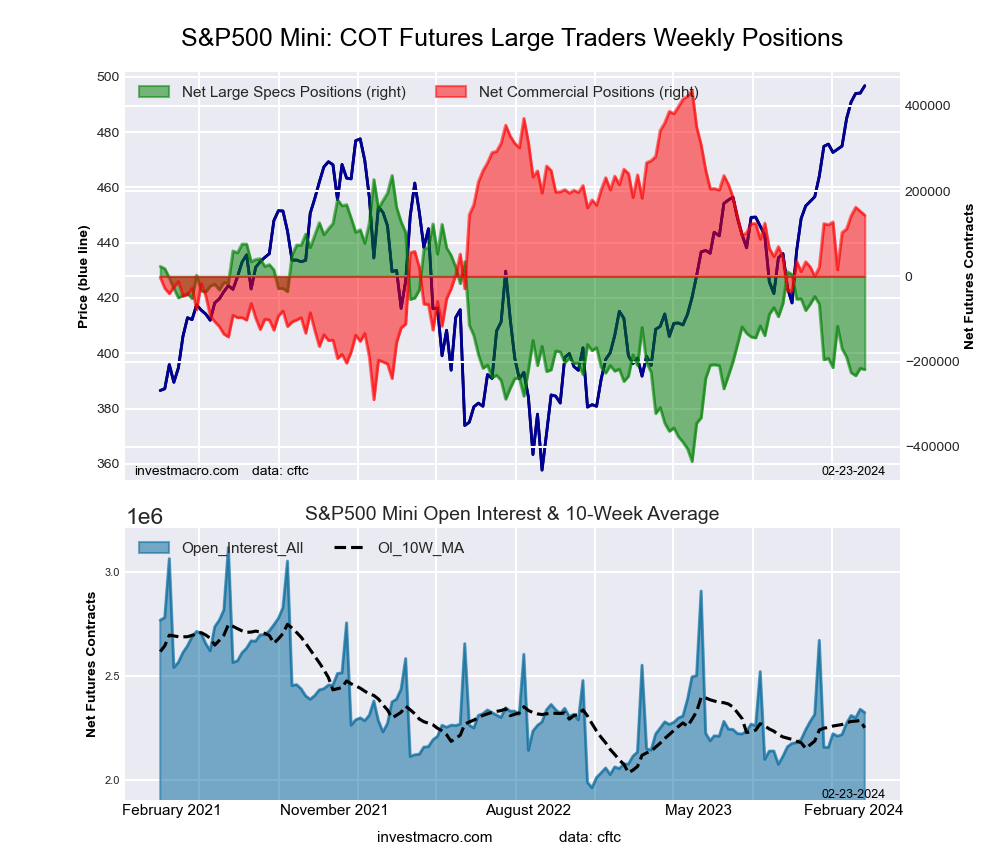 The S&P500 Mini large speculator standing this week equaled a net position of -218,530 contracts in the data reported through Tuesday. This was a weekly lowering of -2,752 contracts from the previous week which had a total of -215,778 net contracts.
This week’s current strength score (the trader positioning range over the past three years, measured from 0 to 100) shows the speculators are currently Bearish with a score of 32.2 percent. The commercials are Bullish with a score of 59.7 percent and the small traders (not shown in chart) are Bullish with a score of 67.0 percent.
Price Trend-Following Model: Strong Uptrend
Our weekly trend-following model classifies the current market price position as: Strong Uptrend. The current action for the model is considered to be: Hold – Maintain Long Position.
| S&P500 Mini Futures Statistics | SPECULATORS | COMMERCIALS | SMALL TRADERS |
| – Percent of Open Interest Longs: | 11.7 | 74.1 | 11.3 |
| – Percent of Open Interest Shorts: | 21.1 | 68.0 | 8.0 |
| – Net Position: | -218,530 | 143,353 | 75,177 |
| – Gross Longs: | 271,870 | 1,722,121 | 262,112 |
| – Gross Shorts: | 490,400 | 1,578,768 | 186,935 |
| – Long to Short Ratio: | 0.6 to 1 | 1.1 to 1 | 1.4 to 1 |
| NET POSITION TREND: | |||
| – Strength Index Score (3 Year Range Pct): | 32.2 | 59.7 | 67.0 |
| – Strength Index Reading (3 Year Range): | Bearish | Bullish | Bullish |
| NET POSITION MOVEMENT INDEX: | |||
| – 6-Week Change in Strength Index: | -15.1 | 17.6 | -10.4 |
Dow Jones Mini Futures:
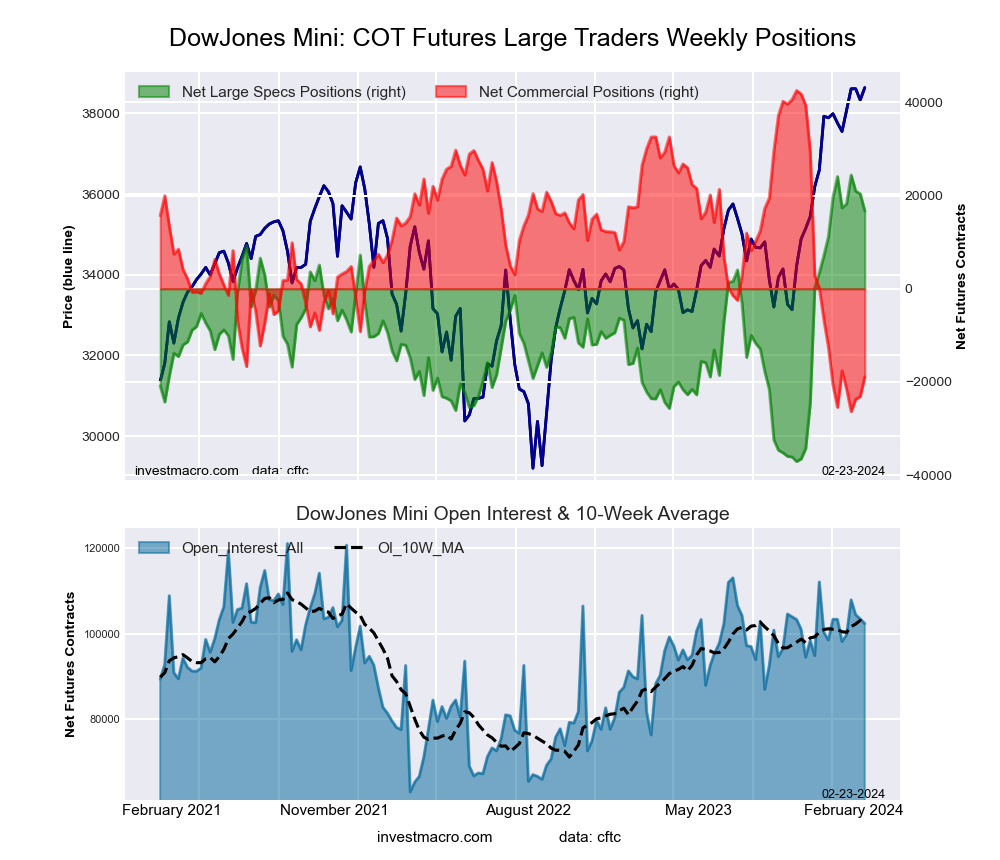 The Dow Jones Mini large speculator standing this week equaled a net position of 16,728 contracts in the data reported through Tuesday. This was a weekly decrease of -3,641 contracts from the previous week which had a total of 20,369 net contracts.
This week’s current strength score (the trader positioning range over the past three years, measured from 0 to 100) shows the speculators are currently Bullish-Extreme with a score of 87.5 percent. The commercials are Bearish-Extreme with a score of 10.8 percent and the small traders (not shown in chart) are Bullish with a score of 54.5 percent.
Price Trend-Following Model: Uptrend
Our weekly trend-following model classifies the current market price position as: Uptrend. The current action for the model is considered to be: Hold – Maintain Long Position.
| Dow Jones Mini Futures Statistics | SPECULATORS | COMMERCIALS | SMALL TRADERS |
| – Percent of Open Interest Longs: | 31.5 | 52.3 | 14.4 |
| – Percent of Open Interest Shorts: | 15.2 | 70.8 | 12.3 |
| – Net Position: | 16,728 | -18,898 | 2,170 |
| – Gross Longs: | 32,293 | 53,584 | 14,754 |
| – Gross Shorts: | 15,565 | 72,482 | 12,584 |
| – Long to Short Ratio: | 2.1 to 1 | 0.7 to 1 | 1.2 to 1 |
| NET POSITION TREND: | |||
| – Strength Index Score (3 Year Range Pct): | 87.5 | 10.8 | 54.5 |
| – Strength Index Reading (3 Year Range): | Bullish-Extreme | Bearish-Extreme | Bullish |
| NET POSITION MOVEMENT INDEX: | |||
| – 6-Week Change in Strength Index: | -12.0 | 9.5 | 4.0 |
Nasdaq Mini Futures:
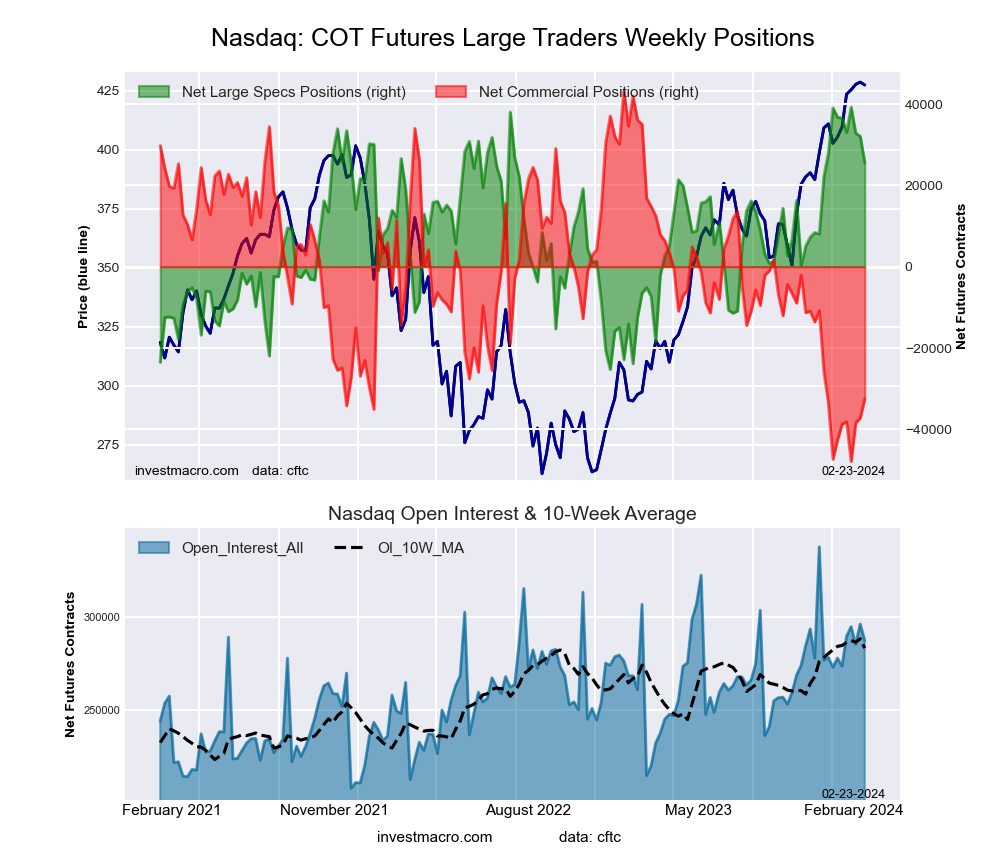 The Nasdaq Mini large speculator standing this week equaled a net position of 25,561 contracts in the data reported through Tuesday. This was a weekly reduction of -6,515 contracts from the previous week which had a total of 32,076 net contracts.
This week’s current strength score (the trader positioning range over the past three years, measured from 0 to 100) shows the speculators are currently Bullish with a score of 78.8 percent. The commercials are Bearish-Extreme with a score of 16.9 percent and the small traders (not shown in chart) are Bullish-Extreme with a score of 95.2 percent.
Price Trend-Following Model: Uptrend
Our weekly trend-following model classifies the current market price position as: Uptrend. The current action for the model is considered to be: Hold – Maintain Long Position.
| Nasdaq Mini Futures Statistics | SPECULATORS | COMMERCIALS | SMALL TRADERS |
| – Percent of Open Interest Longs: | 32.2 | 51.8 | 14.8 |
| – Percent of Open Interest Shorts: | 23.3 | 63.0 | 12.4 |
| – Net Position: | 25,561 | -32,432 | 6,871 |
| – Gross Longs: | 92,445 | 148,596 | 42,460 |
| – Gross Shorts: | 66,884 | 181,028 | 35,589 |
| – Long to Short Ratio: | 1.4 to 1 | 0.8 to 1 | 1.2 to 1 |
| NET POSITION TREND: | |||
| – Strength Index Score (3 Year Range Pct): | 78.8 | 16.9 | 95.2 |
| – Strength Index Reading (3 Year Range): | Bullish | Bearish-Extreme | Bullish-Extreme |
| NET POSITION MOVEMENT INDEX: | |||
| – 6-Week Change in Strength Index: | -17.4 | 11.1 | 2.8 |
Russell 2000 Mini Futures:
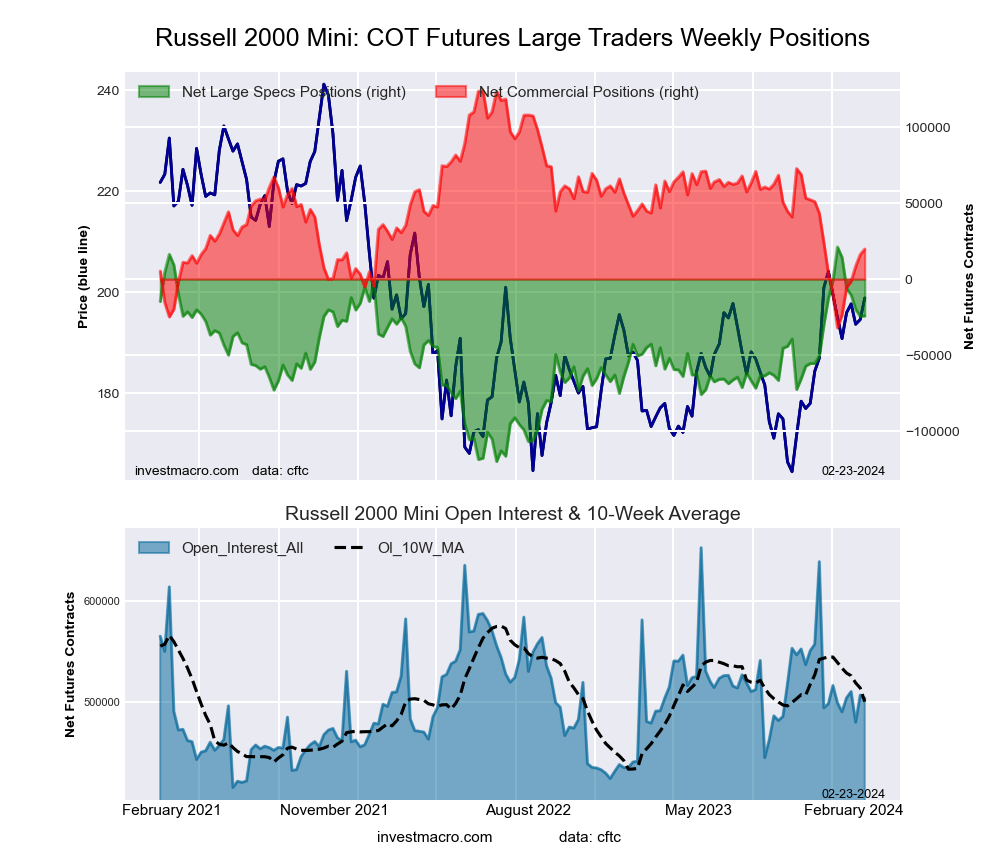 The Russell 2000 Mini large speculator standing this week equaled a net position of -24,205 contracts in the data reported through Tuesday. This was a weekly advance of 246 contracts from the previous week which had a total of -24,451 net contracts.
This week’s current strength score (the trader positioning range over the past three years, measured from 0 to 100) shows the speculators are currently Bullish with a score of 67.9 percent. The commercials are Bearish with a score of 33.1 percent and the small traders (not shown in chart) are Bearish with a score of 44.1 percent.
Price Trend-Following Model: Uptrend
Our weekly trend-following model classifies the current market price position as: Uptrend. The current action for the model is considered to be: Hold – Maintain Long Position.
| Russell 2000 Mini Futures Statistics | SPECULATORS | COMMERCIALS | SMALL TRADERS |
| – Percent of Open Interest Longs: | 11.7 | 81.0 | 6.1 |
| – Percent of Open Interest Shorts: | 16.5 | 77.1 | 5.2 |
| – Net Position: | -24,205 | 19,727 | 4,478 |
| – Gross Longs: | 59,033 | 407,623 | 30,904 |
| – Gross Shorts: | 83,238 | 387,896 | 26,426 |
| – Long to Short Ratio: | 0.7 to 1 | 1.1 to 1 | 1.2 to 1 |
| NET POSITION TREND: | |||
| – Strength Index Score (3 Year Range Pct): | 67.9 | 33.1 | 44.1 |
| – Strength Index Reading (3 Year Range): | Bullish | Bearish | Bearish |
| NET POSITION MOVEMENT INDEX: | |||
| – 6-Week Change in Strength Index: | -32.1 | 33.1 | -21.9 |
Nikkei Stock Average (USD) Futures:
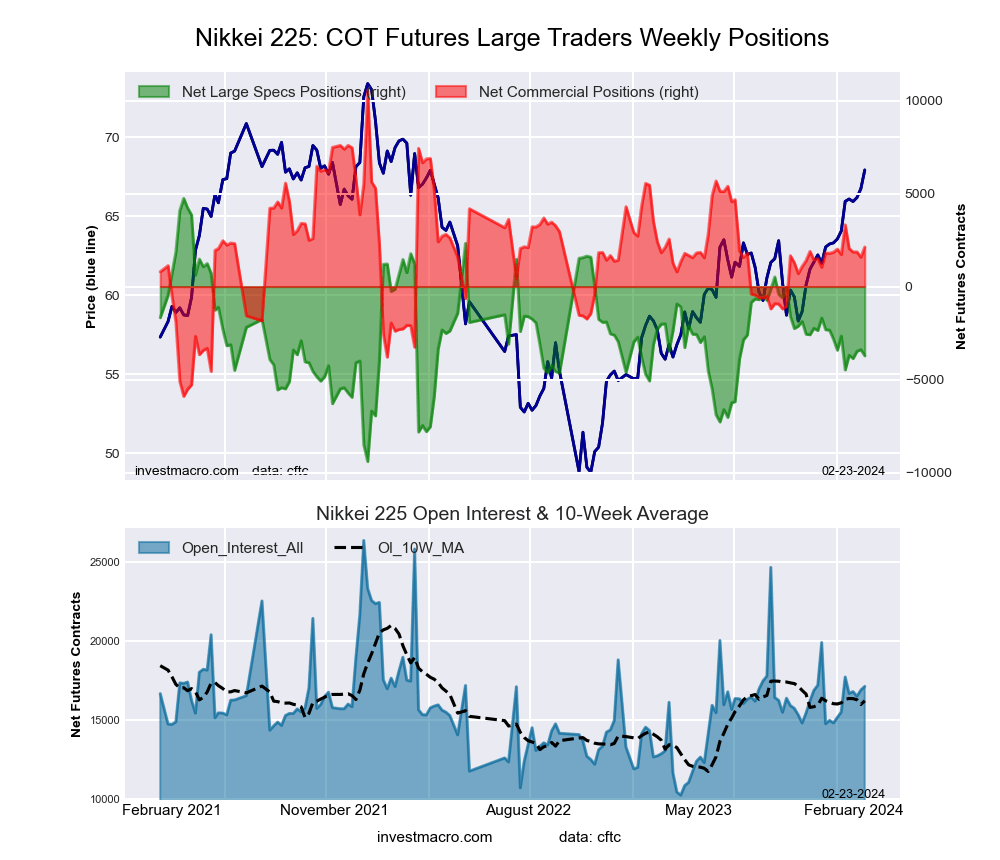 The Nikkei Stock Average (USD) large speculator standing this week equaled a net position of -3,720 contracts in the data reported through Tuesday. This was a weekly reduction of -332 contracts from the previous week which had a total of -3,388 net contracts.
This week’s current strength score (the trader positioning range over the past three years, measured from 0 to 100) shows the speculators are currently Bearish with a score of 40.2 percent. The commercials are Bearish with a score of 48.8 percent and the small traders (not shown in chart) are Bullish with a score of 63.1 percent.
Price Trend-Following Model: Strong Uptrend
Our weekly trend-following model classifies the current market price position as: Strong Uptrend. The current action for the model is considered to be: Hold – Maintain Long Position.
| Nikkei Stock Average Futures Statistics | SPECULATORS | COMMERCIALS | SMALL TRADERS |
| – Percent of Open Interest Longs: | 10.8 | 64.9 | 24.3 |
| – Percent of Open Interest Shorts: | 32.5 | 52.5 | 14.9 |
| – Net Position: | -3,720 | 2,124 | 1,596 |
| – Gross Longs: | 1,852 | 11,121 | 4,156 |
| – Gross Shorts: | 5,572 | 8,997 | 2,560 |
| – Long to Short Ratio: | 0.3 to 1 | 1.2 to 1 | 1.6 to 1 |
| NET POSITION TREND: | |||
| – Strength Index Score (3 Year Range Pct): | 40.2 | 48.8 | 63.1 |
| – Strength Index Reading (3 Year Range): | Bearish | Bearish | Bullish |
| NET POSITION MOVEMENT INDEX: | |||
| – 6-Week Change in Strength Index: | -7.5 | 2.4 | 10.8 |
MSCI EAFE Mini Futures:
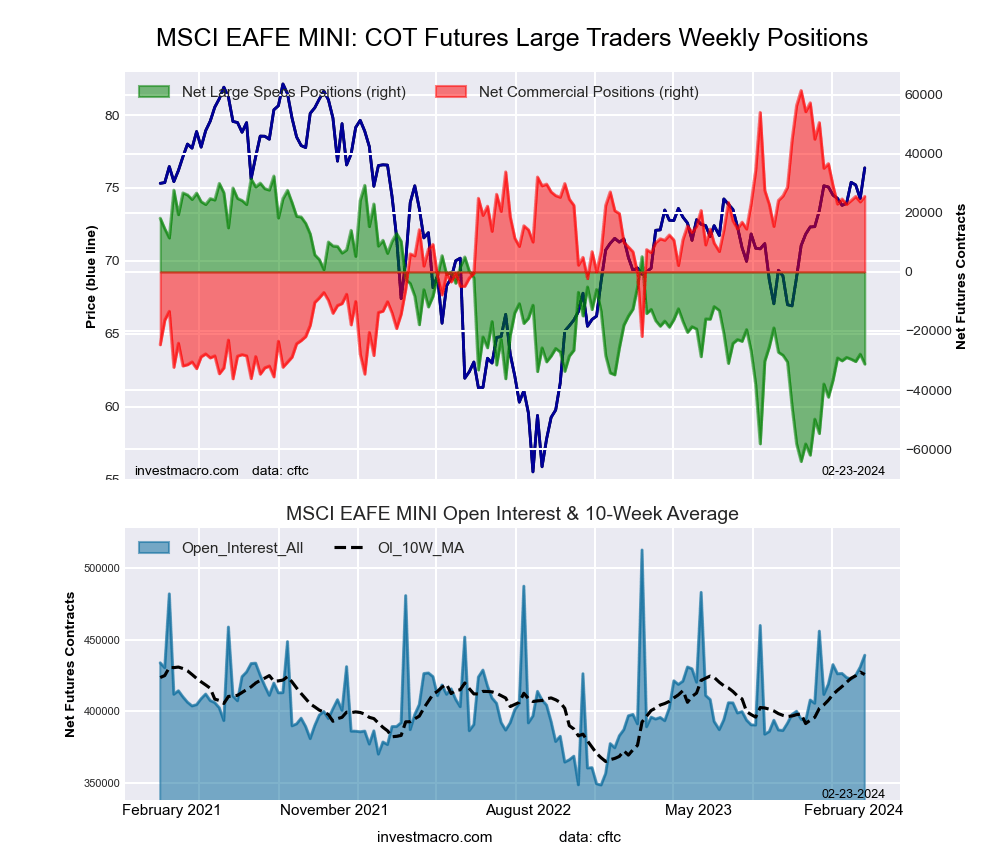 The MSCI EAFE Mini large speculator standing this week equaled a net position of -31,202 contracts in the data reported through Tuesday. This was a weekly fall of -3,346 contracts from the previous week which had a total of -27,856 net contracts.
This week’s current strength score (the trader positioning range over the past three years, measured from 0 to 100) shows the speculators are currently Bearish with a score of 34.1 percent. The commercials are Bullish with a score of 63.3 percent and the small traders (not shown in chart) are Bearish with a score of 45.1 percent.
Price Trend-Following Model: Uptrend
Our weekly trend-following model classifies the current market price position as: Uptrend. The current action for the model is considered to be: Hold – Maintain Long Position.
| MSCI EAFE Mini Futures Statistics | SPECULATORS | COMMERCIALS | SMALL TRADERS |
| – Percent of Open Interest Longs: | 8.6 | 87.9 | 3.2 |
| – Percent of Open Interest Shorts: | 15.7 | 82.1 | 1.9 |
| – Net Position: | -31,202 | 25,565 | 5,637 |
| – Gross Longs: | 37,822 | 386,072 | 14,132 |
| – Gross Shorts: | 69,024 | 360,507 | 8,495 |
| – Long to Short Ratio: | 0.5 to 1 | 1.1 to 1 | 1.7 to 1 |
| NET POSITION TREND: | |||
| – Strength Index Score (3 Year Range Pct): | 34.1 | 63.3 | 45.1 |
| – Strength Index Reading (3 Year Range): | Bearish | Bullish | Bearish |
| NET POSITION MOVEMENT INDEX: | |||
| – 6-Week Change in Strength Index: | -2.1 | 2.7 | -2.5 |
Article By InvestMacro – Receive our weekly COT Newsletter
*COT Report: The COT data, released weekly to the public each Friday, is updated through the most recent Tuesday (data is 3 days old) and shows a quick view of how large speculators or non-commercials (for-profit traders) were positioned in the futures markets.
The CFTC categorizes trader positions according to commercial hedgers (traders who use futures contracts for hedging as part of the business), non-commercials (large traders who speculate to realize trading profits) and nonreportable traders (usually small traders/speculators) as well as their open interest (contracts open in the market at time of reporting). See CFTC criteria here.

- COT Metals Charts: Weekly Speculator Bets led by Copper & Steel Jul 18, 2026
- COT Bonds Charts: Weekly Speculator Bets led by 2-Year, SOFR 3M & 5-Year Bonds Jul 18, 2026
- COT Energy Charts: Weekly Speculator Bets led by Brent Oil & Heating Oil Jul 18, 2026
- COT Soft Commodities Charts: Weekly Speculator Bets led by Wheat, Corn & Soybean Meal Jul 18, 2026
- The Bank of Canada kept its interest rate unchanged. Platinum prices reached a three‑week high Jul 16, 2026
- Stock indices rose after the release of US inflation data. China’s GDP slowed sharply Jul 15, 2026
- GBP/USD Awaits Political News: What Will Happen Next Jul 15, 2026
- USD/JPY Holds at Highs: Pressure Lingers on Yen Jul 14, 2026
- Oil prices jumped 4% amid a new wave of escalation between the US and Iran Jul 13, 2026
- EUR/USD: US Inflation Will Determine Everything Jul 13, 2026