
By InvestMacro

Here are the latest charts and statistics for the Commitment of Traders (COT) reports data published by the Commodities Futures Trading Commission (CFTC).
The latest COT data is updated through Tuesday January 9th and shows a quick view of how large traders (for-profit speculators and commercial hedgers) were positioned in the futures markets.
Weekly Speculator Changes led by SOFR 3-Months & 5-Year Bonds
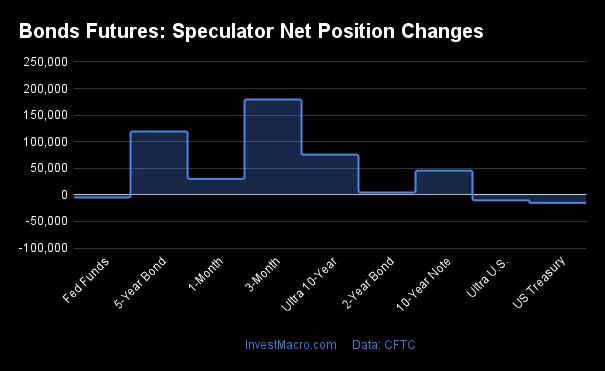
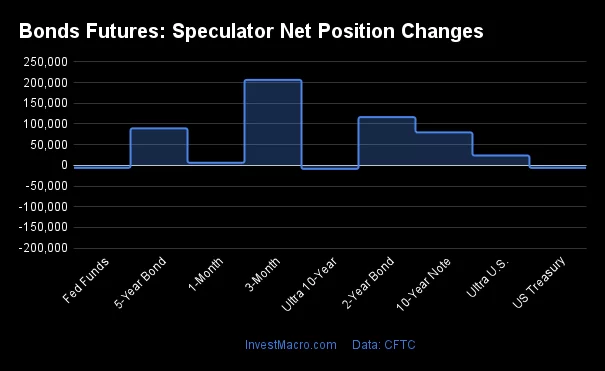
The COT bond market speculator bets were higher this week as five out of the eight bond markets we cover had higher positioning while the other three markets had lower speculator contracts.
Leading the gains for the bond markets was the SOFR 3-Months (179,262 contracts) with the 5-Year Bonds (119,278 contracts), the Ultra 10-Year Bonds (75,655 contracts), the 10-Year Bonds (45,643 contracts) and the 2-Year Bonds (4,382 contracts) also recording positive weeks.
The bond markets with declines in speculator bets for the week were the US Treasury Bonds (-15,127 contracts), the Ultra Treasury Bonds (-10,331 contracts) and the Fed Funds (-4,866 contracts) also registering lower bets on the week.
Bonds – Speculators Leaderboard
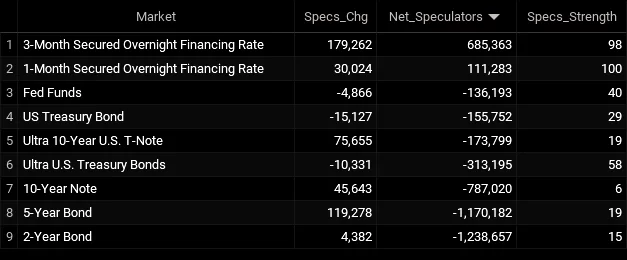
Legend: Weekly Speculators Change | Speculators Current Net Position | Speculators Strength Score compared to last 3-Years (0-100 range)
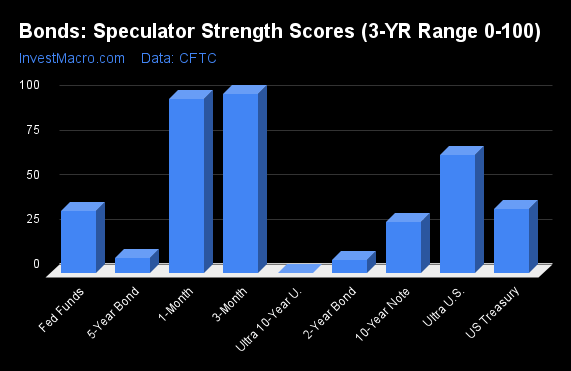
Strength Scores led by SOFR 3-Months & Ultra Treasury Bonds
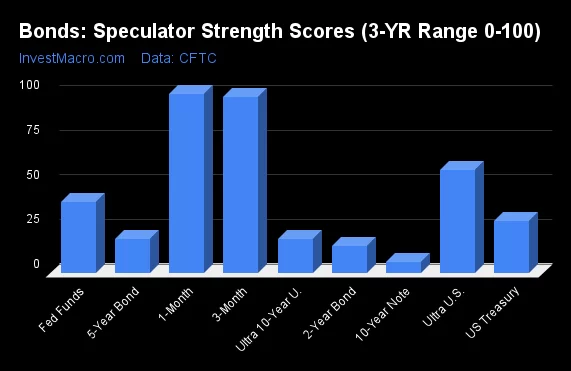
COT Strength Scores (a normalized measure of Speculator positions over a 3-Year range, from 0 to 100 where above 80 is Extreme-Bullish and below 20 is Extreme-Bearish) showed that the SOFR 3-Months (98 percent) and the Ultra Treasury Bonds (58 percent) lead the bond markets this week.
On the downside, the 10-Year Bonds (6 percent), the 2-Year Bonds (15 percent), the Ultra 10-Year Bonds (19 percent) and the 5-Year Bonds (19 percent) come in at the lowest strength levels currently and are in Extreme-Bearish territory (below 20 percent).
Strength Statistics:
Fed Funds (39.5 percent) vs Fed Funds previous week (40.5 percent)
2-Year Bond (15.2 percent) vs 2-Year Bond previous week (14.9 percent)
5-Year Bond (19.1 percent) vs 5-Year Bond previous week (11.5 percent)
10-Year Bond (6.1 percent) vs 10-Year Bond previous week (1.7 percent)
Ultra 10-Year Bond (18.9 percent) vs Ultra 10-Year Bond previous week (5.2 percent)
US Treasury Bond (29.2 percent) vs US Treasury Bond previous week (34.5 percent)
Ultra US Treasury Bond (57.9 percent) vs Ultra US Treasury Bond previous week (62.0 percent)
SOFR 3-Months (98.3 percent) vs SOFR 3-Months previous week (88.7 percent)
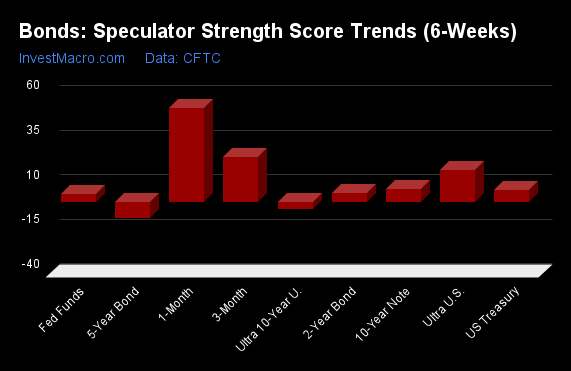
5-Year Bonds & Ultra 10-Year Bonds top the 6-Week Strength Trends
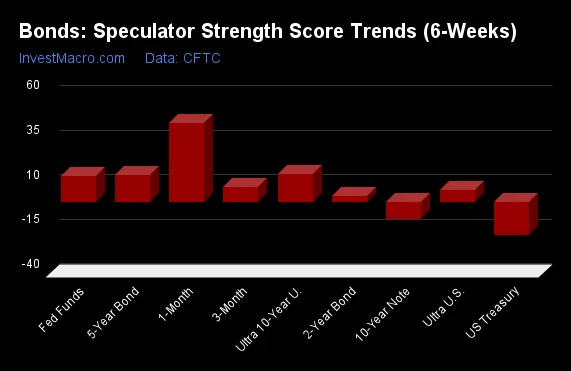
COT Strength Score Trends (or move index, calculates the 6-week changes in strength scores) showed that the 5-Year Bonds (15 percent) and the Ultra 10-Year Bonds (15 percent) lead the past six weeks trends for bonds. The Fed Funds (14 percent) is the next highest positive mover in the latest trends data.
The US Treasury Bonds (-19 percent) and the 10-Year Bonds (-10 percent) lead the downside trend scores currently.
Strength Trend Statistics:
Fed Funds (14.4 percent) vs Fed Funds previous week (3.8 percent)
2-Year Bond (3.2 percent) vs 2-Year Bond previous week (9.1 percent)
5-Year Bond (14.6 percent) vs 5-Year Bond previous week (11.5 percent)
10-Year Bond (-9.9 percent) vs 10-Year Bond previous week (-16.9 percent)
Ultra 10-Year Bond (15.2 percent) vs Ultra 10-Year Bond previous week (-2.7 percent)
US Treasury Bond (-18.7 percent) vs US Treasury Bond previous week (-14.2 percent)
Ultra US Treasury Bond (6.5 percent) vs Ultra US Treasury Bond previous week (8.0 percent)
SOFR 3-Months (8.4 percent) vs SOFR 3-Months previous week (0.3 percent)
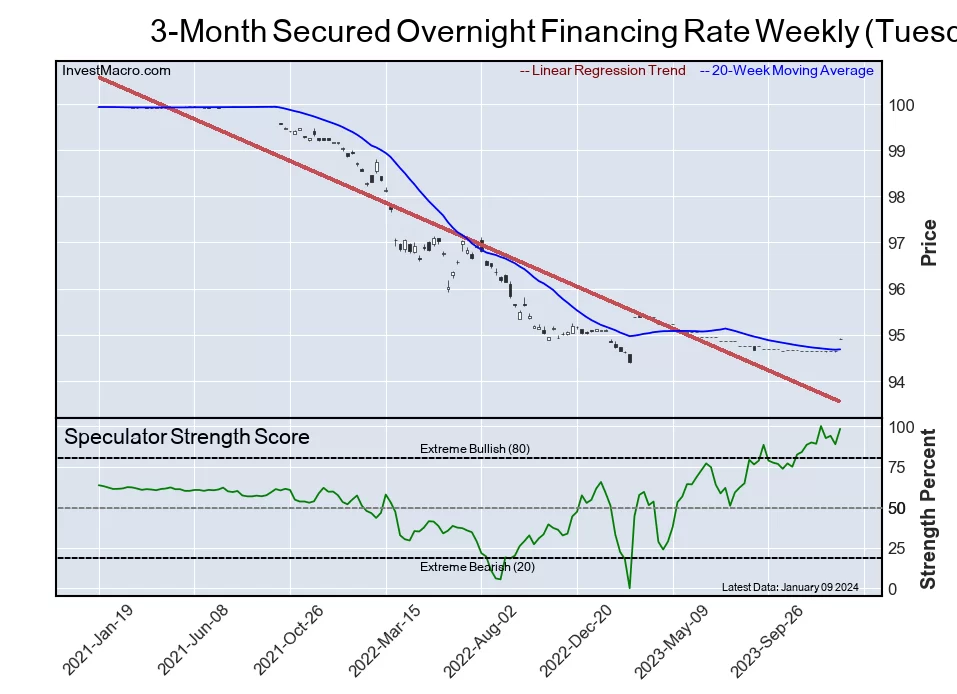
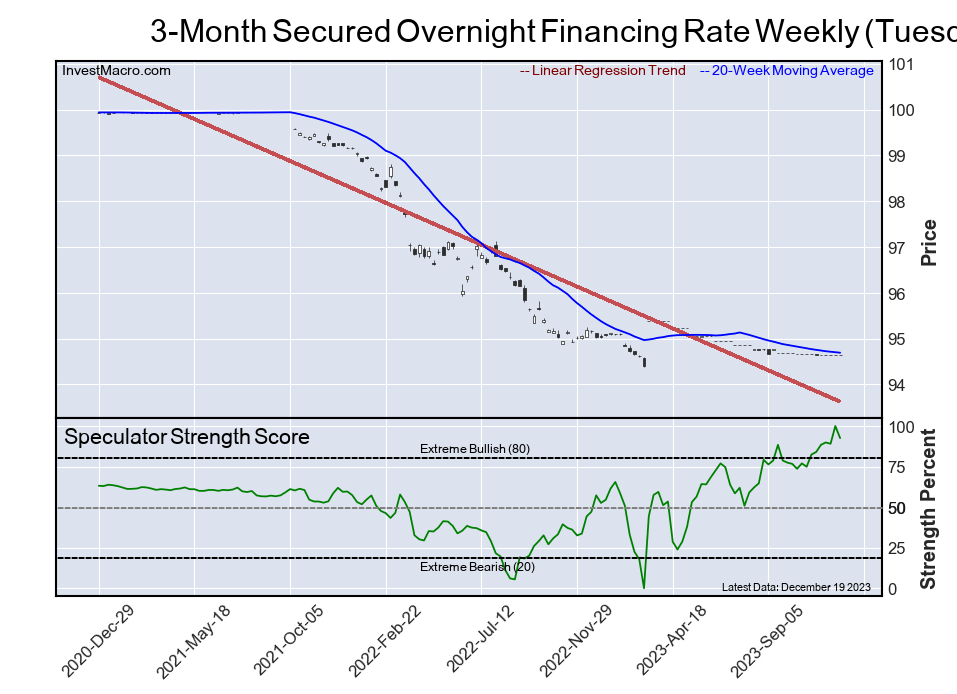
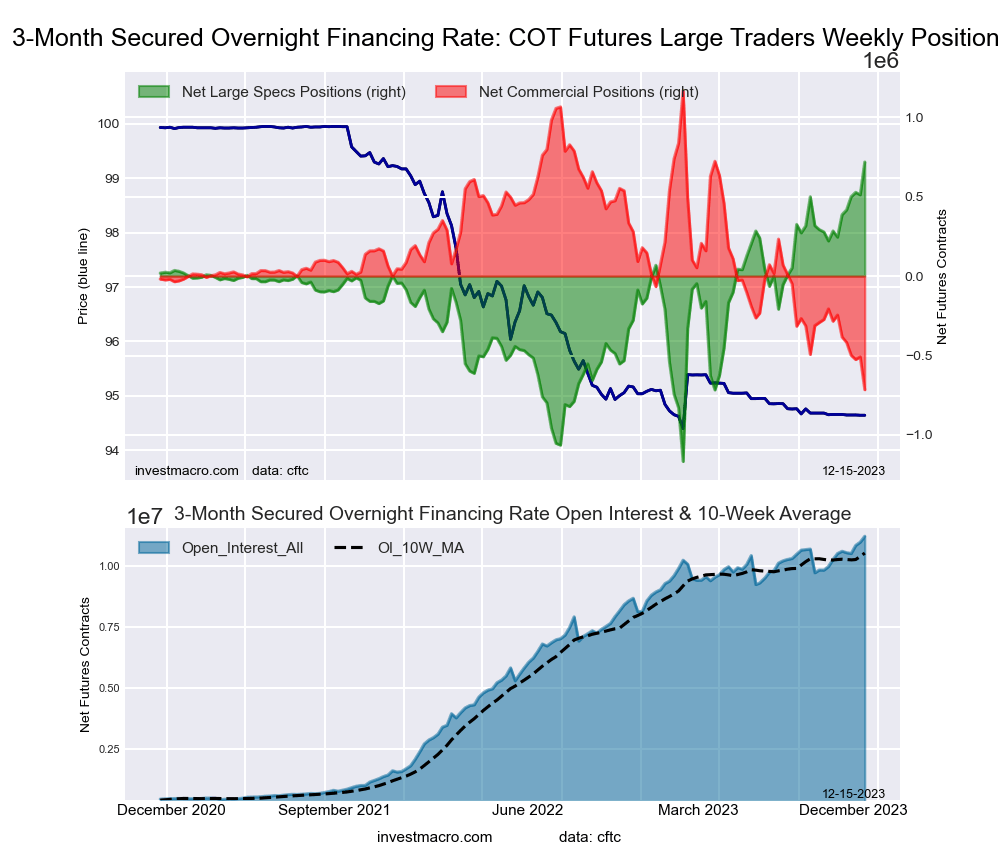
Secured Overnight Financing Rate (3-Month) Futures:
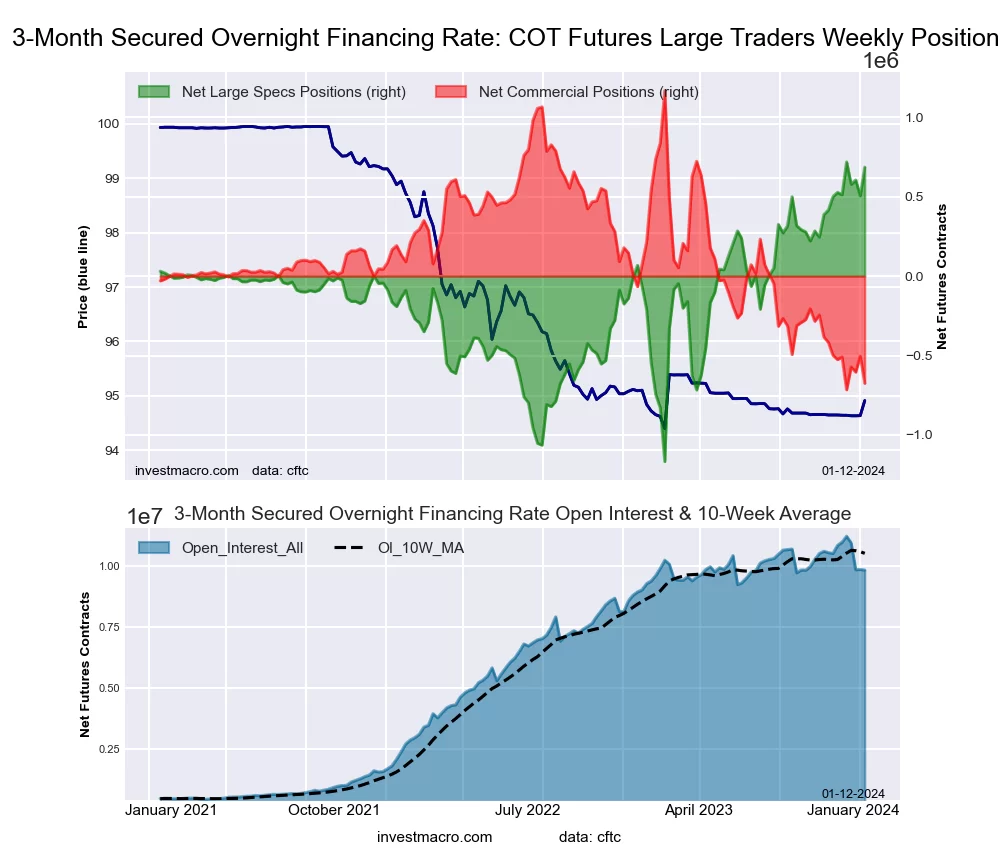 The Secured Overnight Financing Rate (3-Month) large speculator standing this week resulted in a net position of 685,363 contracts in the data reported through Tuesday. This was a weekly boost of 179,262 contracts from the previous week which had a total of 506,101 net contracts.
This week’s current strength score (the trader positioning range over the past three years, measured from 0 to 100) shows the speculators are currently Bullish-Extreme with a score of 98.3 percent. The commercials are Bearish-Extreme with a score of 2.1 percent and the small traders (not shown in chart) are Bullish-Extreme with a score of 82.0 percent.
Price Trend-Following Model: Weak Uptrend
Our weekly trend-following model classifies the current market price position as: Weak Uptrend. The current action for the model is considered to be: Hold – Maintain Long Position.
| SOFR 3-Months Statistics | SPECULATORS | COMMERCIALS | SMALL TRADERS |
| – Percent of Open Interest Longs: | 18.9 | 50.9 | 0.3 |
| – Percent of Open Interest Shorts: | 11.9 | 57.8 | 0.4 |
| – Net Position: | 685,363 | -674,767 | -10,596 |
| – Gross Longs: | 1,854,270 | 5,002,614 | 31,668 |
| – Gross Shorts: | 1,168,907 | 5,677,381 | 42,264 |
| – Long to Short Ratio: | 1.6 to 1 | 0.9 to 1 | 0.7 to 1 |
| NET POSITION TREND: | |||
| – Strength Index Score (3 Year Range Pct): | 98.3 | 2.1 | 82.0 |
| – Strength Index Reading (3 Year Range): | Bullish-Extreme | Bearish-Extreme | Bullish-Extreme |
| NET POSITION MOVEMENT INDEX: | |||
| – 6-Week Change in Strength Index: | 8.4 | -7.9 | -4.8 |
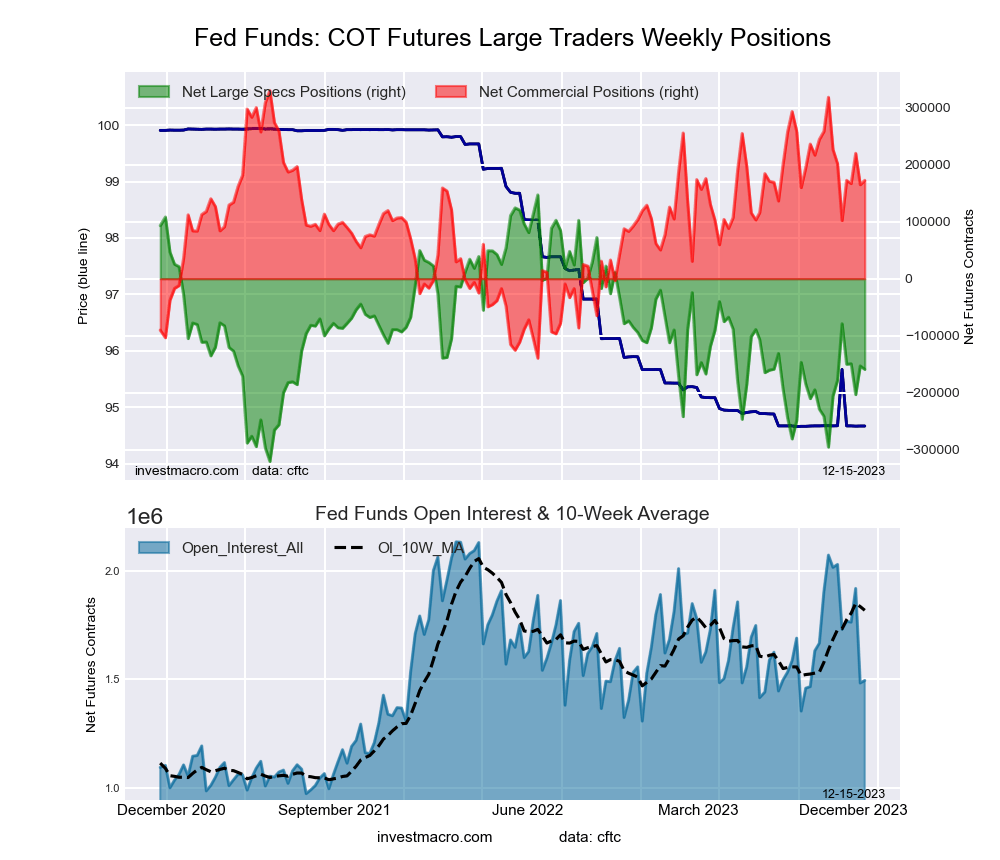
30-Day Federal Funds Futures:
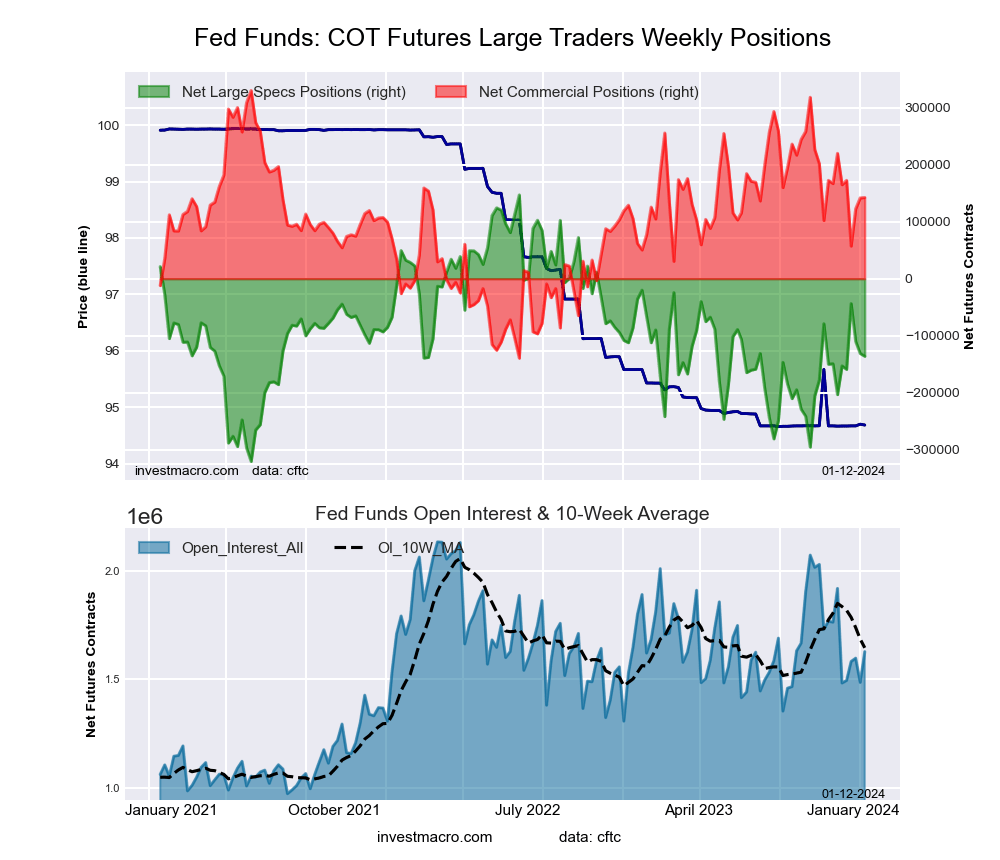 The 30-Day Federal Funds large speculator standing this week resulted in a net position of -136,193 contracts in the data reported through Tuesday. This was a weekly decline of -4,866 contracts from the previous week which had a total of -131,327 net contracts.
This week’s current strength score (the trader positioning range over the past three years, measured from 0 to 100) shows the speculators are currently Bearish with a score of 39.5 percent. The commercials are Bullish with a score of 60.0 percent and the small traders (not shown in chart) are Bullish with a score of 78.3 percent.
Price Trend-Following Model: Downtrend
Our weekly trend-following model classifies the current market price position as: Downtrend. The current action for the model is considered to be: Hold – Maintain Short Position.
| 30-Day Federal Funds Statistics | SPECULATORS | COMMERCIALS | SMALL TRADERS |
| – Percent of Open Interest Longs: | 10.2 | 69.6 | 2.4 |
| – Percent of Open Interest Shorts: | 18.5 | 60.8 | 2.8 |
| – Net Position: | -136,193 | 142,645 | -6,452 |
| – Gross Longs: | 165,155 | 1,131,777 | 38,635 |
| – Gross Shorts: | 301,348 | 989,132 | 45,087 |
| – Long to Short Ratio: | 0.5 to 1 | 1.1 to 1 | 0.9 to 1 |
| NET POSITION TREND: | |||
| – Strength Index Score (3 Year Range Pct): | 39.5 | 60.0 | 78.3 |
| – Strength Index Reading (3 Year Range): | Bearish | Bullish | Bullish |
| NET POSITION MOVEMENT INDEX: | |||
| – 6-Week Change in Strength Index: | 14.4 | -16.5 | 20.1 |
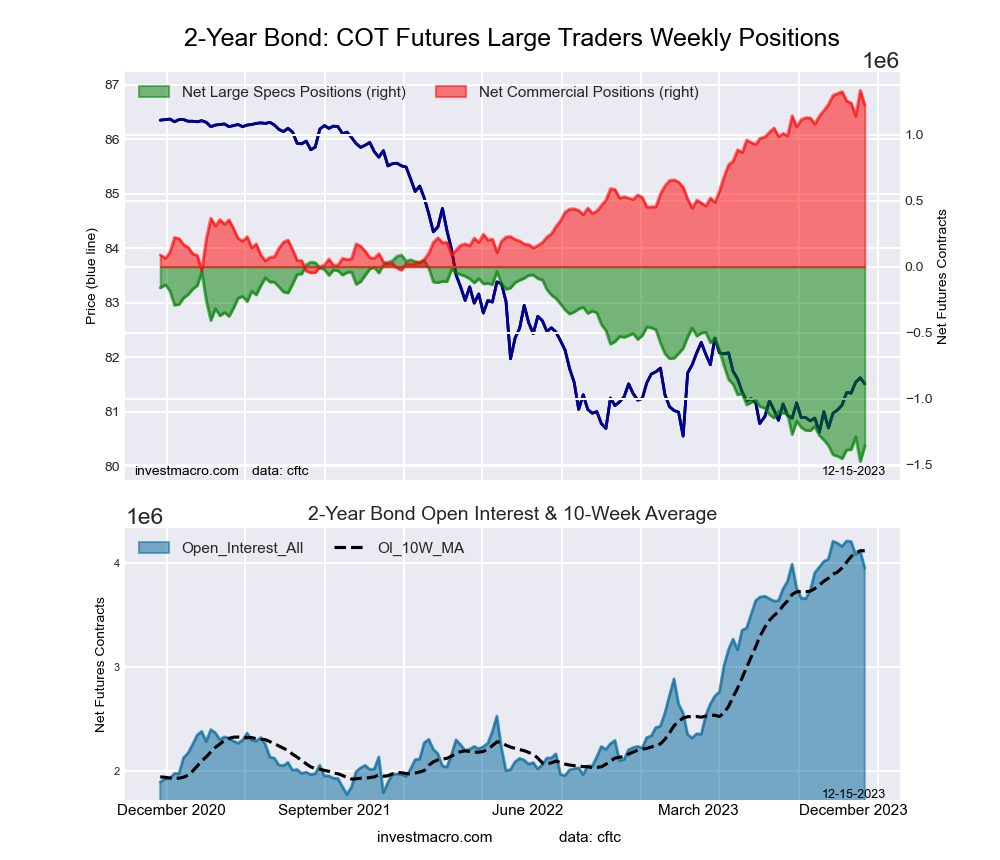
2-Year Treasury Note Futures:
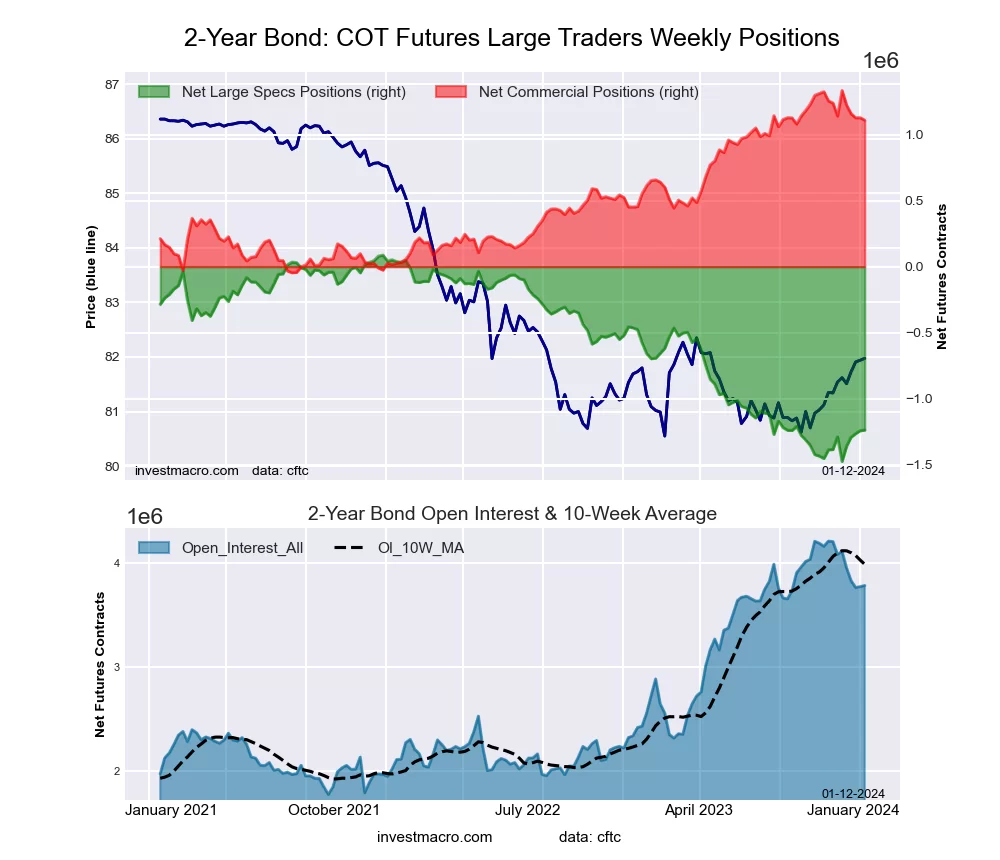 The 2-Year Treasury Note large speculator standing this week resulted in a net position of -1,238,657 contracts in the data reported through Tuesday. This was a weekly gain of 4,382 contracts from the previous week which had a total of -1,243,039 net contracts.
This week’s current strength score (the trader positioning range over the past three years, measured from 0 to 100) shows the speculators are currently Bearish-Extreme with a score of 15.2 percent. The commercials are Bullish-Extreme with a score of 83.7 percent and the small traders (not shown in chart) are Bullish-Extreme with a score of 93.0 percent.
Price Trend-Following Model: Strong Uptrend
Our weekly trend-following model classifies the current market price position as: Strong Uptrend. The current action for the model is considered to be: Hold – Maintain Long Position.
| 2-Year Treasury Note Statistics | SPECULATORS | COMMERCIALS | SMALL TRADERS |
| – Percent of Open Interest Longs: | 11.2 | 80.4 | 6.8 |
| – Percent of Open Interest Shorts: | 43.9 | 51.0 | 3.4 |
| – Net Position: | -1,238,657 | 1,109,623 | 129,034 |
| – Gross Longs: | 421,993 | 3,038,980 | 256,226 |
| – Gross Shorts: | 1,660,650 | 1,929,357 | 127,192 |
| – Long to Short Ratio: | 0.3 to 1 | 1.6 to 1 | 2.0 to 1 |
| NET POSITION TREND: | |||
| – Strength Index Score (3 Year Range Pct): | 15.2 | 83.7 | 93.0 |
| – Strength Index Reading (3 Year Range): | Bearish-Extreme | Bullish-Extreme | Bullish-Extreme |
| NET POSITION MOVEMENT INDEX: | |||
| – 6-Week Change in Strength Index: | 3.2 | -2.3 | -7.0 |
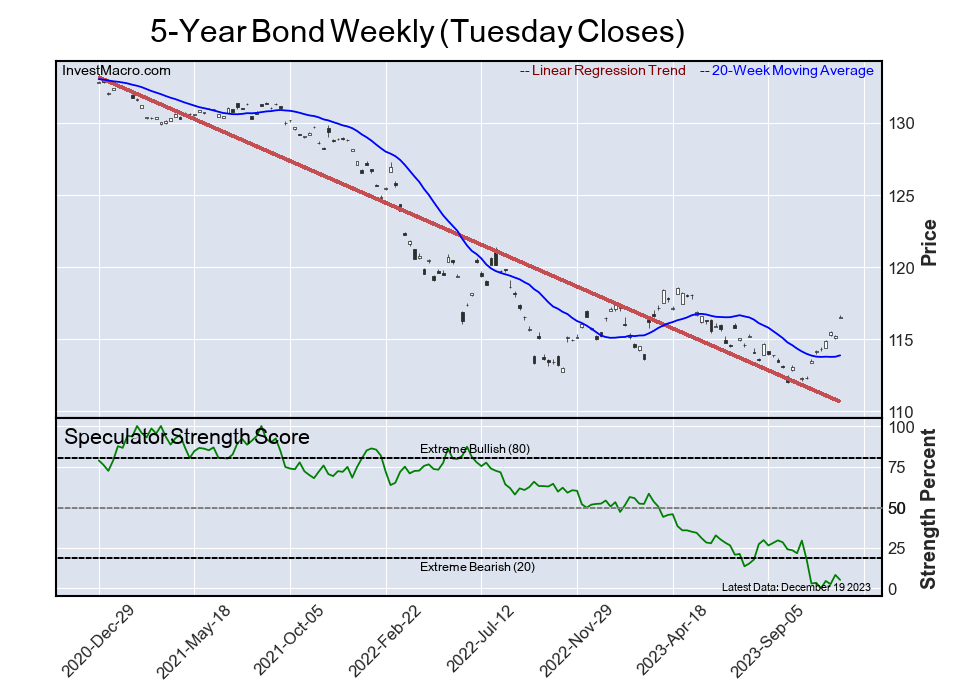
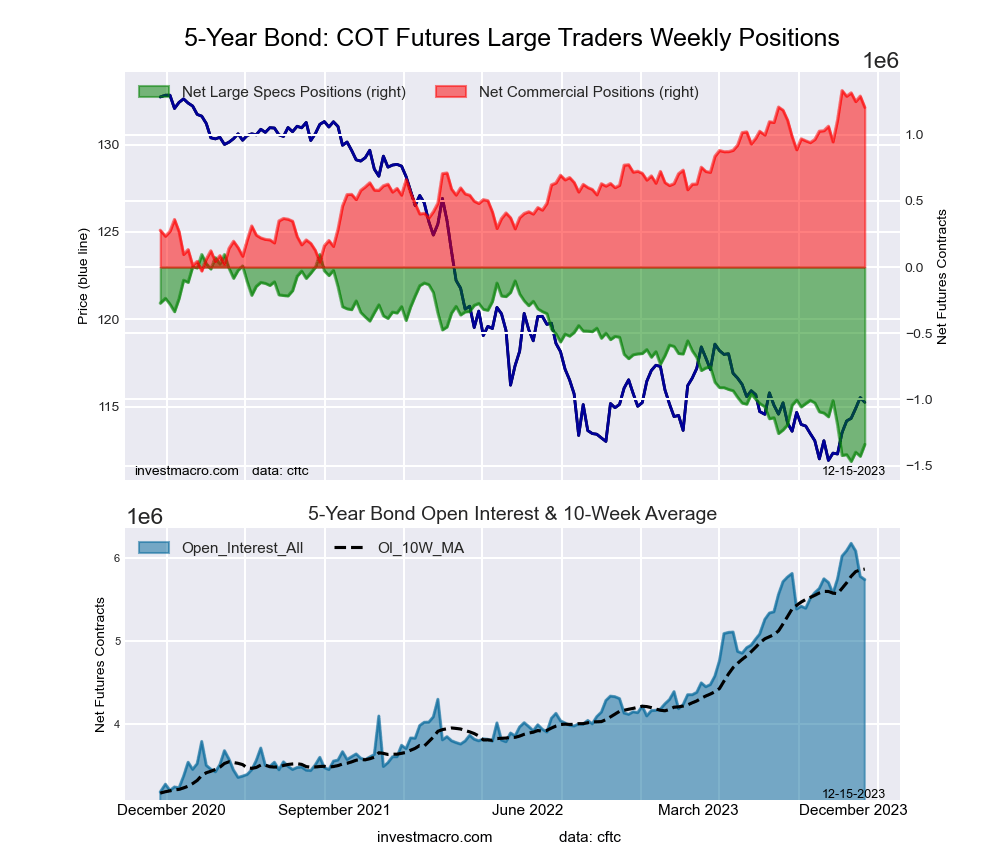
5-Year Treasury Note Futures:
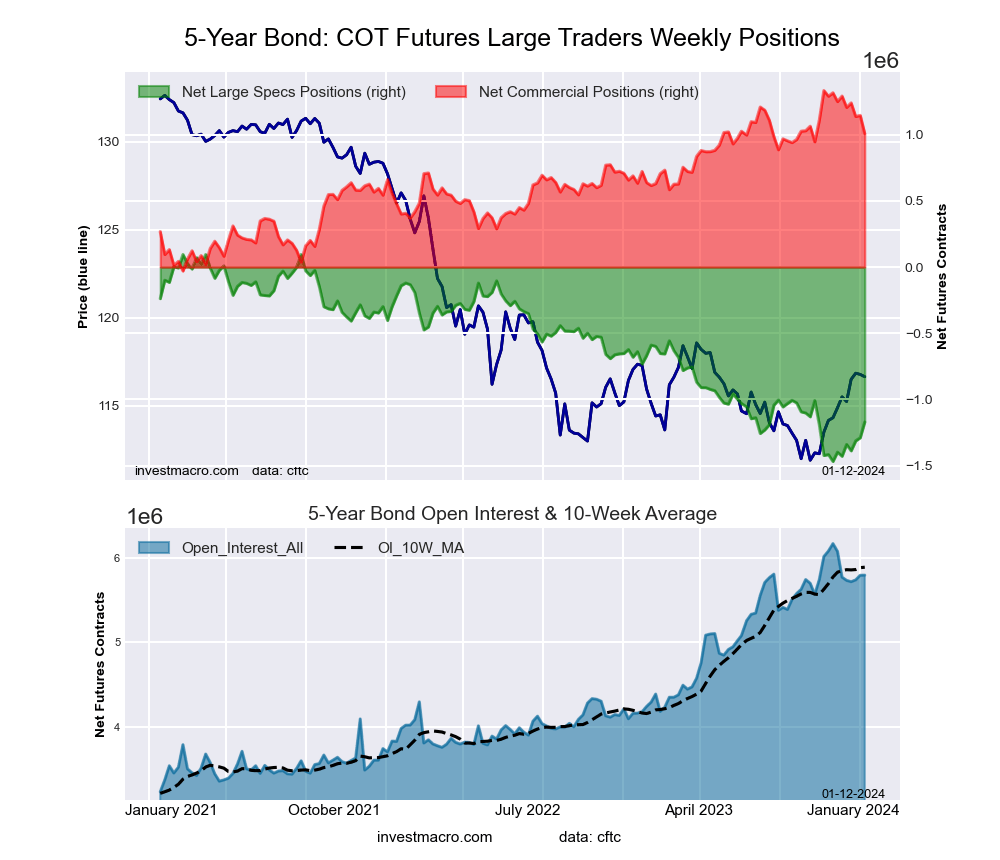 The 5-Year Treasury Note large speculator standing this week resulted in a net position of -1,170,182 contracts in the data reported through Tuesday. This was a weekly boost of 119,278 contracts from the previous week which had a total of -1,289,460 net contracts.
This week’s current strength score (the trader positioning range over the past three years, measured from 0 to 100) shows the speculators are currently Bearish-Extreme with a score of 19.1 percent. The commercials are Bullish with a score of 76.1 percent and the small traders (not shown in chart) are Bullish-Extreme with a score of 97.1 percent.
Price Trend-Following Model: Strong Uptrend
Our weekly trend-following model classifies the current market price position as: Strong Uptrend. The current action for the model is considered to be: Hold – Maintain Long Position.
| 5-Year Treasury Note Statistics | SPECULATORS | COMMERCIALS | SMALL TRADERS |
| – Percent of Open Interest Longs: | 7.6 | 83.5 | 7.6 |
| – Percent of Open Interest Shorts: | 27.8 | 66.1 | 4.8 |
| – Net Position: | -1,170,182 | 1,008,597 | 161,585 |
| – Gross Longs: | 443,301 | 4,841,923 | 438,210 |
| – Gross Shorts: | 1,613,483 | 3,833,326 | 276,625 |
| – Long to Short Ratio: | 0.3 to 1 | 1.3 to 1 | 1.6 to 1 |
| NET POSITION TREND: | |||
| – Strength Index Score (3 Year Range Pct): | 19.1 | 76.1 | 97.1 |
| – Strength Index Reading (3 Year Range): | Bearish-Extreme | Bullish | Bullish-Extreme |
| NET POSITION MOVEMENT INDEX: | |||
| – 6-Week Change in Strength Index: | 14.6 | -17.8 | 3.0 |
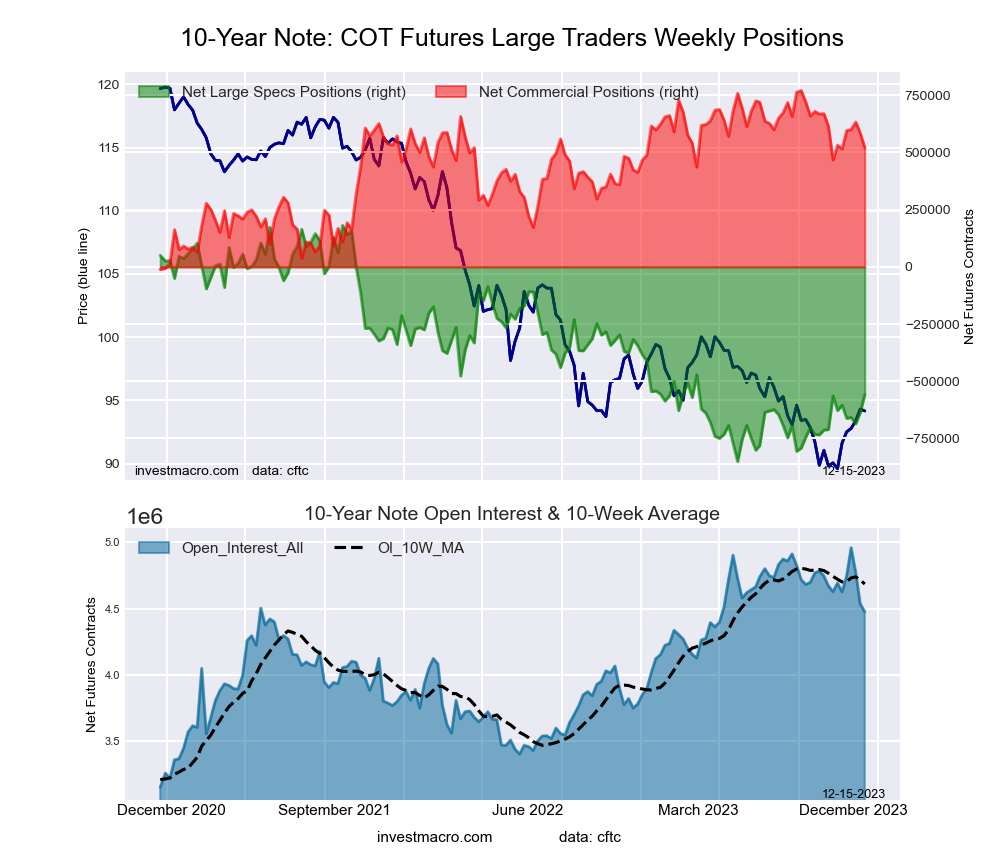
10-Year Treasury Note Futures:
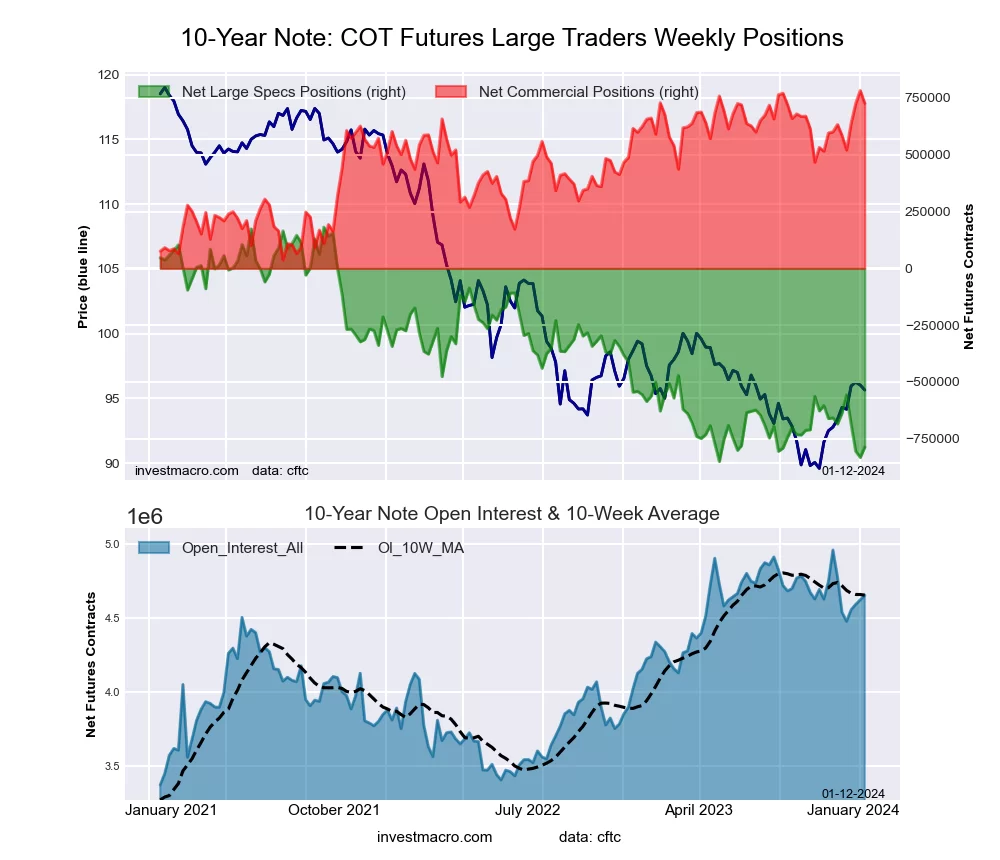 The 10-Year Treasury Note large speculator standing this week resulted in a net position of -787,020 contracts in the data reported through Tuesday. This was a weekly boost of 45,643 contracts from the previous week which had a total of -832,663 net contracts.
This week’s current strength score (the trader positioning range over the past three years, measured from 0 to 100) shows the speculators are currently Bearish-Extreme with a score of 6.1 percent. The commercials are Bullish-Extreme with a score of 92.5 percent and the small traders (not shown in chart) are Bullish-Extreme with a score of 86.7 percent.
Price Trend-Following Model: Strong Uptrend
Our weekly trend-following model classifies the current market price position as: Strong Uptrend. The current action for the model is considered to be: Hold – Maintain Long Position.
| 10-Year Treasury Note Statistics | SPECULATORS | COMMERCIALS | SMALL TRADERS |
| – Percent of Open Interest Longs: | 10.1 | 79.4 | 8.9 |
| – Percent of Open Interest Shorts: | 27.0 | 63.8 | 7.6 |
| – Net Position: | -787,020 | 726,488 | 60,532 |
| – Gross Longs: | 469,964 | 3,695,263 | 414,385 |
| – Gross Shorts: | 1,256,984 | 2,968,775 | 353,853 |
| – Long to Short Ratio: | 0.4 to 1 | 1.2 to 1 | 1.2 to 1 |
| NET POSITION TREND: | |||
| – Strength Index Score (3 Year Range Pct): | 6.1 | 92.5 | 86.7 |
| – Strength Index Reading (3 Year Range): | Bearish-Extreme | Bullish-Extreme | Bullish-Extreme |
| NET POSITION MOVEMENT INDEX: | |||
| – 6-Week Change in Strength Index: | -9.9 | 12.5 | 1.8 |
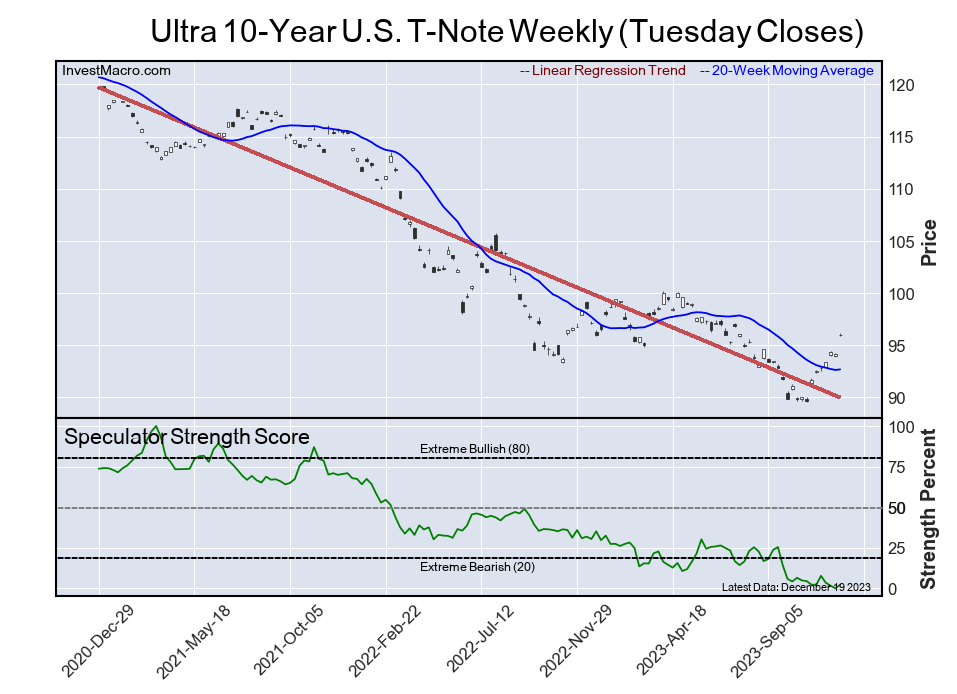
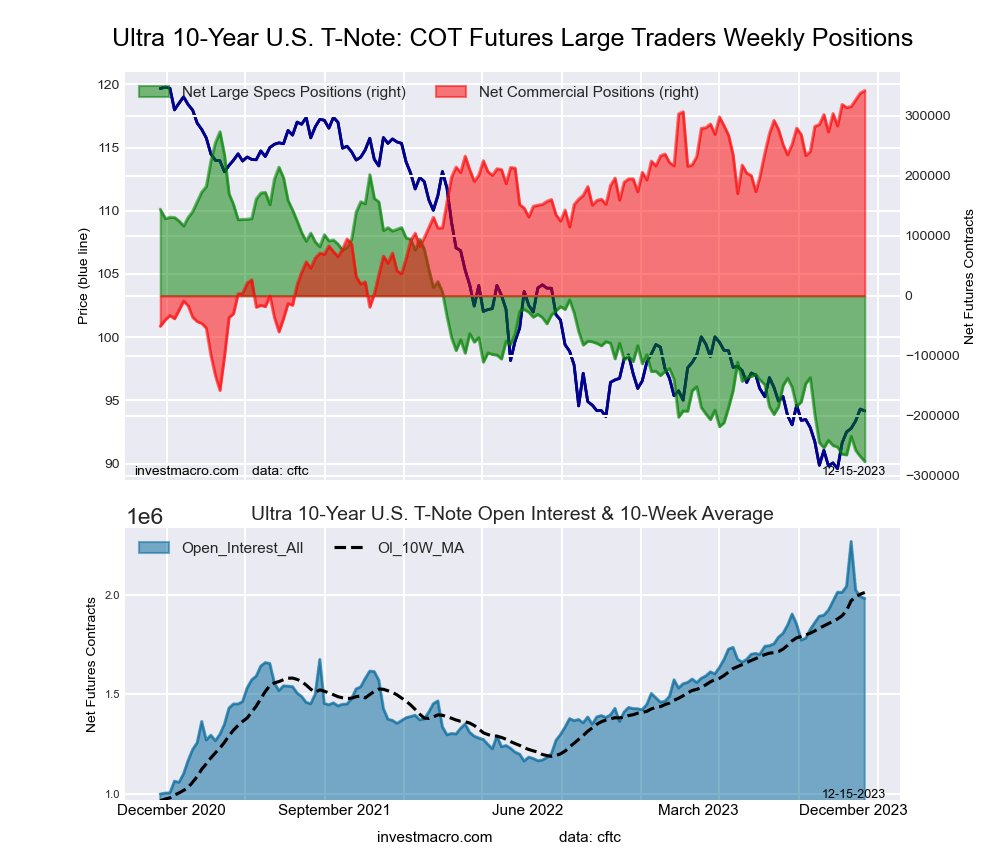
Ultra 10-Year Notes Futures:
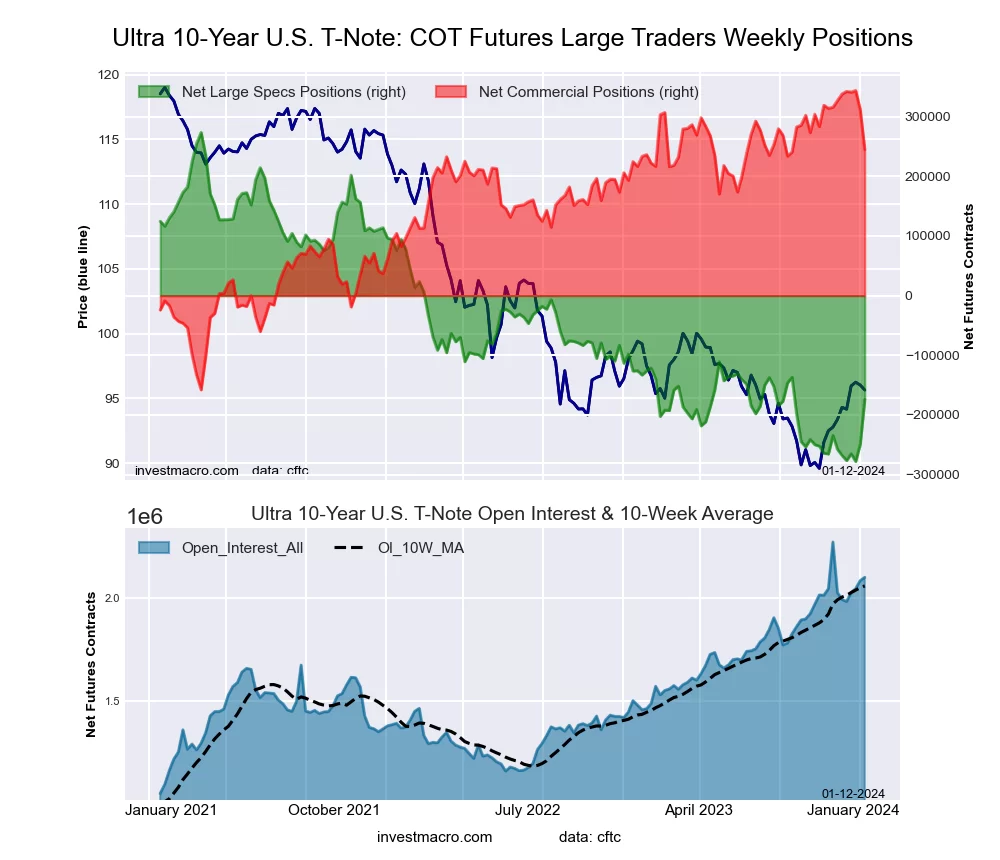 The Ultra 10-Year Notes large speculator standing this week resulted in a net position of -173,799 contracts in the data reported through Tuesday. This was a weekly boost of 75,655 contracts from the previous week which had a total of -249,454 net contracts.
This week’s current strength score (the trader positioning range over the past three years, measured from 0 to 100) shows the speculators are currently Bearish-Extreme with a score of 18.9 percent. The commercials are Bullish-Extreme with a score of 80.2 percent and the small traders (not shown in chart) are Bullish with a score of 71.9 percent.
Price Trend-Following Model: Weak Uptrend
Our weekly trend-following model classifies the current market price position as: Weak Uptrend. The current action for the model is considered to be: Hold – Maintain Long Position.
| Ultra 10-Year Notes Statistics | SPECULATORS | COMMERCIALS | SMALL TRADERS |
| – Percent of Open Interest Longs: | 15.5 | 73.7 | 9.7 |
| – Percent of Open Interest Shorts: | 23.8 | 62.0 | 13.0 |
| – Net Position: | -173,799 | 244,692 | -70,893 |
| – Gross Longs: | 324,787 | 1,545,552 | 202,935 |
| – Gross Shorts: | 498,586 | 1,300,860 | 273,828 |
| – Long to Short Ratio: | 0.7 to 1 | 1.2 to 1 | 0.7 to 1 |
| NET POSITION TREND: | |||
| – Strength Index Score (3 Year Range Pct): | 18.9 | 80.2 | 71.9 |
| – Strength Index Reading (3 Year Range): | Bearish-Extreme | Bullish-Extreme | Bullish |
| NET POSITION MOVEMENT INDEX: | |||
| – 6-Week Change in Strength Index: | 15.2 | -16.4 | -1.0 |
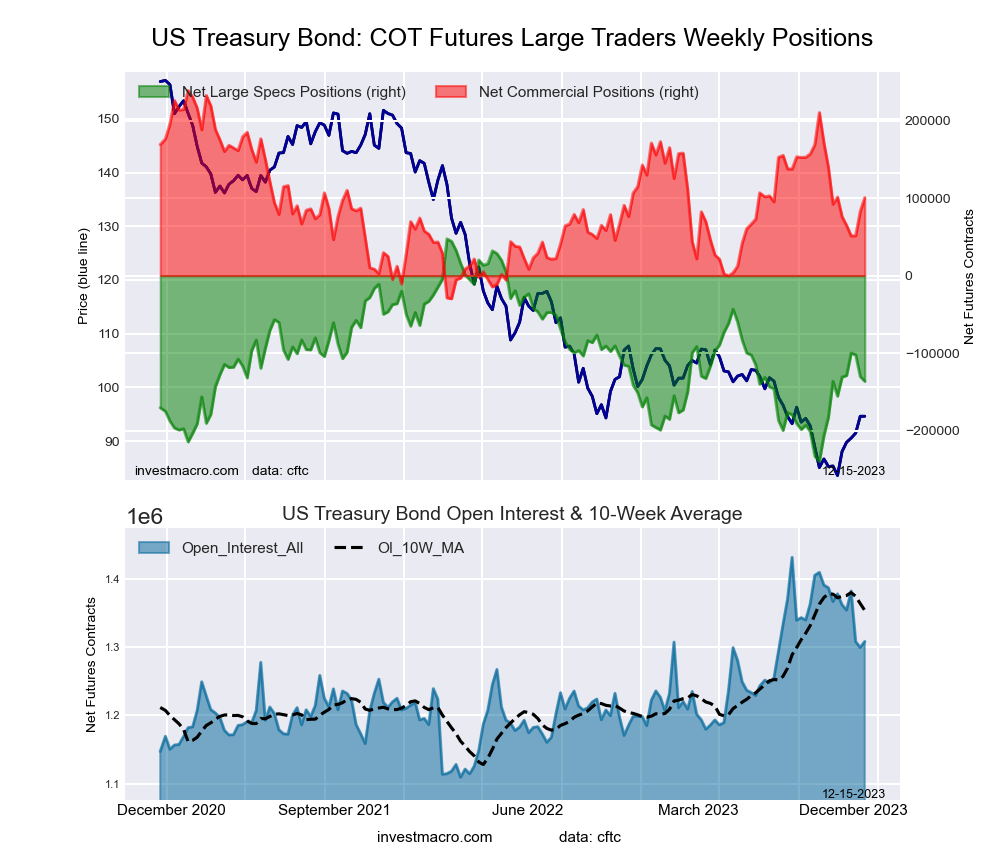
US Treasury Bonds Futures:
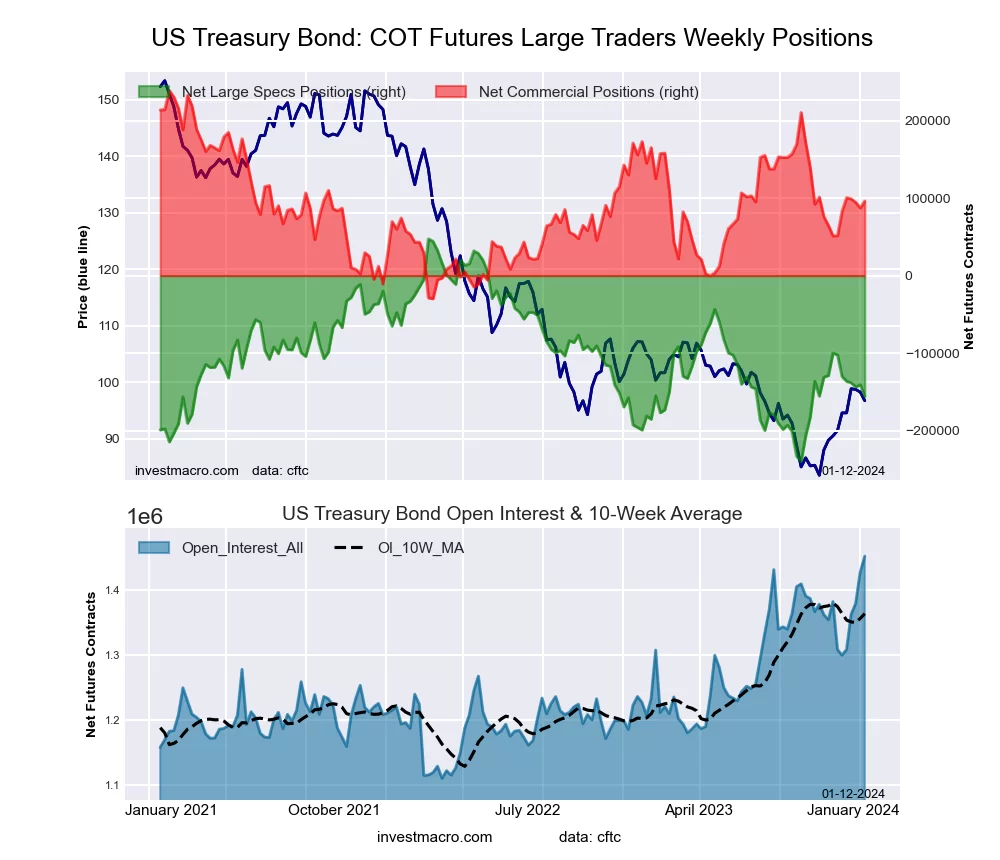 The US Treasury Bonds large speculator standing this week resulted in a net position of -155,752 contracts in the data reported through Tuesday. This was a weekly fall of -15,127 contracts from the previous week which had a total of -140,625 net contracts.
This week’s current strength score (the trader positioning range over the past three years, measured from 0 to 100) shows the speculators are currently Bearish with a score of 29.2 percent. The commercials are Bearish with a score of 46.9 percent and the small traders (not shown in chart) are Bullish-Extreme with a score of 91.8 percent.
Price Trend-Following Model: Strong Uptrend
Our weekly trend-following model classifies the current market price position as: Strong Uptrend. The current action for the model is considered to be: Hold – Maintain Long Position.
| US Treasury Bonds Statistics | SPECULATORS | COMMERCIALS | SMALL TRADERS |
| – Percent of Open Interest Longs: | 12.3 | 73.6 | 13.6 |
| – Percent of Open Interest Shorts: | 23.0 | 67.0 | 9.5 |
| – Net Position: | -155,752 | 96,151 | 59,601 |
| – Gross Longs: | 178,714 | 1,068,735 | 197,999 |
| – Gross Shorts: | 334,466 | 972,584 | 138,398 |
| – Long to Short Ratio: | 0.5 to 1 | 1.1 to 1 | 1.4 to 1 |
| NET POSITION TREND: | |||
| – Strength Index Score (3 Year Range Pct): | 29.2 | 46.9 | 91.8 |
| – Strength Index Reading (3 Year Range): | Bearish | Bearish | Bullish-Extreme |
| NET POSITION MOVEMENT INDEX: | |||
| – 6-Week Change in Strength Index: | -18.7 | 16.6 | 6.6 |
Ultra US Treasury Bonds Futures:
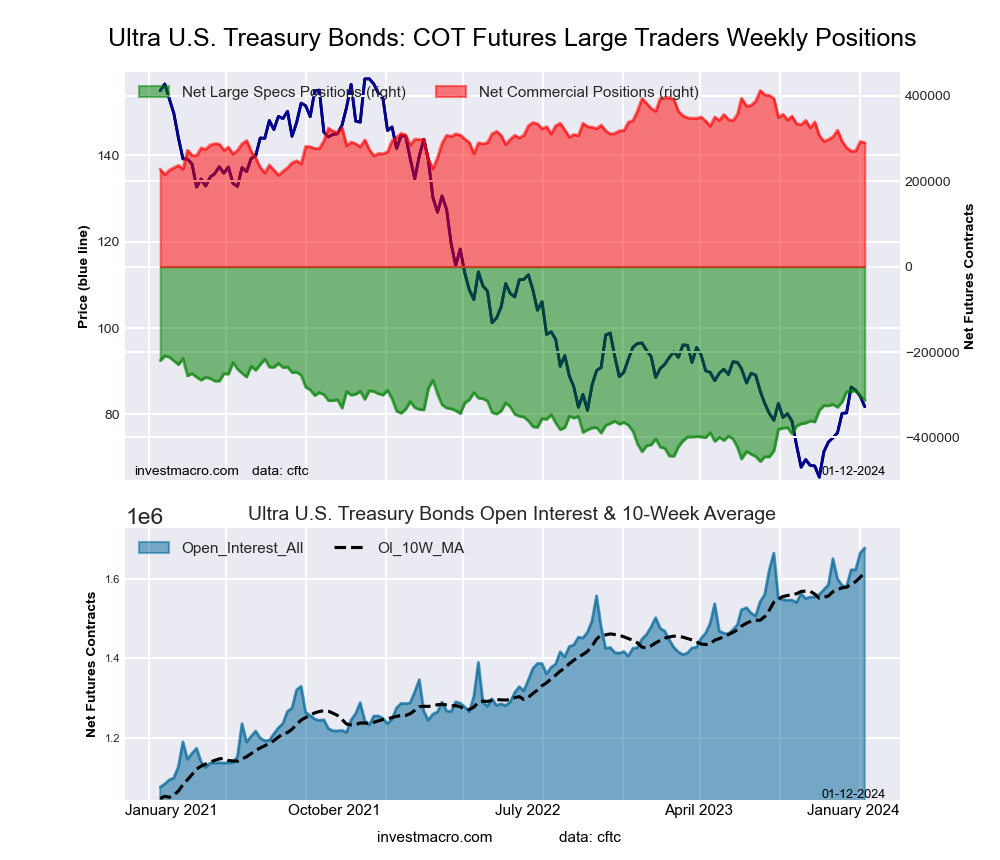 The Ultra US Treasury Bonds large speculator standing this week resulted in a net position of -313,195 contracts in the data reported through Tuesday. This was a weekly fall of -10,331 contracts from the previous week which had a total of -302,864 net contracts.
This week’s current strength score (the trader positioning range over the past three years, measured from 0 to 100) shows the speculators are currently Bullish with a score of 57.9 percent. The commercials are Bearish with a score of 38.3 percent and the small traders (not shown in chart) are Bullish with a score of 58.9 percent.
Price Trend-Following Model: Strong Uptrend
Our weekly trend-following model classifies the current market price position as: Strong Uptrend. The current action for the model is considered to be: Hold – Maintain Long Position.
| Ultra US Treasury Bonds Statistics | SPECULATORS | COMMERCIALS | SMALL TRADERS |
| – Percent of Open Interest Longs: | 9.2 | 80.6 | 10.0 |
| – Percent of Open Interest Shorts: | 27.9 | 63.3 | 8.6 |
| – Net Position: | -313,195 | 290,221 | 22,974 |
| – Gross Longs: | 154,339 | 1,352,257 | 167,038 |
| – Gross Shorts: | 467,534 | 1,062,036 | 144,064 |
| – Long to Short Ratio: | 0.3 to 1 | 1.3 to 1 | 1.2 to 1 |
| NET POSITION TREND: | |||
| – Strength Index Score (3 Year Range Pct): | 57.9 | 38.3 | 58.9 |
| – Strength Index Reading (3 Year Range): | Bullish | Bearish | Bullish |
| NET POSITION MOVEMENT INDEX: | |||
| – 6-Week Change in Strength Index: | 6.5 | -14.7 | 12.4 |
Article By InvestMacro – Receive our weekly COT Newsletter
*COT Report: The COT data, released weekly to the public each Friday, is updated through the most recent Tuesday (data is 3 days old) and shows a quick view of how large speculators or non-commercials (for-profit traders) were positioned in the futures markets.
The CFTC categorizes trader positions according to commercial hedgers (traders who use futures contracts for hedging as part of the business), non-commercials (large traders who speculate to realize trading profits) and nonreportable traders (usually small traders/speculators) as well as their open interest (contracts open in the market at time of reporting). See CFTC criteria here.


