
By InvestMacro
Here are the latest charts and statistics for the Commitment of Traders (COT) data published by the Commodities Futures Trading Commission (CFTC).
The latest COT data is updated through Tuesday December 12th and shows a quick view of how large traders (for-profit speculators and commercial entities) were positioned in the futures markets.
Weekly Speculator Changes led by the VIX & Russell-Mini
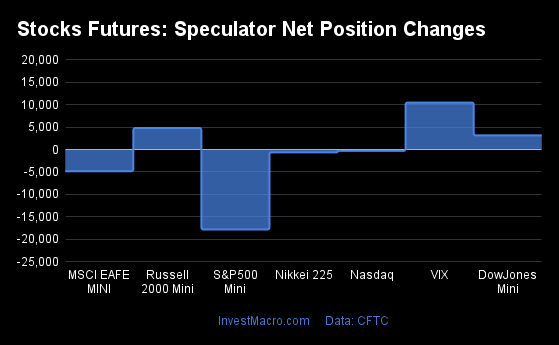
The COT stock markets speculator bets were slightly lower this week as three out of the seven stock markets we cover had higher positioning while the other four markets had lower speculator contracts.
Free Reports:
 Sign Up for Our Stock Market Newsletter – Get updated on News, Charts & Rankings of Public Companies when you join our Stocks Newsletter
 Get our Weekly Commitment of Traders Reports - See where the biggest traders (Hedge Funds and Commercial Hedgers) are positioned in the futures markets on a weekly basis.
Leading the gains for the stock markets was the VIX (10,461 contracts) with the Russell-Mini (4,800 contracts) and the DowJones-Mini (3,143 contracts) also showing positive weeks.
The markets with the declines in speculator bets this week were the S&P500-Mini (-17,822 contracts), the MSCI EAFE-Mini (-4,851 contracts), the Nikkei 225 (-627 contracts) and the Nasdaq-Mini (-298 contracts) also registering lower bets on the week.
| Dec-12-2023 | OI | OI-Index | Spec-Net | Spec-Index | Com-Net | COM-Index | Smalls-Net | Smalls-Index |
|---|---|---|---|---|---|---|---|---|
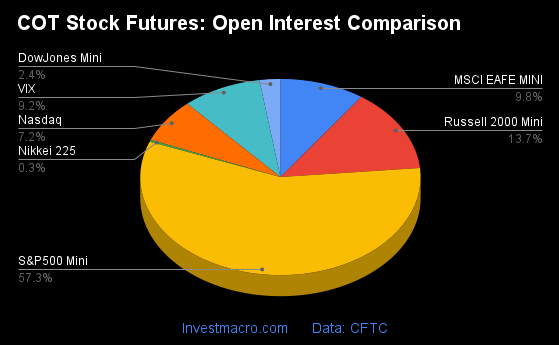
| S&P500-Mini | 2,670,454 | 61 | -65,083 | 55 | 21,495 | 43 | 43,588 | 55 |
| Nikkei 225 | 14,756 | 28 | -2,317 | 50 | 1,807 | 47 | 510 | 45 |
| Nasdaq-Mini | 337,236 | 100 | 8,104 | 51 | -10,817 | 31 | 2,713 | 90 |
| DowJones-Mini | 112,076 | 85 | 3,451 | 88 | 199 | 29 | -3,650 | 26 |
| VIX | 427,229 | 86 | -46,316 | 78 | 45,724 | 18 | 592 | 99 |
| Nikkei 225 Yen | 40,280 | 17 | 9,714 | 64 | -3,881 | 1 | -5,833 | 89 |
Strength Scores led by DowJones-Mini & VIX
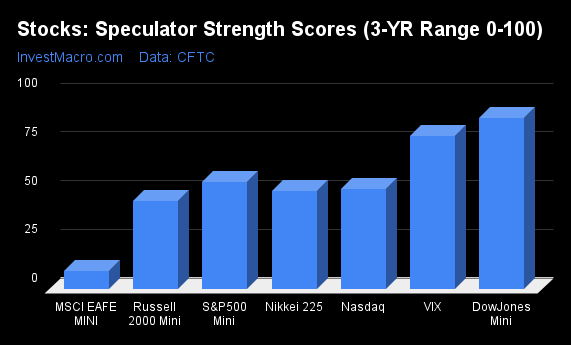
COT Strength Scores (a normalized measure of Speculator positions over a 3-Year range, from 0 to 100 where above 80 is Extreme-Bullish and below 20 is Extreme-Bearish) showed that the DowJones-Mini (88 percent) and the VIX (78 percent) lead the stock markets this week. The Nikkei 225 Yen (64 percent) and S&P500-Mini (55 percent) come in as the next highest in the weekly strength scores and above a 50 percent score.
On the downside, the MSCI EAFE-Mini (9 percent) comes in at the lowest strength level currently and is in Extreme-Bearish territory (below 20 percent).
Strength Statistics:
VIX (78.3 percent) vs VIX previous week (71.3 percent)
S&P500-Mini (55.0 percent) vs S&P500-Mini previous week (57.7 percent)
DowJones-Mini (87.6 percent) vs DowJones-Mini previous week (80.8 percent)
Nasdaq-Mini (51.4 percent) vs Nasdaq-Mini previous week (51.9 percent)
Russell2000-Mini (45.3 percent) vs Russell2000-Mini previous week (42.2 percent)
Nikkei USD (50.1 percent) vs Nikkei USD previous week (54.5 percent)
EAFE-Mini (9.3 percent) vs EAFE-Mini previous week (14.1 percent)
DowJones-Mini & Nikkei 225 Yen top the 6-Week Strength Trends
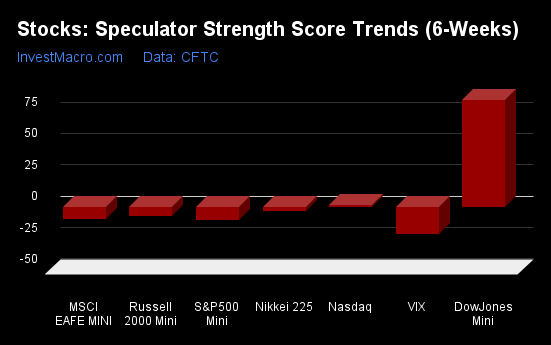
COT Strength Score Trends (or move index, calculates the 6-week changes in strength scores) showed that the DowJones-Mini (85 percent) overwhelmingly leads the past six weeks trends for the stock markets. The Nasdaq-Mini (2 percent) is the next highest positive movers in the latest trends data.
The VIX (-22 percent) leads the downside trend scores currently with the S&P500-Mini (-10 percent) coming in as the next market with lower trend scores.
Strength Trend Statistics:
VIX (-21.7 percent) vs VIX previous week (-23.6 percent)
S&P500-Mini (-10.4 percent) vs S&P500-Mini previous week (-8.6 percent)
DowJones-Mini (85.5 percent) vs DowJones-Mini previous week (78.4 percent)
Nasdaq-Mini (2.1 percent) vs Nasdaq-Mini previous week (8.8 percent)
Russell2000-Mini (-7.3 percent) vs Russell2000-Mini previous week (-7.4 percent)
Nikkei USD (-3.1 percent) vs Nikkei USD previous week (3.1 percent)
EAFE-Mini (-9.1 percent) vs EAFE-Mini previous week (-19.1 percent)
Individual Stock Market Charts:
VIX Volatility Futures:
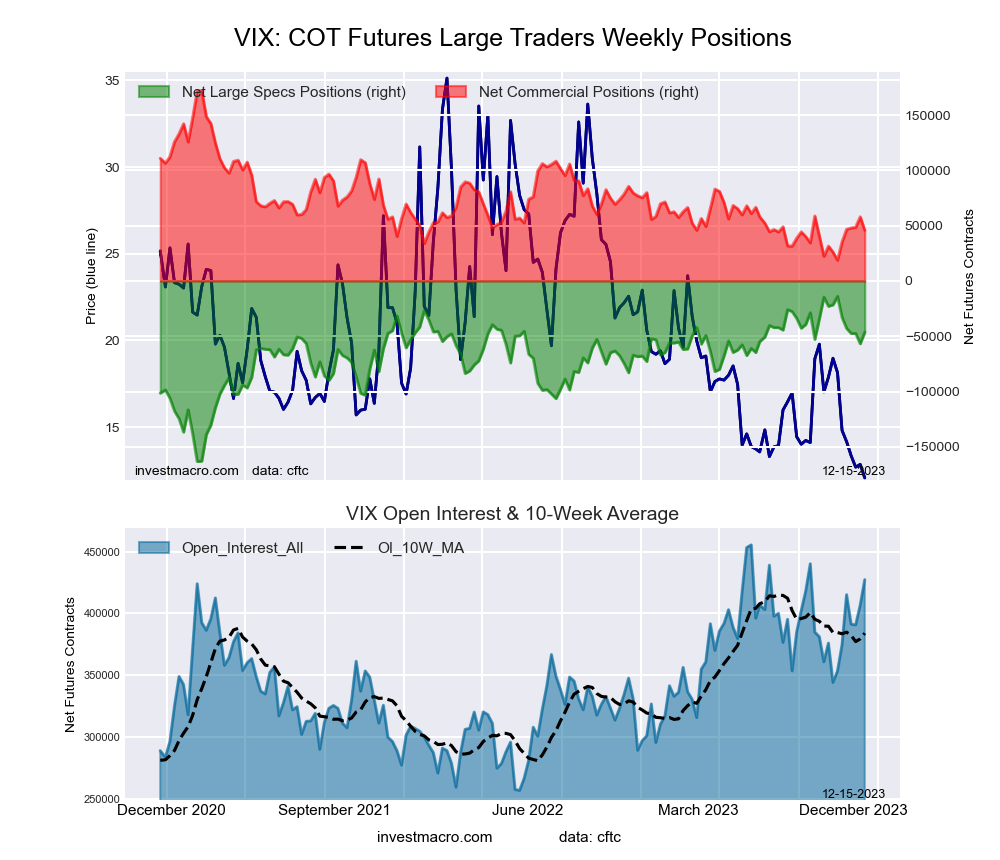 The VIX Volatility large speculator standing this week totaled a net position of -46,316 contracts in the data reported through Tuesday. This was a weekly rise of 10,461 contracts from the previous week which had a total of -56,777 net contracts.
This week’s current strength score (the trader positioning range over the past three years, measured from 0 to 100) shows the speculators are currently Bullish with a score of 78.3 percent. The commercials are Bearish-Extreme with a score of 17.6 percent and the small traders (not shown in chart) are Bullish-Extreme with a score of 99.5 percent.
Price Trend-Following Model: Strong Downtrend
Our weekly trend-following model classifies the current market price position as: Strong Downtrend. The current action for the model is considered to be: Hold – Maintain Short Position.
| VIX Volatility Futures Statistics | SPECULATORS | COMMERCIALS | SMALL TRADERS |
| – Percent of Open Interest Longs: | 22.8 | 47.6 | 7.3 |
| – Percent of Open Interest Shorts: | 33.7 | 36.9 | 7.2 |
| – Net Position: | -46,316 | 45,724 | 592 |
| – Gross Longs: | 97,484 | 203,215 | 31,240 |
| – Gross Shorts: | 143,800 | 157,491 | 30,648 |
| – Long to Short Ratio: | 0.7 to 1 | 1.3 to 1 | 1.0 to 1 |
| NET POSITION TREND: | |||
| – Strength Index Score (3 Year Range Pct): | 78.3 | 17.6 | 99.5 |
| – Strength Index Reading (3 Year Range): | Bullish | Bearish-Extreme | Bullish-Extreme |
| NET POSITION MOVEMENT INDEX: | |||
| – 6-Week Change in Strength Index: | -21.7 | 17.6 | 27.2 |
S&P500 Mini Futures:
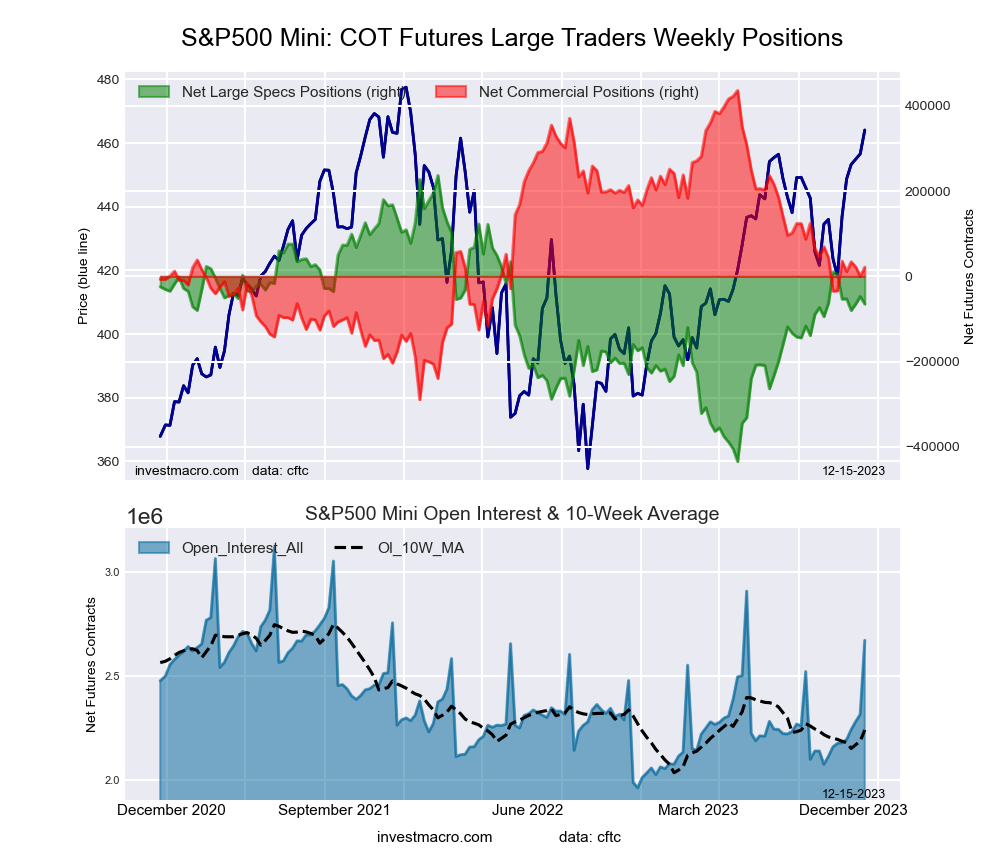 The S&P500 Mini large speculator standing this week totaled a net position of -65,083 contracts in the data reported through Tuesday. This was a weekly fall of -17,822 contracts from the previous week which had a total of -47,261 net contracts.
This week’s current strength score (the trader positioning range over the past three years, measured from 0 to 100) shows the speculators are currently Bullish with a score of 55.0 percent. The commercials are Bearish with a score of 42.9 percent and the small traders (not shown in chart) are Bullish with a score of 54.5 percent.
Price Trend-Following Model: Strong Uptrend
Our weekly trend-following model classifies the current market price position as: Strong Uptrend. The current action for the model is considered to be: New Buy – Long Position.
| S&P500 Mini Futures Statistics | SPECULATORS | COMMERCIALS | SMALL TRADERS |
| – Percent of Open Interest Longs: | 9.6 | 70.7 | 11.5 |
| – Percent of Open Interest Shorts: | 12.1 | 69.9 | 9.8 |
| – Net Position: | -65,083 | 21,495 | 43,588 |
| – Gross Longs: | 257,533 | 1,888,239 | 306,616 |
| – Gross Shorts: | 322,616 | 1,866,744 | 263,028 |
| – Long to Short Ratio: | 0.8 to 1 | 1.0 to 1 | 1.2 to 1 |
| NET POSITION TREND: | |||
| – Strength Index Score (3 Year Range Pct): | 55.0 | 42.9 | 54.5 |
| – Strength Index Reading (3 Year Range): | Bullish | Bearish | Bullish |
| NET POSITION MOVEMENT INDEX: | |||
| – 6-Week Change in Strength Index: | -10.4 | 7.7 | 5.5 |
Dow Jones Mini Futures:
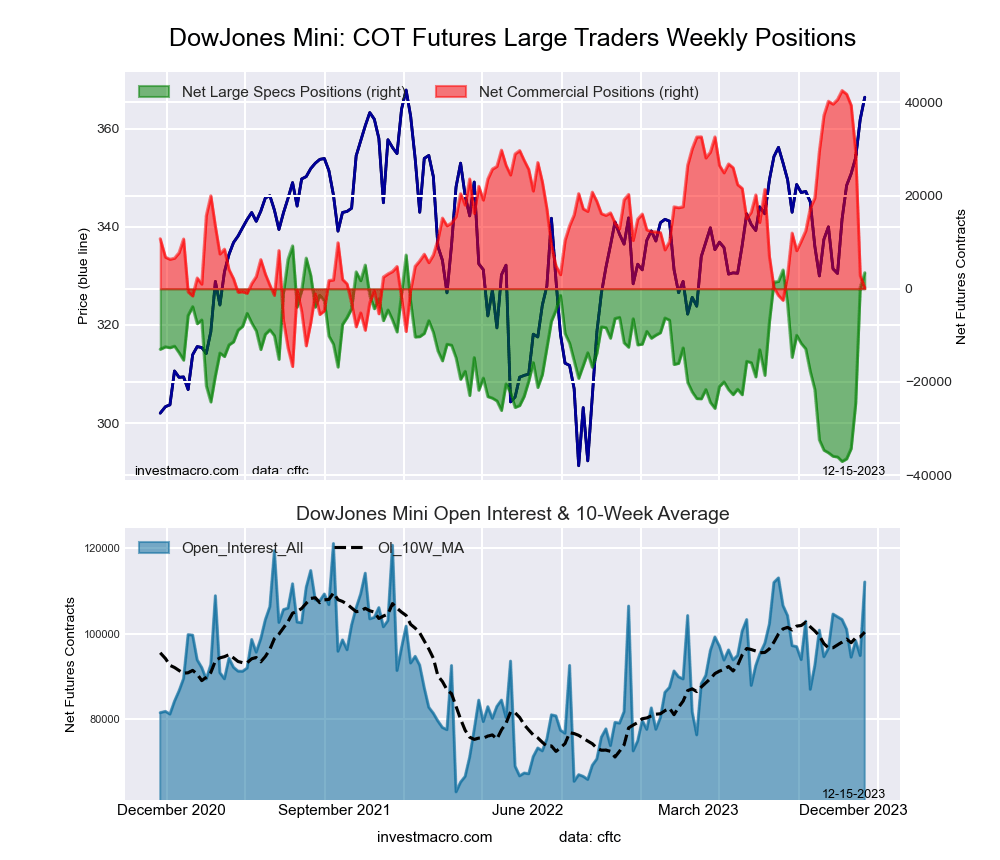 The Dow Jones Mini large speculator standing this week totaled a net position of 3,451 contracts in the data reported through Tuesday. This was a weekly boost of 3,143 contracts from the previous week which had a total of 308 net contracts.
This week’s current strength score (the trader positioning range over the past three years, measured from 0 to 100) shows the speculators are currently Bullish-Extreme with a score of 87.6 percent. The commercials are Bearish with a score of 28.5 percent and the small traders (not shown in chart) are Bearish with a score of 26.1 percent.
Price Trend-Following Model: Strong Uptrend
Our weekly trend-following model classifies the current market price position as: Strong Uptrend. The current action for the model is considered to be: Hold – Maintain Long Position.
| Dow Jones Mini Futures Statistics | SPECULATORS | COMMERCIALS | SMALL TRADERS |
| – Percent of Open Interest Longs: | 23.2 | 58.7 | 12.8 |
| – Percent of Open Interest Shorts: | 20.1 | 58.5 | 16.0 |
| – Net Position: | 3,451 | 199 | -3,650 |
| – Gross Longs: | 25,968 | 65,779 | 14,302 |
| – Gross Shorts: | 22,517 | 65,580 | 17,952 |
| – Long to Short Ratio: | 1.2 to 1 | 1.0 to 1 | 0.8 to 1 |
| NET POSITION TREND: | |||
| – Strength Index Score (3 Year Range Pct): | 87.6 | 28.5 | 26.1 |
| – Strength Index Reading (3 Year Range): | Bullish-Extreme | Bearish | Bearish |
| NET POSITION MOVEMENT INDEX: | |||
| – 6-Week Change in Strength Index: | 85.5 | -68.2 | 4.2 |
Nasdaq Mini Futures:
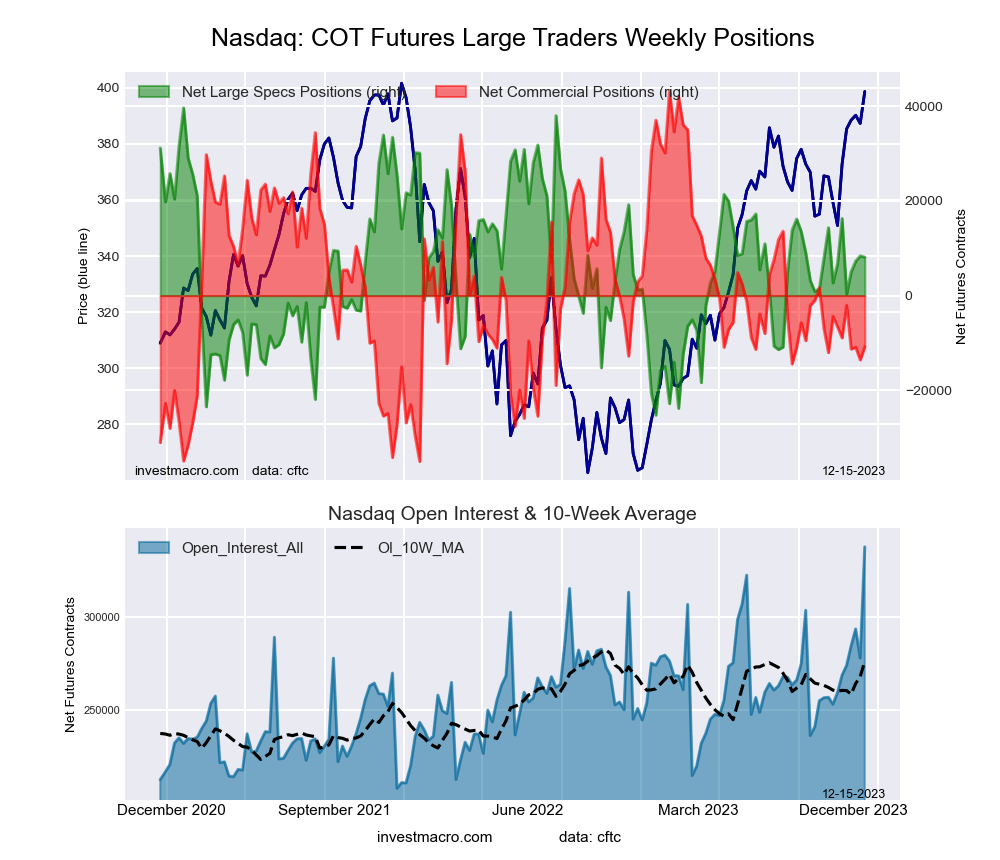 The Nasdaq Mini large speculator standing this week totaled a net position of 8,104 contracts in the data reported through Tuesday. This was a weekly lowering of -298 contracts from the previous week which had a total of 8,402 net contracts.
This week’s current strength score (the trader positioning range over the past three years, measured from 0 to 100) shows the speculators are currently Bullish with a score of 51.4 percent. The commercials are Bearish with a score of 30.9 percent and the small traders (not shown in chart) are Bullish-Extreme with a score of 89.9 percent.
Price Trend-Following Model: Strong Uptrend
Our weekly trend-following model classifies the current market price position as: Strong Uptrend. The current action for the model is considered to be: Hold – Maintain Long Position.
| Nasdaq Mini Futures Statistics | SPECULATORS | COMMERCIALS | SMALL TRADERS |
| – Percent of Open Interest Longs: | 21.2 | 62.9 | 13.2 |
| – Percent of Open Interest Shorts: | 18.8 | 66.1 | 12.4 |
| – Net Position: | 8,104 | -10,817 | 2,713 |
| – Gross Longs: | 71,616 | 212,001 | 44,538 |
| – Gross Shorts: | 63,512 | 222,818 | 41,825 |
| – Long to Short Ratio: | 1.1 to 1 | 1.0 to 1 | 1.1 to 1 |
| NET POSITION TREND: | |||
| – Strength Index Score (3 Year Range Pct): | 51.4 | 30.9 | 89.9 |
| – Strength Index Reading (3 Year Range): | Bullish | Bearish | Bullish-Extreme |
| NET POSITION MOVEMENT INDEX: | |||
| – 6-Week Change in Strength Index: | 2.1 | -5.4 | 8.2 |
Russell 2000 Mini Futures:
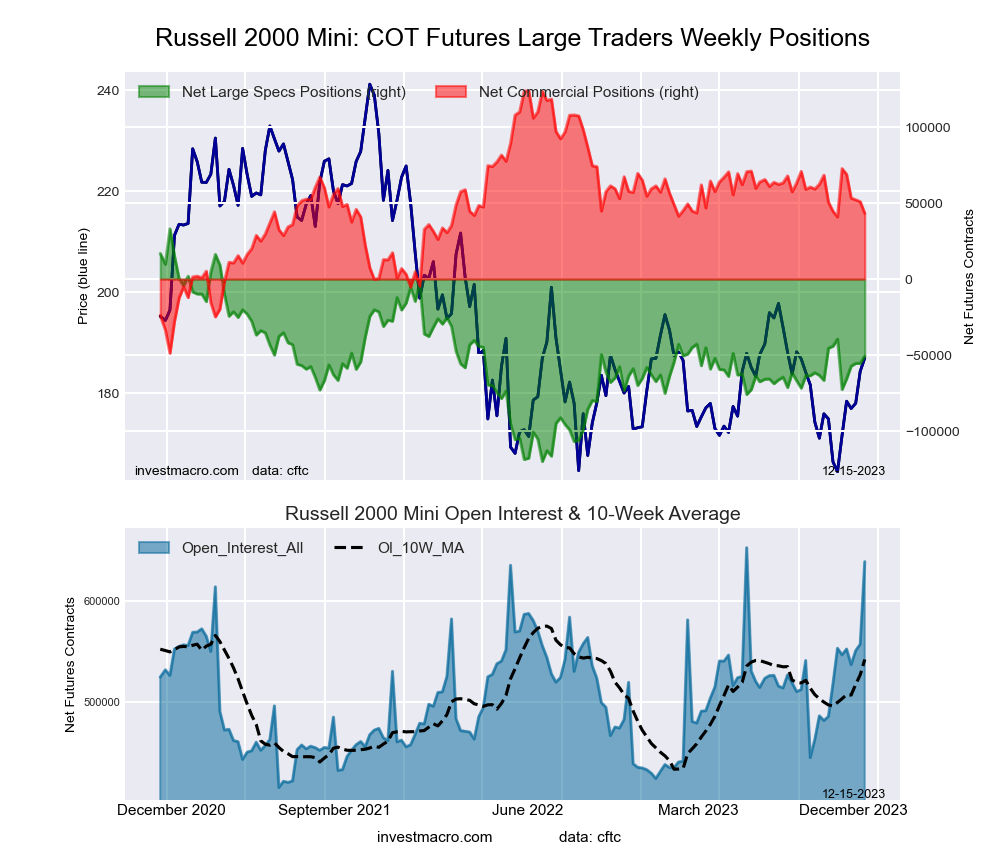 The Russell 2000 Mini large speculator standing this week totaled a net position of -50,629 contracts in the data reported through Tuesday. This was a weekly boost of 4,800 contracts from the previous week which had a total of -55,429 net contracts.
This week’s current strength score (the trader positioning range over the past three years, measured from 0 to 100) shows the speculators are currently Bearish with a score of 45.3 percent. The commercials are Bullish with a score of 53.2 percent and the small traders (not shown in chart) are Bearish with a score of 49.5 percent.
Price Trend-Following Model: Weak Downtrend (Possible Trend Change)
Our weekly trend-following model classifies the current market price position as: Weak Downtrend. The current action for the model is considered to be: Hold – Maintain Short Position.
| Russell 2000 Mini Futures Statistics | SPECULATORS | COMMERCIALS | SMALL TRADERS |
| – Percent of Open Interest Longs: | 10.2 | 80.4 | 6.2 |
| – Percent of Open Interest Shorts: | 18.2 | 73.6 | 5.0 |
| – Net Position: | -50,629 | 43,204 | 7,425 |
| – Gross Longs: | 65,483 | 513,991 | 39,542 |
| – Gross Shorts: | 116,112 | 470,787 | 32,117 |
| – Long to Short Ratio: | 0.6 to 1 | 1.1 to 1 | 1.2 to 1 |
| NET POSITION TREND: | |||
| – Strength Index Score (3 Year Range Pct): | 45.3 | 53.2 | 49.5 |
| – Strength Index Reading (3 Year Range): | Bearish | Bullish | Bearish |
| NET POSITION MOVEMENT INDEX: | |||
| – 6-Week Change in Strength Index: | -7.3 | 1.3 | 27.4 |
Nikkei Stock Average (USD) Futures:
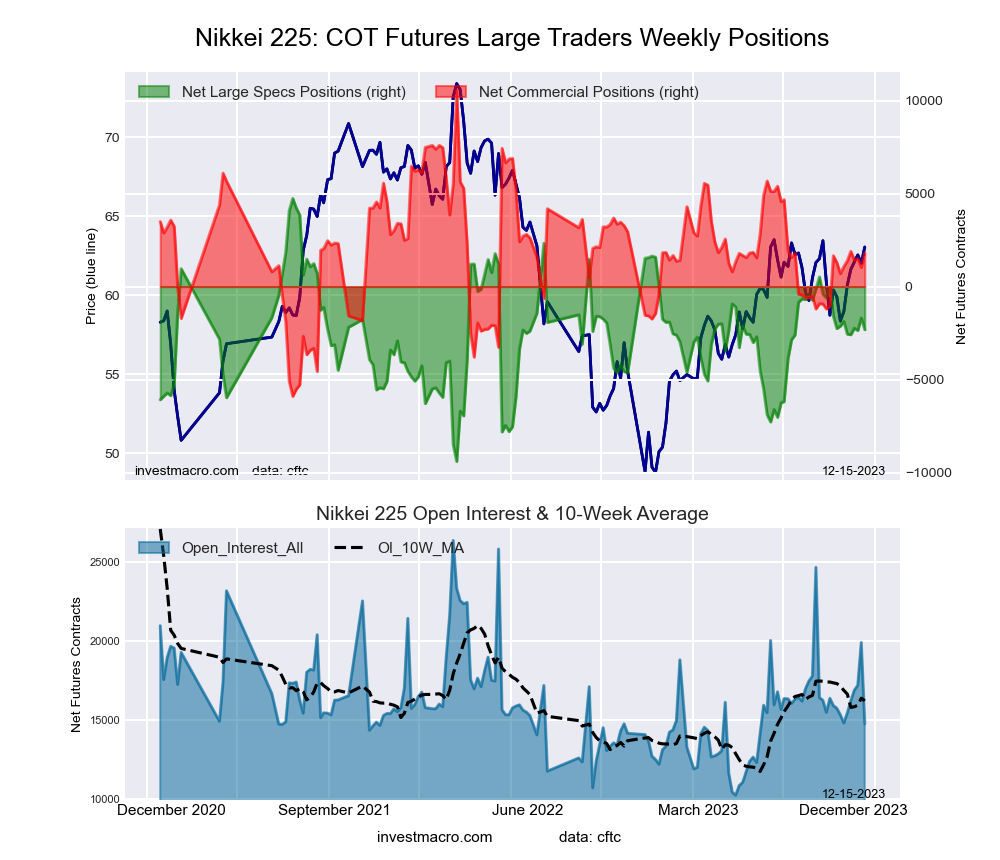 The Nikkei Stock Average (USD) large speculator standing this week totaled a net position of -2,317 contracts in the data reported through Tuesday. This was a weekly decline of -627 contracts from the previous week which had a total of -1,690 net contracts.
This week’s current strength score (the trader positioning range over the past three years, measured from 0 to 100) shows the speculators are currently Bullish with a score of 50.1 percent. The commercials are Bearish with a score of 46.9 percent and the small traders (not shown in chart) are Bearish with a score of 45.3 percent.
Price Trend-Following Model: Strong Uptrend
Our weekly trend-following model classifies the current market price position as: Strong Uptrend. The current action for the model is considered to be: New Buy – Long Position.
| Nikkei Stock Average Futures Statistics | SPECULATORS | COMMERCIALS | SMALL TRADERS |
| – Percent of Open Interest Longs: | 12.9 | 66.1 | 21.0 |
| – Percent of Open Interest Shorts: | 28.6 | 53.8 | 17.5 |
| – Net Position: | -2,317 | 1,807 | 510 |
| – Gross Longs: | 1,910 | 9,748 | 3,098 |
| – Gross Shorts: | 4,227 | 7,941 | 2,588 |
| – Long to Short Ratio: | 0.5 to 1 | 1.2 to 1 | 1.2 to 1 |
| NET POSITION TREND: | |||
| – Strength Index Score (3 Year Range Pct): | 50.1 | 46.9 | 45.3 |
| – Strength Index Reading (3 Year Range): | Bullish | Bearish | Bearish |
| NET POSITION MOVEMENT INDEX: | |||
| – 6-Week Change in Strength Index: | -3.1 | 4.4 | -4.6 |
MSCI EAFE Mini Futures:
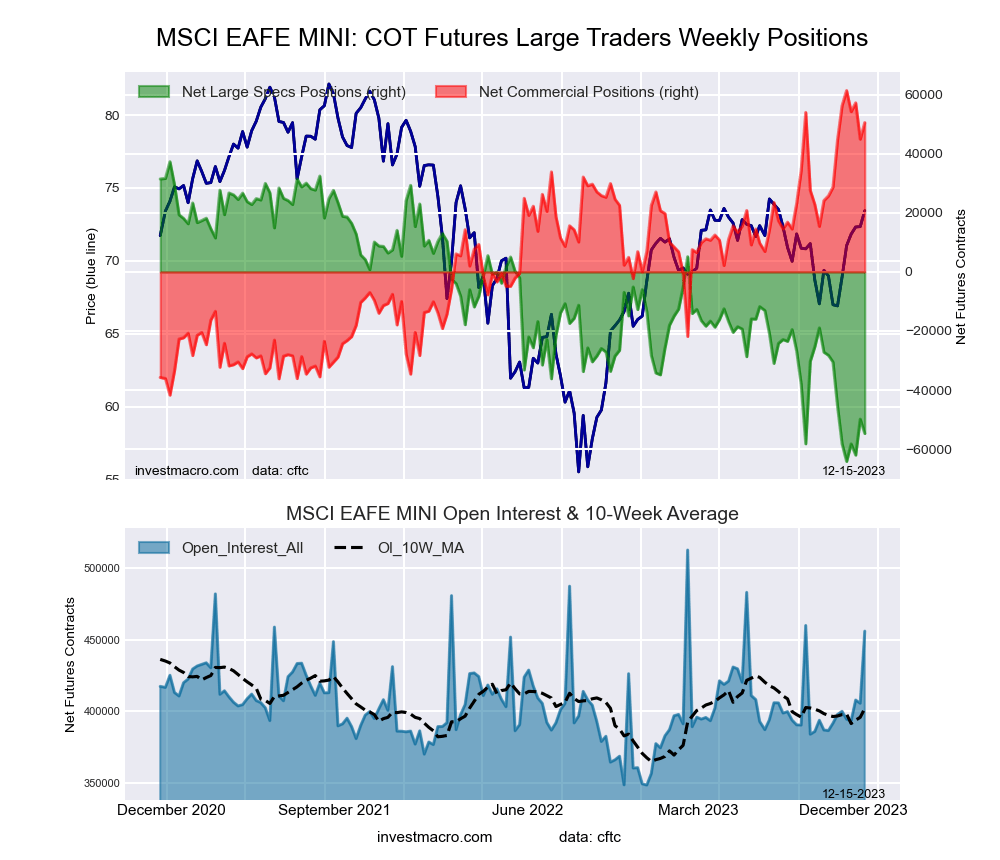 The MSCI EAFE Mini large speculator standing this week totaled a net position of -54,709 contracts in the data reported through Tuesday. This was a weekly decline of -4,851 contracts from the previous week which had a total of -49,858 net contracts.
This week’s current strength score (the trader positioning range over the past three years, measured from 0 to 100) shows the speculators are currently Bearish-Extreme with a score of 9.3 percent. The commercials are Bullish-Extreme with a score of 89.5 percent and the small traders (not shown in chart) are Bearish with a score of 37.7 percent.
Price Trend-Following Model: Strong Uptrend
Our weekly trend-following model classifies the current market price position as: Strong Uptrend. The current action for the model is considered to be: New Buy – Long Position.
| MSCI EAFE Mini Futures Statistics | SPECULATORS | COMMERCIALS | SMALL TRADERS |
| – Percent of Open Interest Longs: | 5.0 | 92.0 | 2.2 |
| – Percent of Open Interest Shorts: | 17.0 | 81.0 | 1.2 |
| – Net Position: | -54,709 | 50,564 | 4,145 |
| – Gross Longs: | 22,631 | 419,808 | 9,840 |
| – Gross Shorts: | 77,340 | 369,244 | 5,695 |
| – Long to Short Ratio: | 0.3 to 1 | 1.1 to 1 | 1.7 to 1 |
| NET POSITION TREND: | |||
| – Strength Index Score (3 Year Range Pct): | 9.3 | 89.5 | 37.7 |
| – Strength Index Reading (3 Year Range): | Bearish-Extreme | Bullish-Extreme | Bearish |
| NET POSITION MOVEMENT INDEX: | |||
| – 6-Week Change in Strength Index: | -9.1 | 5.7 | 16.5 |
Article By InvestMacro – Receive our weekly COT Newsletter
*COT Report: The COT data, released weekly to the public each Friday, is updated through the most recent Tuesday (data is 3 days old) and shows a quick view of how large speculators or non-commercials (for-profit traders) were positioned in the futures markets.
The CFTC categorizes trader positions according to commercial hedgers (traders who use futures contracts for hedging as part of the business), non-commercials (large traders who speculate to realize trading profits) and nonreportable traders (usually small traders/speculators) as well as their open interest (contracts open in the market at time of reporting). See CFTC criteria here.

- Geopolitical and macroeconomic conditions continue to pressure market sentiment Jul 20, 2026
- USD/JPY Poised to Continue Gains as Expensive Oil and Lack of Support Weigh on Yen Jul 20, 2026
- COT Metals Charts: Weekly Speculator Bets led by Copper & Steel Jul 18, 2026
- COT Bonds Charts: Weekly Speculator Bets led by 2-Year, SOFR 3M & 5-Year Bonds Jul 18, 2026
- COT Energy Charts: Weekly Speculator Bets led by Brent Oil & Heating Oil Jul 18, 2026
- COT Soft Commodities Charts: Weekly Speculator Bets led by Wheat, Corn & Soybean Meal Jul 18, 2026
- The Bank of Canada kept its interest rate unchanged. Platinum prices reached a three‑week high Jul 16, 2026
- Stock indices rose after the release of US inflation data. China’s GDP slowed sharply Jul 15, 2026
- GBP/USD Awaits Political News: What Will Happen Next Jul 15, 2026
- USD/JPY Holds at Highs: Pressure Lingers on Yen Jul 14, 2026