By InvestMacro
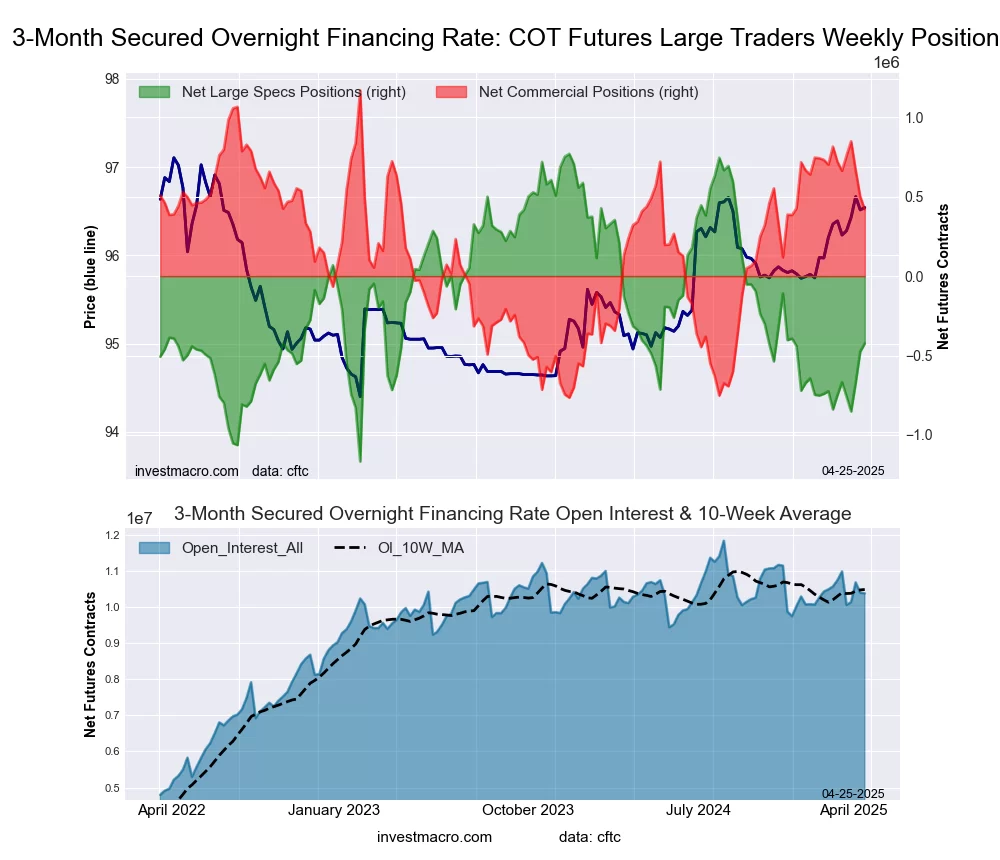
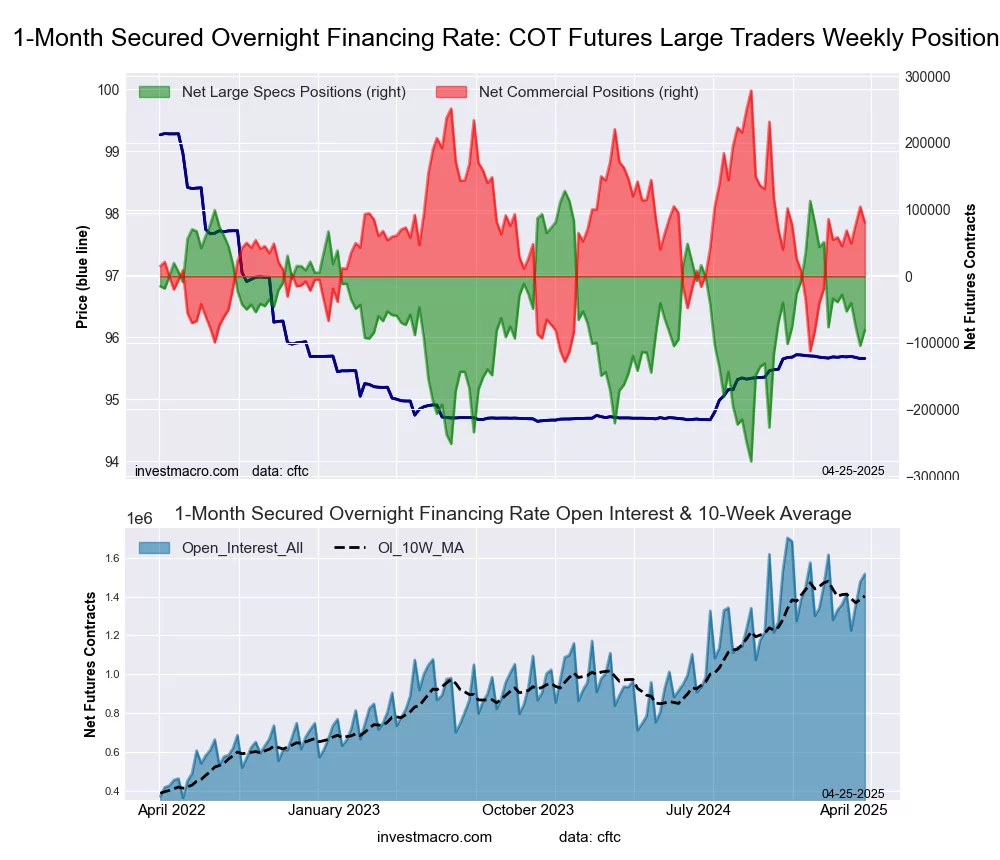
Here are the latest charts and statistics for the Commitment of Traders (COT) data published by the Commodities Futures Trading Commission (CFTC).
The latest COT data is updated through Tuesday April 29th and shows a quick view of how large market participants (for-profit speculators and commercial traders) were positioned in the futures markets. All currency positions are in direct relation to the US dollar where, for example, a bet for the euro is a bet that the euro will rise versus the dollar while a bet against the euro will be a bet that the euro will decline versus the dollar.
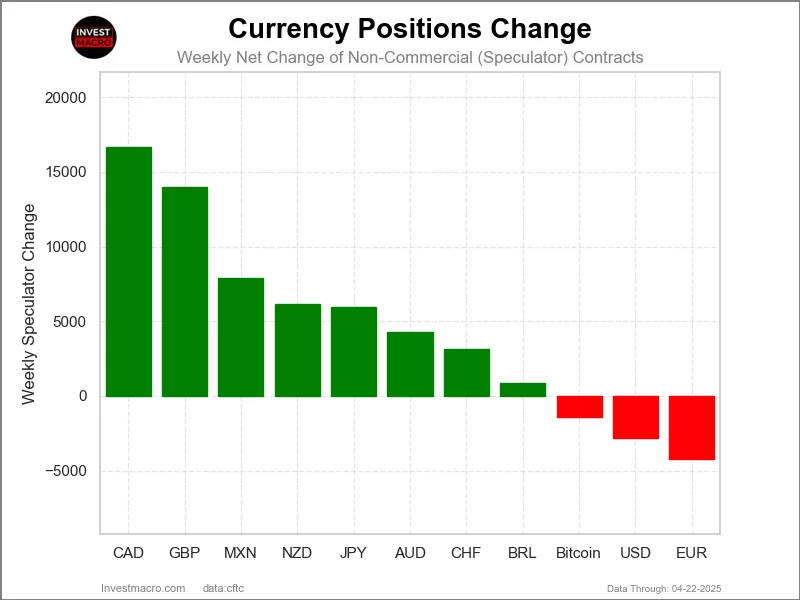
Weekly Speculator Changes led by Brazilian Real & Mexican Peso

The COT currency market speculator bets were overall higher this week as nine out of the eleven currency markets we cover had higher positioning while the other two markets had lower speculator contracts.
Leading the gains for the currency markets was the Brazilian Real (18,451 contracts) with the Mexican Peso (18,347 contracts), the EuroFX (10,769 contracts), the New Zealand Dollar (5,372 contracts), the Australian Dollar (4,639 contracts), the British Pound (3,469 contracts), the Japanese Yen (1,398 contracts), the Swiss Franc (1,160 contracts) and the US Dollar Index (525 contracts) also showing positive weeks.
The currencies seeing declines in speculator bets were Bitcoin (-425 contracts) and with the Canadian Dollar (-38 contracts) also seeing a tiny decline on the week.
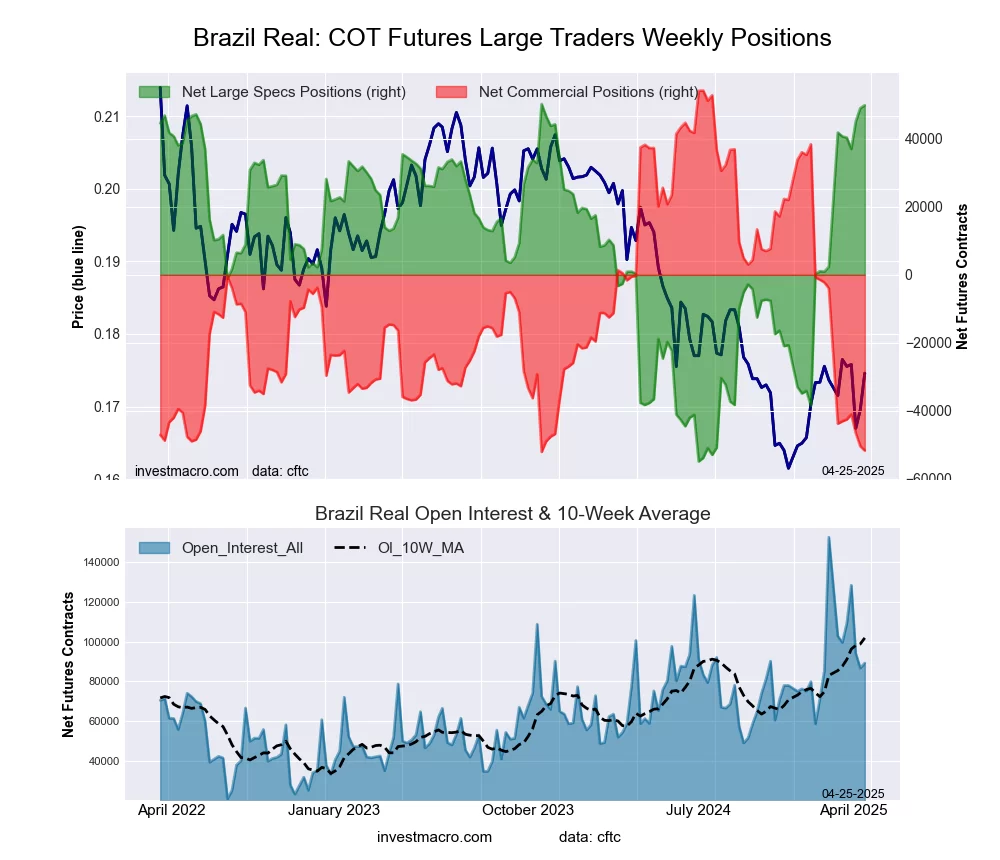
Speculators boost Brazilian Real and Japanese Yen Bets to New Record Highs
Highlighting the COT currency’s data this week is new record high speculator levels for the both the Brazilian real and Japanese yen.
First up, the Brazilian real rose by over +18,000 contracts this week and have now risen for four straight weeks (by a total of over 31,000 contracts) to land at a total of 68,338 contracts. This is now the highest on record and surpasses the previous high of +50,496 contracts that was established on March 8th of 2022.
This has been sharp and swift turnaround for the BRL as net positions were negative as recent as January 28th. The overall net position had been in bearish territory from May 7th of 2024 continuously through January 28th of 2025 before turning bullish. February 4th saw a huge jump by over +38,000 contracts in just that week and set in motion the current bullish sentiment trend.
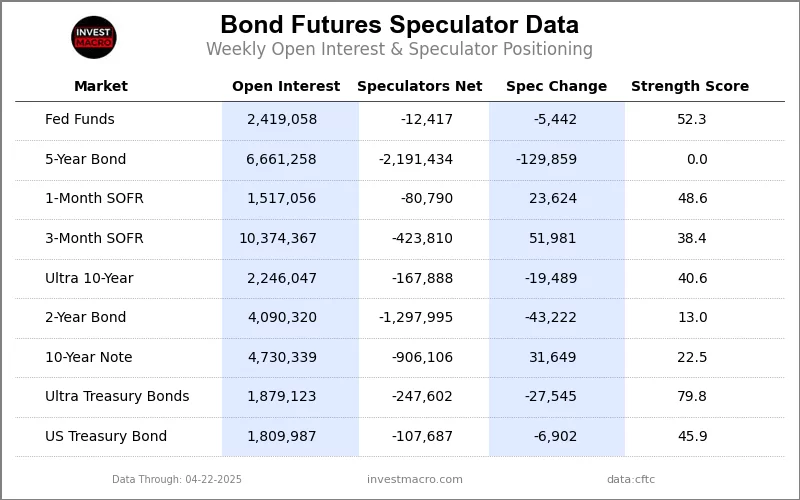
Currencies Data:

Legend: Open Interest | Speculators Current Net Position | Weekly Specs Change | Specs Strength Score compared to last 3-Years (0-100 range)
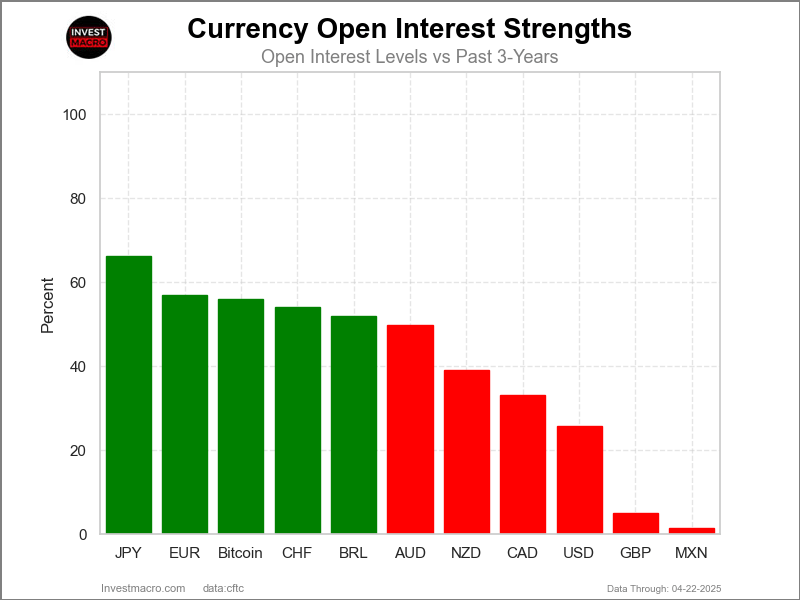
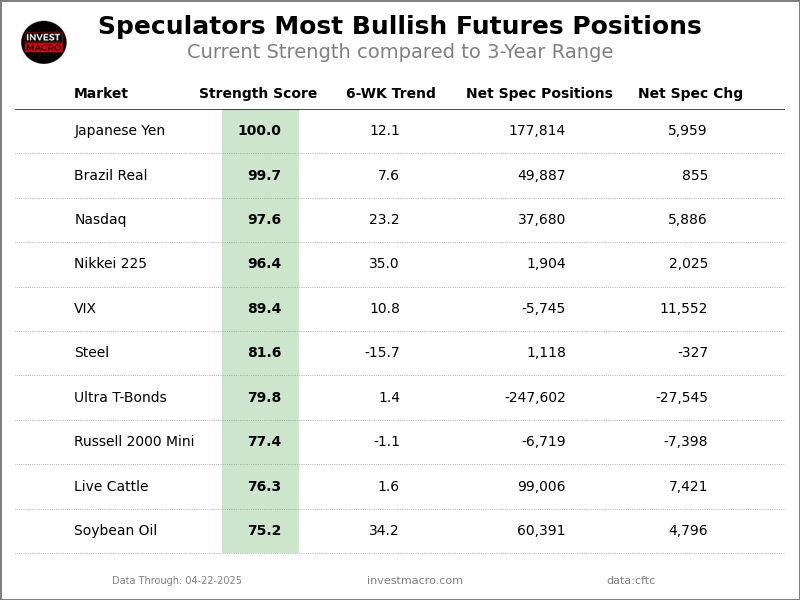
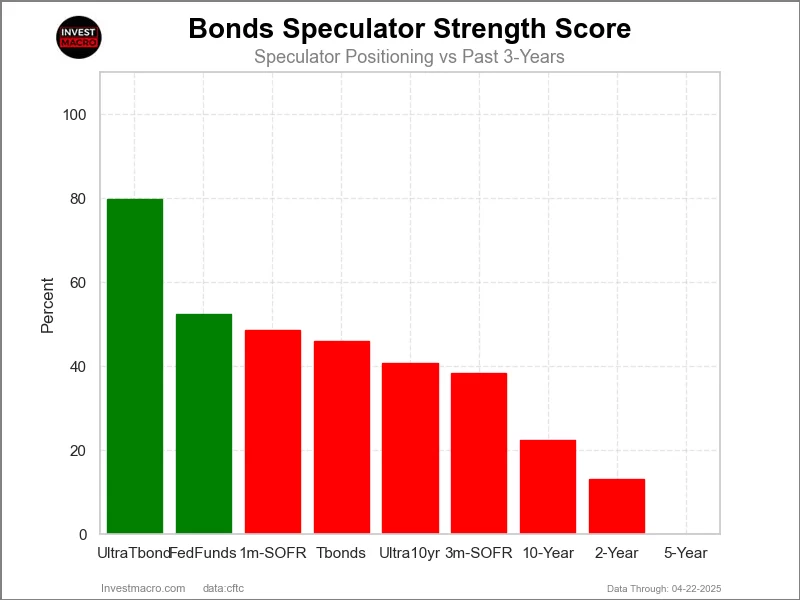
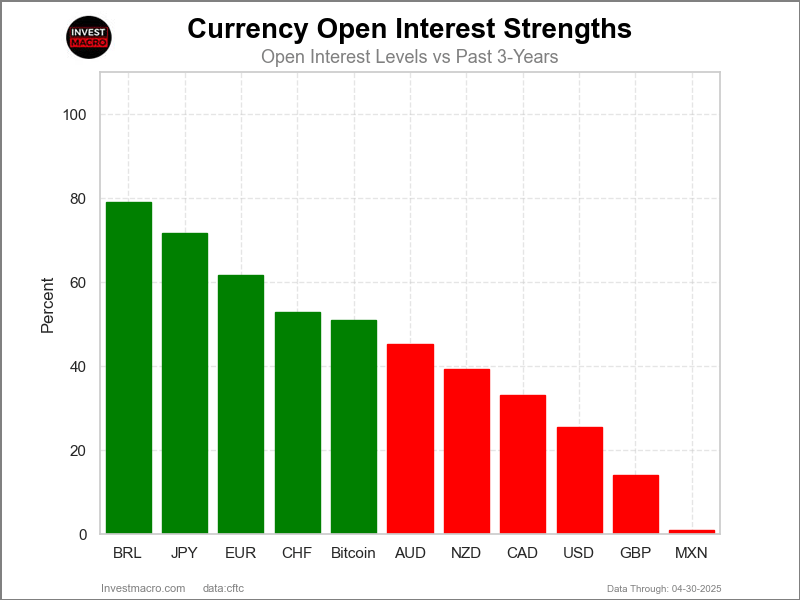
Strength Scores led by Japanese Yen & Brazilian Real

COT Strength Scores (a normalized measure of Speculator positions over a 3-Year range, from 0 to 100 where above 80 is Extreme-Bullish and below 20 is Extreme-Bearish) showed that the Japanese Yen (100 percent) and the Brazilian Real (100 percent) lead the currency markets this week. The Mexican Peso (59 percent), EuroFX (58 percent) and the Canadian Dollar (58 percent) come in as the next highest in the weekly strength scores.
On the downside, the US Dollar Index (6 percent) comes in at the lowest strength level currently and is in Extreme-Bearish territory (below 20 percent). The next lowest strength scores are Bitcoin (24 percent), the New Zealand Dollar (40 percent) and the Australian Dollar (41 percent).
3-Year Strength Statistics:
US Dollar Index (5.8 percent) vs US Dollar Index previous week (4.7 percent)
EuroFX (57.6 percent) vs EuroFX previous week (53.5 percent)
British Pound Sterling (46.9 percent) vs British Pound Sterling previous week (45.3 percent)
Japanese Yen (100.0 percent) vs Japanese Yen previous week (99.6 percent)
Swiss Franc (51.6 percent) vs Swiss Franc previous week (49.3 percent)
Canadian Dollar (57.8 percent) vs Canadian Dollar previous week (57.9 percent)
Australian Dollar (40.9 percent) vs Australian Dollar previous week (37.6 percent)
New Zealand Dollar (39.6 percent) vs New Zealand Dollar previous week (33.4 percent)
Mexican Peso (59.1 percent) vs Mexican Peso previous week (49.7 percent)
Brazilian Real (100.0 percent) vs Brazilian Real previous week (85.0 percent)
Bitcoin (24.4 percent) vs Bitcoin previous week (33.7 percent)
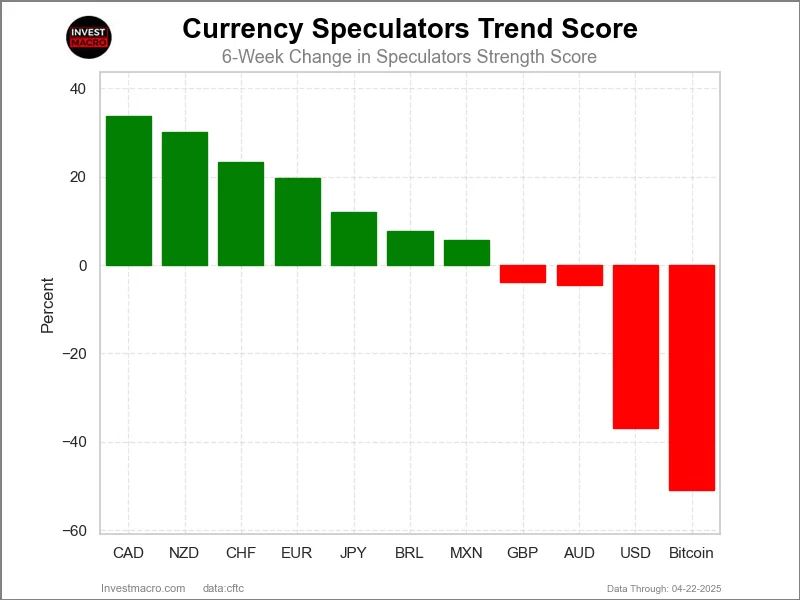
Canadian Dollar & New Zealand Dollar top the 6-Week Strength Trends

COT Strength Score Trends (or move index, calculates the 6-week changes in strength scores) showed that the Canadian Dollar (31 percent) and the New Zealand Dollar (22 percent) lead the past six weeks trends for the currencies. The Brazilian Real (22 percent), the Swiss Franc (20 percent) and the Japanese Yen (15 percent) are the next highest positive movers in the 3-Year trends data.
Bitcoin (-67 percent) leads the downside trend scores currently with the US Dollar Index (-16 percent) and the British Pound (-2 percent) following next with lower trend scores.
3-Year Strength Trends:
US Dollar Index (-15.8 percent) vs US Dollar Index previous week (-36.9 percent)
EuroFX (6.2 percent) vs EuroFX previous week (19.8 percent)
British Pound Sterling (-2.4 percent) vs British Pound Sterling previous week (-3.9 percent)
Japanese Yen (15.5 percent) vs Japanese Yen previous week (12.1 percent)
Swiss Franc (20.4 percent) vs Swiss Franc previous week (23.3 percent)
Canadian Dollar (31.1 percent) vs Canadian Dollar previous week (33.7 percent)
Australian Dollar (14.5 percent) vs Australian Dollar previous week (-4.5 percent)
New Zealand Dollar (21.9 percent) vs New Zealand Dollar previous week (30.1 percent)
Mexican Peso (1.8 percent) vs Mexican Peso previous week (5.7 percent)
Brazilian Real (22.4 percent) vs Brazilian Real previous week (6.5 percent)
Bitcoin (-67.0 percent) vs Bitcoin previous week (-50.9 percent)
Individual COT Forex Markets:
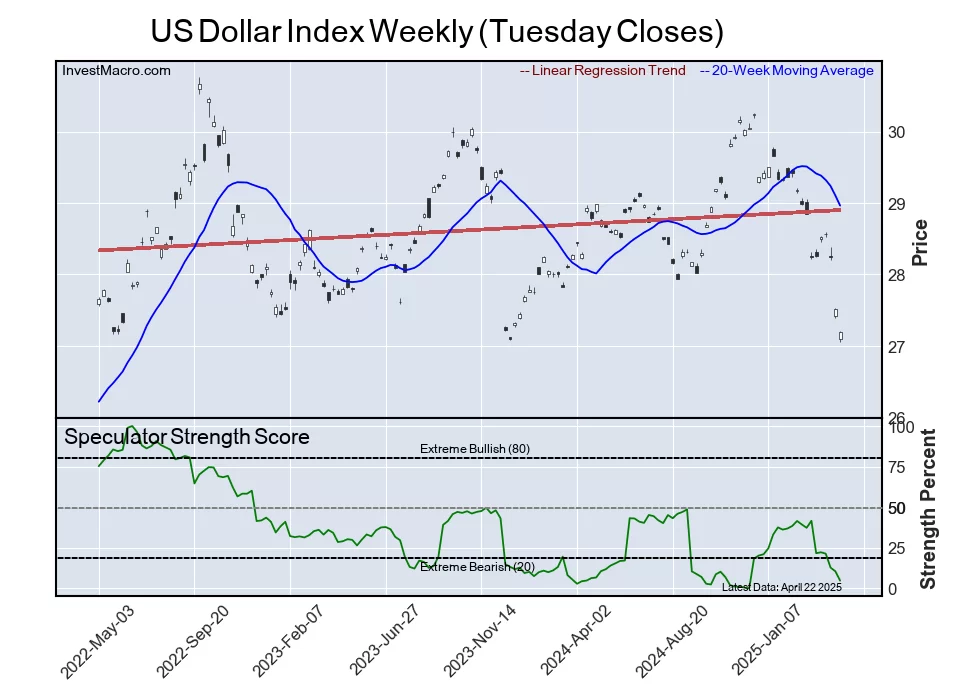
US Dollar Index Futures:
 The US Dollar Index large speculator standing this week reached a net position of -449 contracts in the data reported through Tuesday. This was a weekly gain of 525 contracts from the previous week which had a total of -974 net contracts.
This week’s current strength score (the trader positioning range over the past three years, measured from 0 to 100) shows the speculators are currently Bearish-Extreme with a score of 5.8 percent. The commercials are Bullish-Extreme with a score of 97.1 percent and the small traders (not shown in chart) are Bearish-Extreme with a score of 15.4 percent.
Price Trend-Following Model: Downtrend
Our weekly trend-following model classifies the current market price position as: Downtrend.
| US DOLLAR INDEX Statistics | SPECULATORS | COMMERCIALS | SMALL TRADERS |
| – Percent of Open Interest Longs: | 58.2 | 28.6 | 7.7 |
| – Percent of Open Interest Shorts: | 59.5 | 23.9 | 11.0 |
| – Net Position: | -449 | 1,548 | -1,099 |
| – Gross Longs: | 19,093 | 9,388 | 2,515 |
| – Gross Shorts: | 19,542 | 7,840 | 3,614 |
| – Long to Short Ratio: | 1.0 to 1 | 1.2 to 1 | 0.7 to 1 |
| NET POSITION TREND: | |||
| – Strength Index Score (3 Year Range Pct): | 5.8 | 97.1 | 15.4 |
| – Strength Index Reading (3 Year Range): | Bearish-Extreme | Bullish-Extreme | Bearish-Extreme |
| NET POSITION MOVEMENT INDEX: | |||
| – 6-Week Change in Strength Index: | -15.8 | 16.3 | -8.9 |
Euro Currency Futures:
 The Euro Currency large speculator standing this week reached a net position of 75,797 contracts in the data reported through Tuesday. This was a weekly gain of 10,769 contracts from the previous week which had a total of 65,028 net contracts.
This week’s current strength score (the trader positioning range over the past three years, measured from 0 to 100) shows the speculators are currently Bullish with a score of 57.6 percent. The commercials are Bearish with a score of 36.4 percent and the small traders (not shown in chart) are Bullish-Extreme with a score of 97.1 percent.
Price Trend-Following Model: Strong Uptrend
Our weekly trend-following model classifies the current market price position as: Strong Uptrend.
| EURO Currency Statistics | SPECULATORS | COMMERCIALS | SMALL TRADERS |
| – Percent of Open Interest Longs: | 26.9 | 55.0 | 13.3 |
| – Percent of Open Interest Shorts: | 16.5 | 73.0 | 5.7 |
| – Net Position: | 75,797 | -131,511 | 55,714 |
| – Gross Longs: | 196,388 | 401,746 | 97,376 |
| – Gross Shorts: | 120,591 | 533,257 | 41,662 |
| – Long to Short Ratio: | 1.6 to 1 | 0.8 to 1 | 2.3 to 1 |
| NET POSITION TREND: | |||
| – Strength Index Score (3 Year Range Pct): | 57.6 | 36.4 | 97.1 |
| – Strength Index Reading (3 Year Range): | Bullish | Bearish | Bullish-Extreme |
| NET POSITION MOVEMENT INDEX: | |||
| – 6-Week Change in Strength Index: | 6.2 | -13.3 | 50.6 |
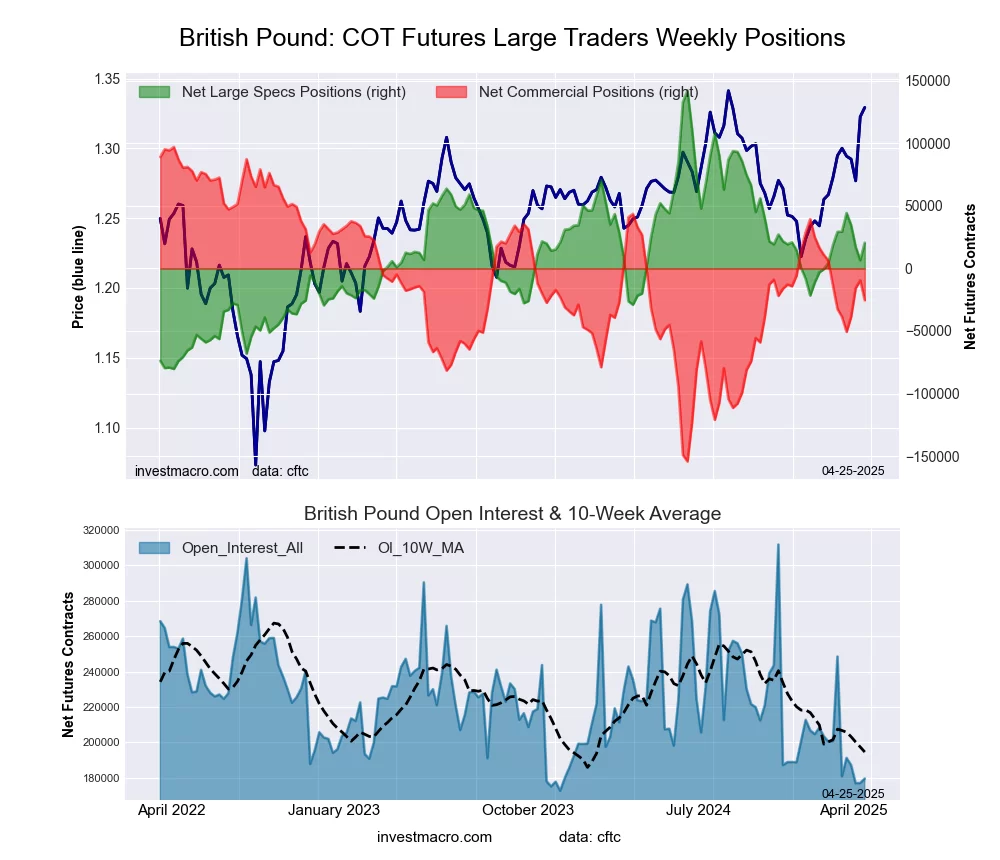
British Pound Sterling Futures:
 The British Pound Sterling large speculator standing this week reached a net position of 23,959 contracts in the data reported through Tuesday. This was a weekly advance of 3,469 contracts from the previous week which had a total of 20,490 net contracts.
This week’s current strength score (the trader positioning range over the past three years, measured from 0 to 100) shows the speculators are currently Bearish with a score of 46.9 percent. The commercials are Bearish with a score of 49.6 percent and the small traders (not shown in chart) are Bullish with a score of 74.3 percent.
Price Trend-Following Model: Strong Uptrend
Our weekly trend-following model classifies the current market price position as: Strong Uptrend.
| BRITISH POUND Statistics | SPECULATORS | COMMERCIALS | SMALL TRADERS |
| – Percent of Open Interest Longs: | 47.4 | 28.7 | 16.4 |
| – Percent of Open Interest Shorts: | 34.9 | 44.2 | 13.4 |
| – Net Position: | 23,959 | -29,723 | 5,764 |
| – Gross Longs: | 91,064 | 55,263 | 31,474 |
| – Gross Shorts: | 67,105 | 84,986 | 25,710 |
| – Long to Short Ratio: | 1.4 to 1 | 0.7 to 1 | 1.2 to 1 |
| NET POSITION TREND: | |||
| – Strength Index Score (3 Year Range Pct): | 46.9 | 49.6 | 74.3 |
| – Strength Index Reading (3 Year Range): | Bearish | Bearish | Bullish |
| NET POSITION MOVEMENT INDEX: | |||
| – 6-Week Change in Strength Index: | -2.4 | 3.6 | -7.5 |
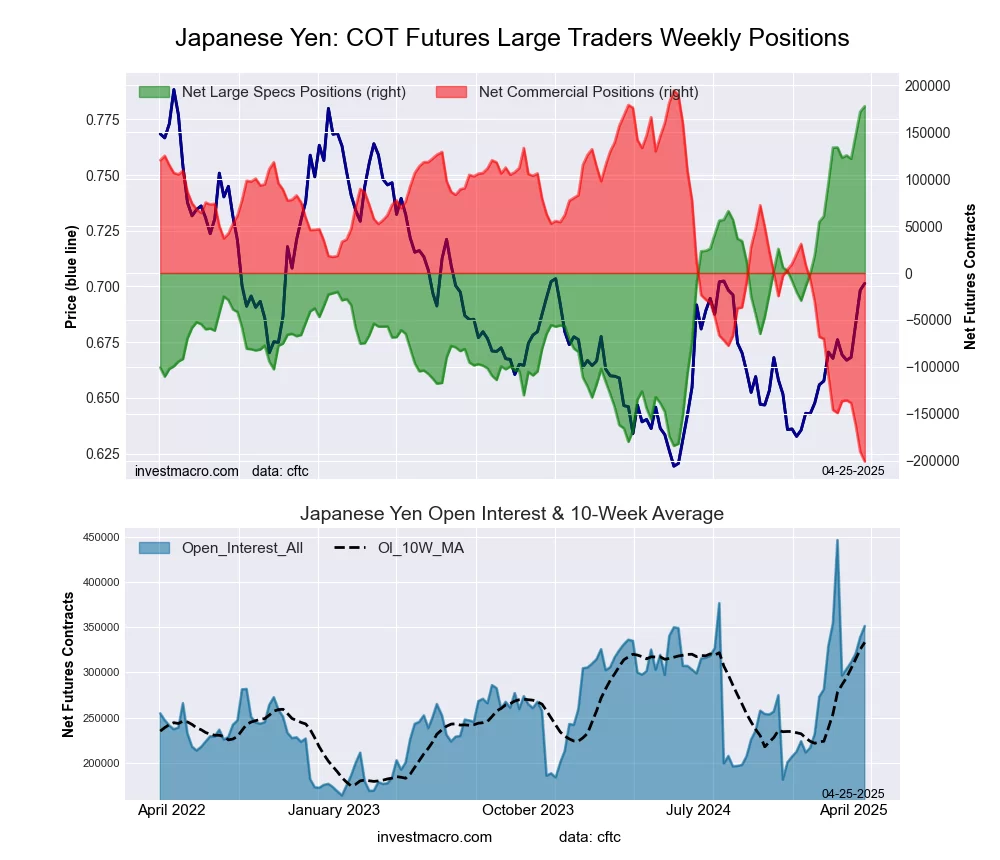
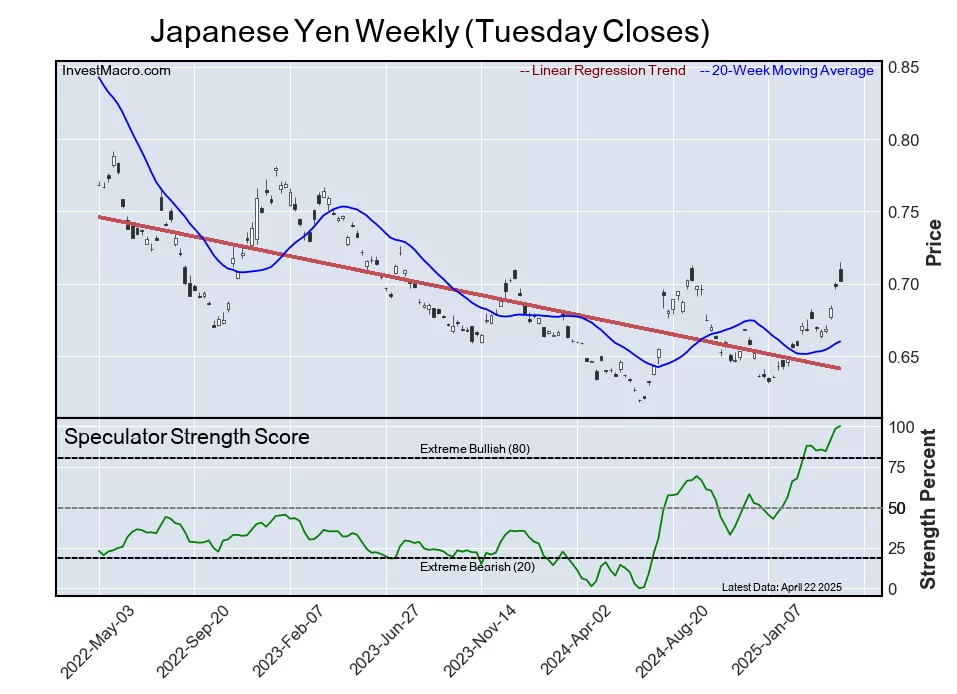
Japanese Yen Futures:
 The Japanese Yen large speculator standing this week reached a net position of 179,212 contracts in the data reported through Tuesday. This was a weekly advance of 1,398 contracts from the previous week which had a total of 177,814 net contracts.
This week’s current strength score (the trader positioning range over the past three years, measured from 0 to 100) shows the speculators are currently Bullish-Extreme with a score of 100.0 percent. The commercials are Bearish-Extreme with a score of 0.0 percent and the small traders (not shown in chart) are Bullish-Extreme with a score of 99.0 percent.
Price Trend-Following Model: Uptrend
Our weekly trend-following model classifies the current market price position as: Uptrend.
| JAPANESE YEN Statistics | SPECULATORS | COMMERCIALS | SMALL TRADERS |
| – Percent of Open Interest Longs: | 55.4 | 28.6 | 12.1 |
| – Percent of Open Interest Shorts: | 6.4 | 83.8 | 5.9 |
| – Net Position: | 179,212 | -201,897 | 22,685 |
| – Gross Longs: | 202,797 | 104,910 | 44,388 |
| – Gross Shorts: | 23,585 | 306,807 | 21,703 |
| – Long to Short Ratio: | 8.6 to 1 | 0.3 to 1 | 2.0 to 1 |
| NET POSITION TREND: | |||
| – Strength Index Score (3 Year Range Pct): | 100.0 | 0.0 | 99.0 |
| – Strength Index Reading (3 Year Range): | Bullish-Extreme | Bearish-Extreme | Bullish-Extreme |
| NET POSITION MOVEMENT INDEX: | |||
| – 6-Week Change in Strength Index: | 15.5 | -16.4 | 20.7 |
Swiss Franc Futures:
 The Swiss Franc large speculator standing this week reached a net position of -24,314 contracts in the data reported through Tuesday. This was a weekly boost of 1,160 contracts from the previous week which had a total of -25,474 net contracts.
This week’s current strength score (the trader positioning range over the past three years, measured from 0 to 100) shows the speculators are currently Bullish with a score of 51.6 percent. The commercials are Bearish with a score of 40.7 percent and the small traders (not shown in chart) are Bullish with a score of 74.7 percent.
Price Trend-Following Model: Strong Uptrend
Our weekly trend-following model classifies the current market price position as: Strong Uptrend.
| SWISS FRANC Statistics | SPECULATORS | COMMERCIALS | SMALL TRADERS |
| – Percent of Open Interest Longs: | 7.7 | 74.5 | 17.5 |
| – Percent of Open Interest Shorts: | 41.5 | 39.4 | 18.8 |
| – Net Position: | -24,314 | 25,264 | -950 |
| – Gross Longs: | 5,567 | 53,620 | 12,562 |
| – Gross Shorts: | 29,881 | 28,356 | 13,512 |
| – Long to Short Ratio: | 0.2 to 1 | 1.9 to 1 | 0.9 to 1 |
| NET POSITION TREND: | |||
| – Strength Index Score (3 Year Range Pct): | 51.6 | 40.7 | 74.7 |
| – Strength Index Reading (3 Year Range): | Bullish | Bearish | Bullish |
| NET POSITION MOVEMENT INDEX: | |||
| – 6-Week Change in Strength Index: | 20.4 | -28.9 | 32.6 |
Canadian Dollar Futures:
 The Canadian Dollar large speculator standing this week reached a net position of -67,205 contracts in the data reported through Tuesday. This was a weekly fall of -38 contracts from the previous week which had a total of -67,167 net contracts.
This week’s current strength score (the trader positioning range over the past three years, measured from 0 to 100) shows the speculators are currently Bullish with a score of 57.8 percent. The commercials are Bearish with a score of 45.5 percent and the small traders (not shown in chart) are Bearish with a score of 20.7 percent.
Price Trend-Following Model: Strong Uptrend
Our weekly trend-following model classifies the current market price position as: Strong Uptrend.
| CANADIAN DOLLAR Statistics | SPECULATORS | COMMERCIALS | SMALL TRADERS |
| – Percent of Open Interest Longs: | 6.4 | 83.5 | 9.1 |
| – Percent of Open Interest Shorts: | 33.4 | 53.3 | 12.4 |
| – Net Position: | -67,205 | 75,322 | -8,117 |
| – Gross Longs: | 16,046 | 208,156 | 22,693 |
| – Gross Shorts: | 83,251 | 132,834 | 30,810 |
| – Long to Short Ratio: | 0.2 to 1 | 1.6 to 1 | 0.7 to 1 |
| NET POSITION TREND: | |||
| – Strength Index Score (3 Year Range Pct): | 57.8 | 45.5 | 20.7 |
| – Strength Index Reading (3 Year Range): | Bullish | Bearish | Bearish |
| NET POSITION MOVEMENT INDEX: | |||
| – 6-Week Change in Strength Index: | 31.1 | -30.5 | 7.0 |
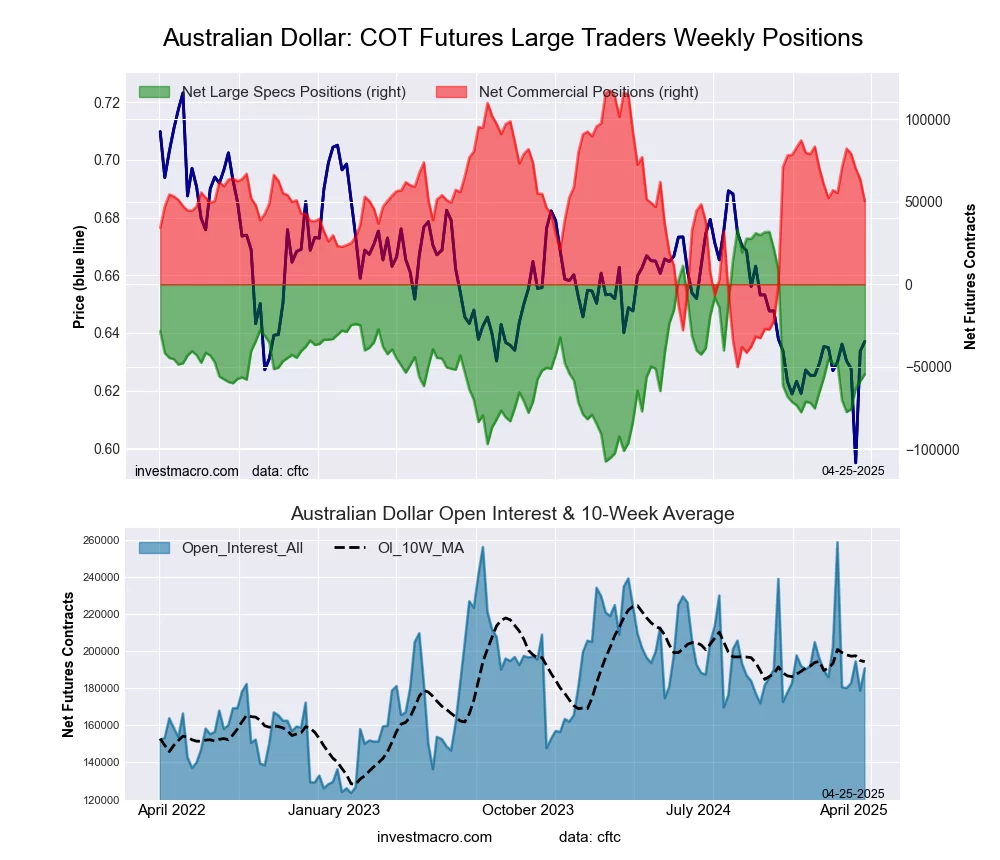
Australian Dollar Futures:
 The Australian Dollar large speculator standing this week reached a net position of -49,943 contracts in the data reported through Tuesday. This was a weekly gain of 4,639 contracts from the previous week which had a total of -54,582 net contracts.
This week’s current strength score (the trader positioning range over the past three years, measured from 0 to 100) shows the speculators are currently Bearish with a score of 40.9 percent. The commercials are Bullish with a score of 59.0 percent and the small traders (not shown in chart) are Bullish with a score of 52.1 percent.
Price Trend-Following Model: Strong Uptrend
Our weekly trend-following model classifies the current market price position as: Strong Uptrend.
| AUSTRALIAN DOLLAR Statistics | SPECULATORS | COMMERCIALS | SMALL TRADERS |
| – Percent of Open Interest Longs: | 14.4 | 66.6 | 12.4 |
| – Percent of Open Interest Shorts: | 41.4 | 40.2 | 11.8 |
| – Net Position: | -49,943 | 48,803 | 1,140 |
| – Gross Longs: | 26,602 | 123,079 | 22,967 |
| – Gross Shorts: | 76,545 | 74,276 | 21,827 |
| – Long to Short Ratio: | 0.3 to 1 | 1.7 to 1 | 1.1 to 1 |
| NET POSITION TREND: | |||
| – Strength Index Score (3 Year Range Pct): | 40.9 | 59.0 | 52.1 |
| – Strength Index Reading (3 Year Range): | Bearish | Bullish | Bullish |
| NET POSITION MOVEMENT INDEX: | |||
| – 6-Week Change in Strength Index: | 14.5 | -13.2 | 4.3 |
New Zealand Dollar Futures:
 The New Zealand Dollar large speculator standing this week reached a net position of -21,523 contracts in the data reported through Tuesday. This was a weekly gain of 5,372 contracts from the previous week which had a total of -26,895 net contracts.
This week’s current strength score (the trader positioning range over the past three years, measured from 0 to 100) shows the speculators are currently Bearish with a score of 39.6 percent. The commercials are Bullish with a score of 58.1 percent and the small traders (not shown in chart) are Bullish with a score of 56.2 percent.
Price Trend-Following Model: Strong Uptrend
Our weekly trend-following model classifies the current market price position as: Strong Uptrend.
| NEW ZEALAND DOLLAR Statistics | SPECULATORS | COMMERCIALS | SMALL TRADERS |
| – Percent of Open Interest Longs: | 19.3 | 73.0 | 6.7 |
| – Percent of Open Interest Shorts: | 53.4 | 39.3 | 6.3 |
| – Net Position: | -21,523 | 21,302 | 221 |
| – Gross Longs: | 12,170 | 46,070 | 4,201 |
| – Gross Shorts: | 33,693 | 24,768 | 3,980 |
| – Long to Short Ratio: | 0.4 to 1 | 1.9 to 1 | 1.1 to 1 |
| NET POSITION TREND: | |||
| – Strength Index Score (3 Year Range Pct): | 39.6 | 58.1 | 56.2 |
| – Strength Index Reading (3 Year Range): | Bearish | Bullish | Bullish |
| NET POSITION MOVEMENT INDEX: | |||
| – 6-Week Change in Strength Index: | 21.9 | -23.1 | 21.2 |
Mexican Peso Futures:
 The Mexican Peso large speculator standing this week reached a net position of 59,512 contracts in the data reported through Tuesday. This was a weekly gain of 18,347 contracts from the previous week which had a total of 41,165 net contracts.
This week’s current strength score (the trader positioning range over the past three years, measured from 0 to 100) shows the speculators are currently Bullish with a score of 59.1 percent. The commercials are Bearish with a score of 42.6 percent and the small traders (not shown in chart) are Bearish with a score of 33.6 percent.
Price Trend-Following Model: Strong Uptrend
Our weekly trend-following model classifies the current market price position as: Strong Uptrend.
| MEXICAN PESO Statistics | SPECULATORS | COMMERCIALS | SMALL TRADERS |
| – Percent of Open Interest Longs: | 64.5 | 30.2 | 4.3 |
| – Percent of Open Interest Shorts: | 18.4 | 77.8 | 2.8 |
| – Net Position: | 59,512 | -61,470 | 1,958 |
| – Gross Longs: | 83,287 | 39,019 | 5,554 |
| – Gross Shorts: | 23,775 | 100,489 | 3,596 |
| – Long to Short Ratio: | 3.5 to 1 | 0.4 to 1 | 1.5 to 1 |
| NET POSITION TREND: | |||
| – Strength Index Score (3 Year Range Pct): | 59.1 | 42.6 | 33.6 |
| – Strength Index Reading (3 Year Range): | Bullish | Bearish | Bearish |
| NET POSITION MOVEMENT INDEX: | |||
| – 6-Week Change in Strength Index: | 1.8 | -2.6 | 8.8 |
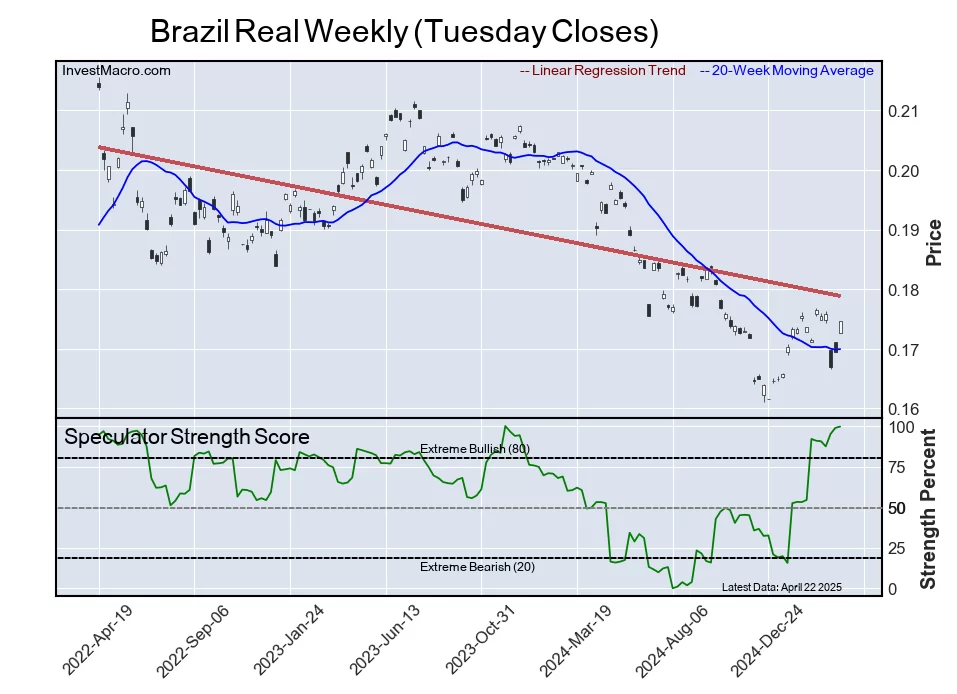
Brazilian Real Futures:
 The Brazilian Real large speculator standing this week reached a net position of 68,338 contracts in the data reported through Tuesday. This was a weekly boost of 18,451 contracts from the previous week which had a total of 49,887 net contracts.
This week’s current strength score (the trader positioning range over the past three years, measured from 0 to 100) shows the speculators are currently Bullish-Extreme with a score of 100.0 percent. The commercials are Bearish-Extreme with a score of 0.0 percent and the small traders (not shown in chart) are Bearish with a score of 33.5 percent.
Price Trend-Following Model: Strong Uptrend
Our weekly trend-following model classifies the current market price position as: Strong Uptrend.
| BRAZIL REAL Statistics | SPECULATORS | COMMERCIALS | SMALL TRADERS |
| – Percent of Open Interest Longs: | 64.9 | 32.0 | 2.9 |
| – Percent of Open Interest Shorts: | 10.2 | 88.5 | 1.1 |
| – Net Position: | 68,338 | -70,574 | 2,236 |
| – Gross Longs: | 81,037 | 39,953 | 3,636 |
| – Gross Shorts: | 12,699 | 110,527 | 1,400 |
| – Long to Short Ratio: | 6.4 to 1 | 0.4 to 1 | 2.6 to 1 |
| NET POSITION TREND: | |||
| – Strength Index Score (3 Year Range Pct): | 100.0 | 0.0 | 33.5 |
| – Strength Index Reading (3 Year Range): | Bullish-Extreme | Bearish-Extreme | Bearish |
| NET POSITION MOVEMENT INDEX: | |||
| – 6-Week Change in Strength Index: | 22.4 | -22.0 | -0.6 |
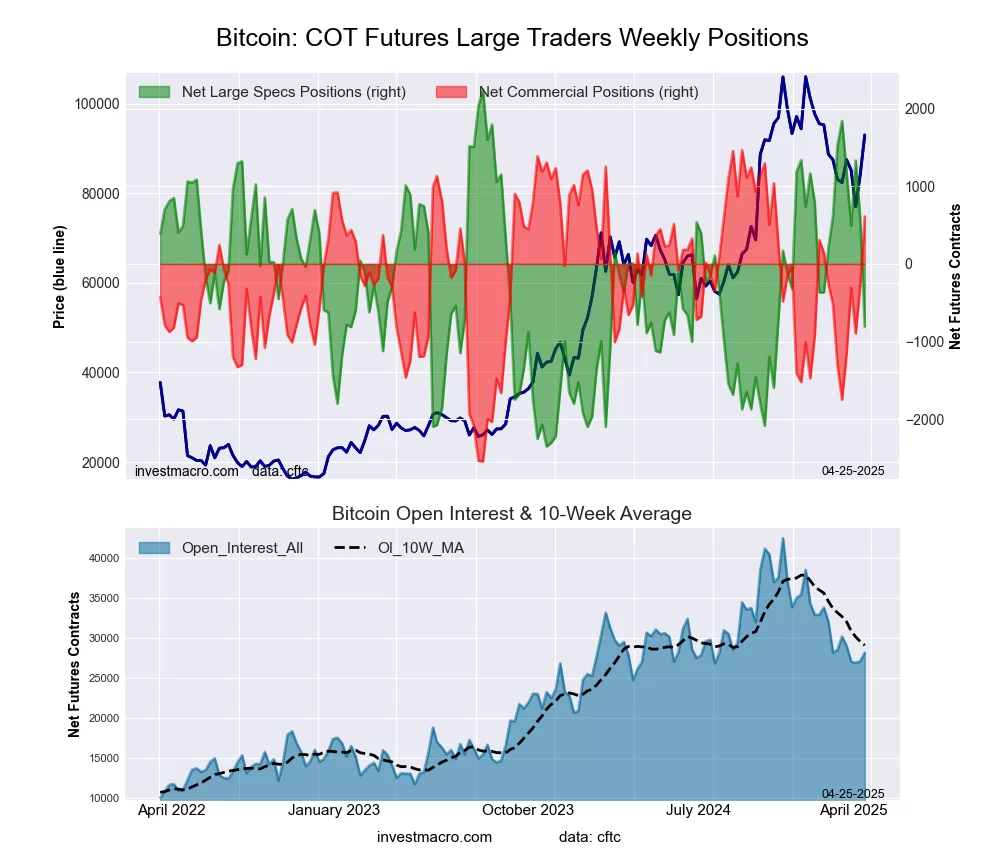
Bitcoin Futures:
 The Bitcoin large speculator standing this week reached a net position of -1,231 contracts in the data reported through Tuesday. This was a weekly fall of -425 contracts from the previous week which had a total of -806 net contracts.
This week’s current strength score (the trader positioning range over the past three years, measured from 0 to 100) shows the speculators are currently Bearish with a score of 24.4 percent. The commercials are Bullish-Extreme with a score of 86.3 percent and the small traders (not shown in chart) are Bearish with a score of 45.7 percent.
Price Trend-Following Model: Weak Downtrend
Our weekly trend-following model classifies the current market price position as: Weak Downtrend.
| BITCOIN Statistics | SPECULATORS | COMMERCIALS | SMALL TRADERS |
| – Percent of Open Interest Longs: | 82.9 | 5.0 | 4.8 |
| – Percent of Open Interest Shorts: | 87.5 | 1.7 | 3.7 |
| – Net Position: | -1,231 | 915 | 316 |
| – Gross Longs: | 22,355 | 1,360 | 1,307 |
| – Gross Shorts: | 23,586 | 445 | 991 |
| – Long to Short Ratio: | 0.9 to 1 | 3.1 to 1 | 1.3 to 1 |
| NET POSITION TREND: | |||
| – Strength Index Score (3 Year Range Pct): | 24.4 | 86.3 | 45.7 |
| – Strength Index Reading (3 Year Range): | Bearish | Bullish-Extreme | Bearish |
| NET POSITION MOVEMENT INDEX: | |||
| – 6-Week Change in Strength Index: | -67.0 | 66.4 | 24.9 |
Article By InvestMacro – Receive our weekly COT Newsletter
*COT Report: The COT data, released weekly to the public each Friday, is updated through the most recent Tuesday (data is 3 days old) and shows a quick view of how large speculators or non-commercials (for-profit traders) were positioned in the futures markets.
The CFTC categorizes trader positions according to commercial hedgers (traders who use futures contracts for hedging as part of the business), non-commercials (large traders who speculate to realize trading profits) and nonreportable traders (usually small traders/speculators) as well as their open interest (contracts open in the market at time of reporting). See CFTC criteria here.