By InvestMacro
Here are the latest charts and statistics for the Commitment of Traders (COT) data published by the Commodities Futures Trading Commission (CFTC).
The latest COT data is updated through Tuesday May 6th and shows a quick view of how large market participants (for-profit speculators and commercial traders) were positioned in the futures markets. All currency positions are in direct relation to the US dollar where, for example, a bet for the euro is a bet that the euro will rise versus the dollar while a bet against the euro will be a bet that the euro will decline versus the dollar.
Weekly Speculator Changes led by Mexican Peso & British Pound
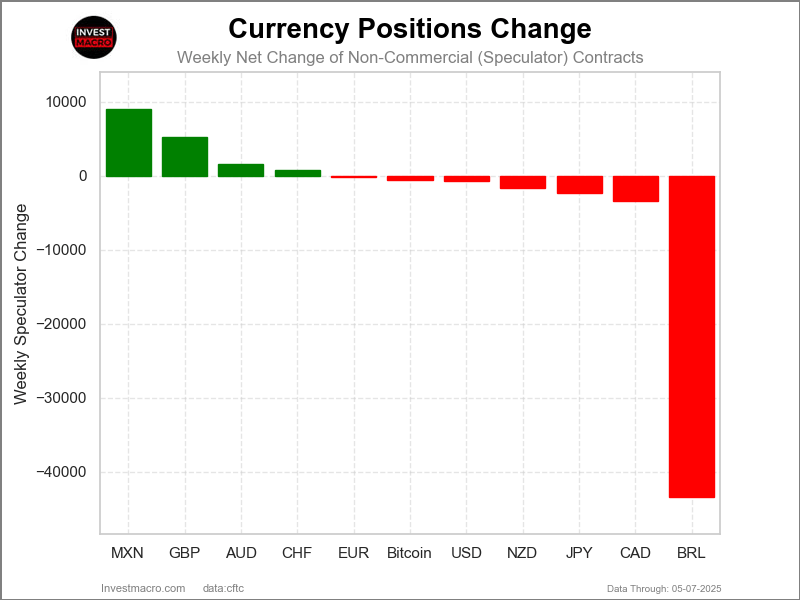
The COT currency market speculator bets were overall lower this week as four out of the eleven currency markets we cover had higher positioning while the other seven markets had lower speculator contracts.
Leading the gains for the currency markets was the Mexican Peso (9,043 contracts) with the British Pound (5,276 contracts), the Australian Dollar (1,571 contracts) and the Swiss Franc (740 contracts) also seeing positive weeks.
The currencies seeing declines in speculator bets on the week were the Brazilian Real (-43,377 contracts), the Canadian Dollar (-3,440 contracts), the Japanese Yen (-2,353 contracts), the New Zealand Dollar (-1,612 contracts), the US Dollar Index (-659 contracts), Bitcoin (-550 contracts) and with the EuroFX (-78 contracts) also recording lower bets on the week.
Currency Speculators drop US Dollar Index bets for 8th time in 11 weeks
Highlighting the data in the currency speculator positions is a weakening US Dollar trend while the other major currencies are seeing stronger weekly speculator positions and trends.
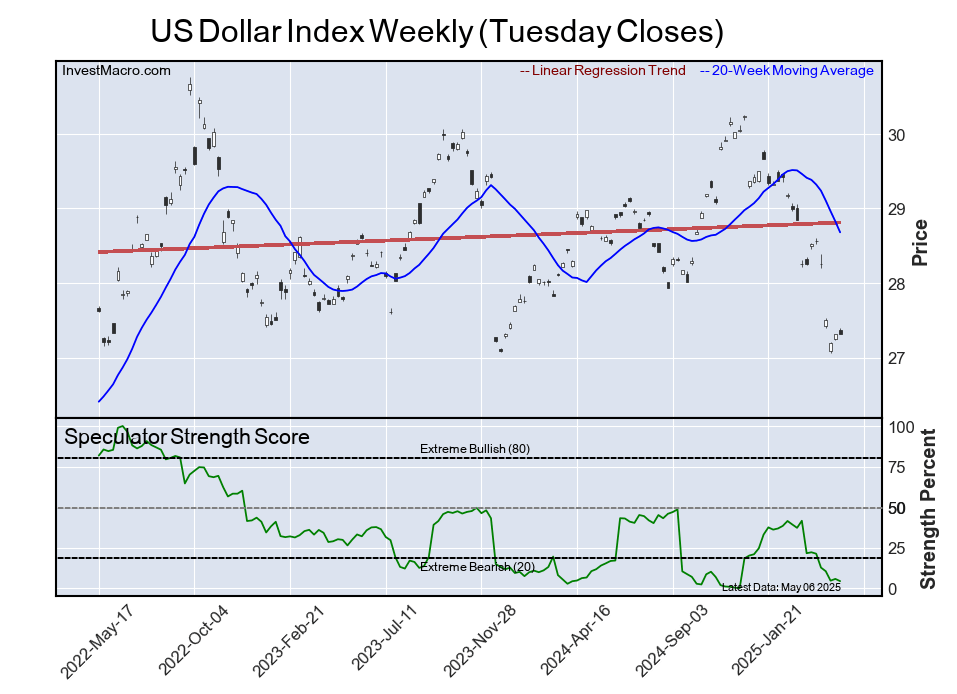
The US Dollar index has been in an overall bearish position for three consecutive weeks as the USD Index positions have fallen in 8 out of the last 11 weeks for a total decline of over -17,000 contracts in that time period. This has dropped the speculator positioning to the most bearish level since December 2024. The USD Index speculator strength score, a measure of the current spec level compared to its past 3-year range, is currently at just a 4.4% score and underscores how weak the currency has become in speculator sentiment.
Weak Start to 2025 for the U.S. Dollar
The USD Index exchange rate has had a very weak start to 2025 as it has fallen approximately 9% since the beginning of the year. The American currency Index currently sits at the important psychological level of 100.00 and how the currency navigates this level can determine where things go as the 100 level has acted as strong support or resistance many times in the past, including in 2023 and 2024. The USD Index has recently fallen below its 200-week moving average and has now been under this level for multiple weeks for the first time since 2021.
Euro, GBP, Yen and Peso bullish bets
The Euro, the British Pound Sterling, the Mexican Peso and the Japanese Yen currently all have bullish speculator contract standings against the US Dollar. The Japanese Yen bets have been on a tear in the past few months with speculator bets rising in 13 out of the past 16 weeks for a total gain of +206,270 contracts in that period. The Yen speculator positions, however, did dip a little bit this week and came down from the all-time record high of last week at just under +180,000 bullish contracts.
The Euro and the British pound sterling contracts have also been steadily building higher bullish positions over the past few months with current levels at +75,719 contracts and +29,235 contracts, respectively. The Mexican Peso positions have been trending up as well as it has risen for three consecutive weeks and now the Mexican Peso speculator position is at its highest level since July of 2024 at +68,555 contracts.
Meanwhile, the Swiss Franc, the Canadian Dollar, the Australian Dollar, and the New Zealand Dollar contracts have all been in bearish positions but have been improving week to week from their lowest bearish levels in the first quarter of 2025.
Biggest Change of the Week: BRL
The outlier change this week was the Brazilian Real which saw speculator bets fall by over -43,000 contracts this week. This sharp decline was following four straight weeks of gains that had boosted the overall bullish position to the highest level on record last week. This week’s reduction basically cut the Brazilian real speculator position in third and it now sits currently around +25,000 net contracts. The Brazilian Real’s exchange rate against the Dollar this week rose slightly and gained for a fourth consecutive week. Overall, the Real is about ten percent higher vs the USD since the start of the year.
Currencies Data:
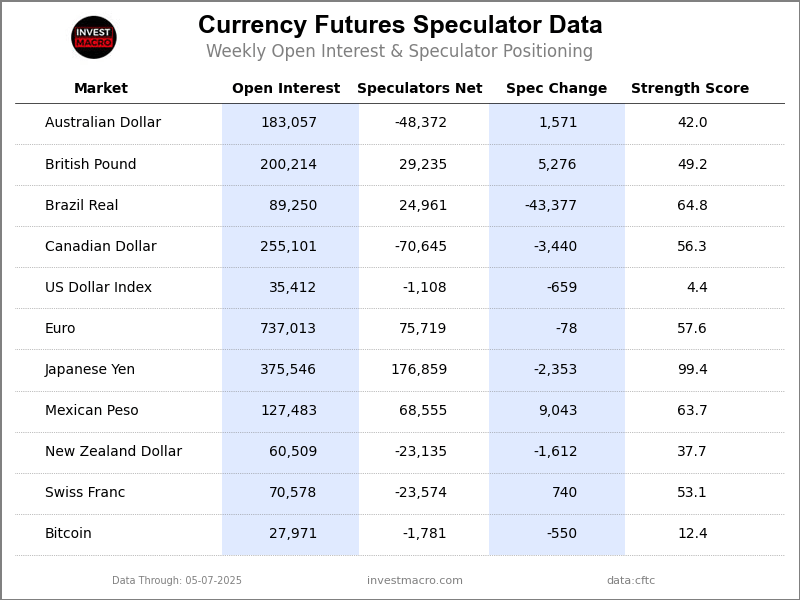
Legend: Open Interest | Speculators Current Net Position | Weekly Specs Change | Specs Strength Score compared to last 3-Years (0-100 range)
Strength Scores led by Japanese Yen & Brazilian Real
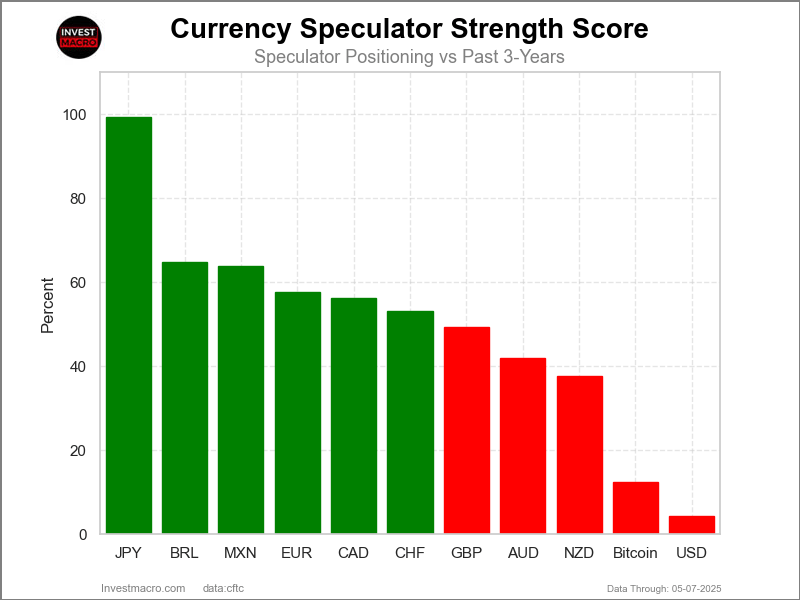
COT Strength Scores (a normalized measure of Speculator positions over a 3-Year range, from 0 to 100 where above 80 is Extreme-Bullish and below 20 is Extreme-Bearish) showed that the Japanese Yen (99 percent) and the Brazilian Real (65 percent) lead the currency markets this week. The Mexican Peso (64 percent), EuroFX (58 percent) and the Canadian Dollar (56 percent) come in as the next highest in the weekly strength scores.
On the downside, the US Dollar Index (4 percent) and Bitcoin (12 percent) come in at the lowest strength levels currently and are in Extreme-Bearish territory (below 20 percent). The next lowest strength scores are the New Zealand Dollar (38 percent) and the Australian Dollar (42 percent).
3-Year Strength Statistics:
US Dollar Index (4.4 percent) vs US Dollar Index previous week (5.8 percent)
EuroFX (57.6 percent) vs EuroFX previous week (57.6 percent)
British Pound Sterling (49.2 percent) vs British Pound Sterling previous week (46.9 percent)
Japanese Yen (99.4 percent) vs Japanese Yen previous week (100.0 percent)
Swiss Franc (53.1 percent) vs Swiss Franc previous week (51.6 percent)
Canadian Dollar (56.3 percent) vs Canadian Dollar previous week (57.8 percent)
Australian Dollar (42.0 percent) vs Australian Dollar previous week (40.9 percent)
New Zealand Dollar (37.7 percent) vs New Zealand Dollar previous week (39.6 percent)
Mexican Peso (63.7 percent) vs Mexican Peso previous week (59.1 percent)
Brazilian Real (64.8 percent) vs Brazilian Real previous week (100.0 percent)
Bitcoin (12.4 percent) vs Bitcoin previous week (24.4 percent)
Swiss Franc & Canadian Dollar top the 6-Week Strength Trends
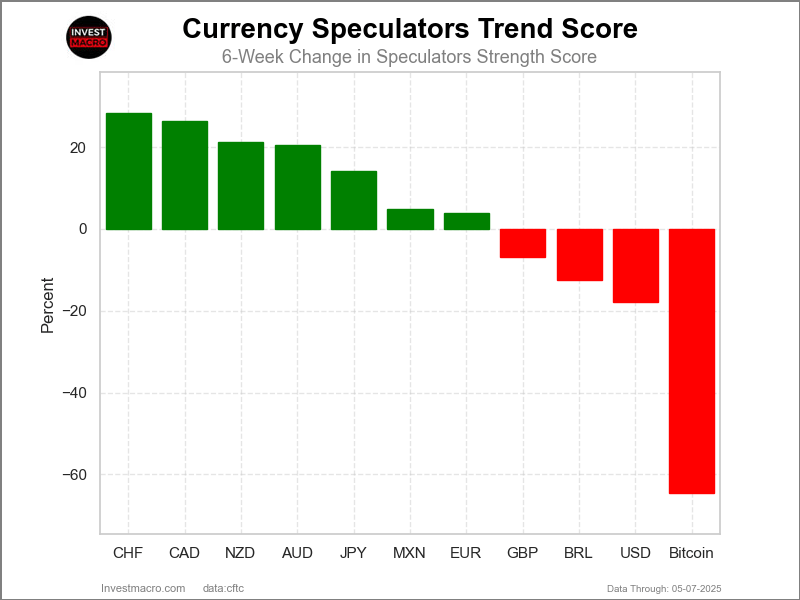
COT Strength Score Trends (or move index, calculates the 6-week changes in strength scores) showed that the Swiss Franc (28 percent) and the Canadian Dollar (26 percent) lead the past six weeks trends for the currencies. The Australian Dollar (21 percent), the New Zealand Dollar (21 percent) and the Japanese Yen (14 percent) are the next highest positive movers in the 3-Year trends data.
The Bitcoin (-65 percent) leads the downside trend scores currently with the US Dollar Index (-18 percent), Brazilian Real (-12 percent) and the British Pound (-7 percent) following next with lower trend scores.
3-Year Strength Trends:
US Dollar Index (-17.8 percent) vs US Dollar Index previous week (-15.8 percent)
EuroFX (3.9 percent) vs EuroFX previous week (6.2 percent)
British Pound Sterling (-6.8 percent) vs British Pound Sterling previous week (-2.4 percent)
Japanese Yen (14.2 percent) vs Japanese Yen previous week (15.5 percent)
Swiss Franc (28.4 percent) vs Swiss Franc previous week (20.4 percent)
Canadian Dollar (26.4 percent) vs Canadian Dollar previous week (31.1 percent)
Australian Dollar (20.6 percent) vs Australian Dollar previous week (14.5 percent)
New Zealand Dollar (21.3 percent) vs New Zealand Dollar previous week (21.9 percent)
Mexican Peso (4.9 percent) vs Mexican Peso previous week (1.8 percent)
Brazilian Real (-12.5 percent) vs Brazilian Real previous week (22.4 percent)
Bitcoin (-64.6 percent) vs Bitcoin previous week (-67.0 percent)
Individual COT Forex Markets:
US Dollar Index Futures:
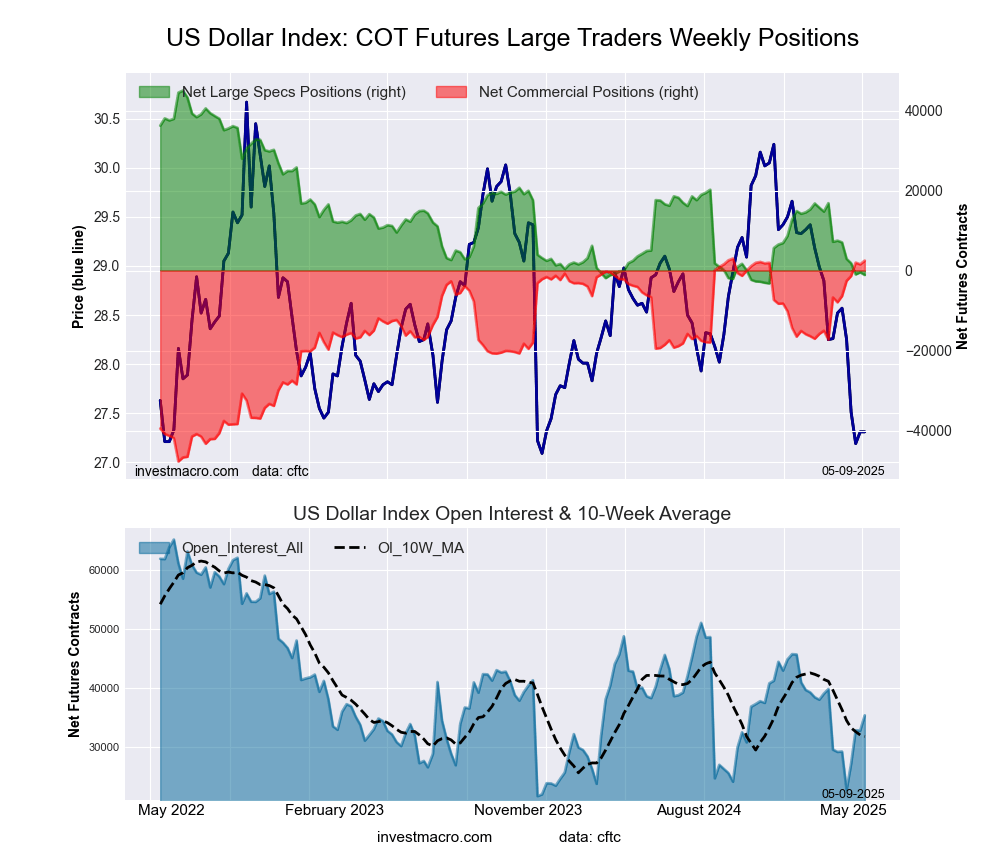 The US Dollar Index large speculator standing this week was a net position of -1,108 contracts in the data reported through Tuesday. This was a weekly fall of -659 contracts from the previous week which had a total of -449 net contracts.
This week’s current strength score (the trader positioning range over the past three years, measured from 0 to 100) shows the speculators are currently Bearish-Extreme with a score of 4.4 percent. The commercials are Bullish-Extreme with a score of 99.0 percent and the small traders (not shown in chart) are Bearish-Extreme with a score of 11.6 percent.
Price Trend-Following Model: Downtrend
Our weekly trend-following model classifies the current market price position as: Downtrend.
| US DOLLAR INDEX Statistics | SPECULATORS | COMMERCIALS | SMALL TRADERS |
| – Percent of Open Interest Longs: | 60.0 | 27.3 | 7.2 |
| – Percent of Open Interest Shorts: | 63.1 | 20.3 | 11.1 |
| – Net Position: | -1,108 | 2,486 | -1,378 |
| – Gross Longs: | 21,251 | 9,682 | 2,559 |
| – Gross Shorts: | 22,359 | 7,196 | 3,937 |
| – Long to Short Ratio: | 1.0 to 1 | 1.3 to 1 | 0.6 to 1 |
| NET POSITION TREND: | | | |
| – Strength Index Score (3 Year Range Pct): | 4.4 | 99.0 | 11.6 |
| – Strength Index Reading (3 Year Range): | Bearish-Extreme | Bullish-Extreme | Bearish-Extreme |
| NET POSITION MOVEMENT INDEX: | | | |
| – 6-Week Change in Strength Index: | -17.8 | 20.6 | -25.2 |
Euro Currency Futures:
 The Euro Currency large speculator standing this week was a net position of 75,719 contracts in the data reported through Tuesday. This was a weekly lowering of -78 contracts from the previous week which had a total of 75,797 net contracts.
This week’s current strength score (the trader positioning range over the past three years, measured from 0 to 100) shows the speculators are currently Bullish with a score of 57.6 percent. The commercials are Bearish with a score of 36.5 percent and the small traders (not shown in chart) are Bullish-Extreme with a score of 96.8 percent.
Price Trend-Following Model: Uptrend
Our weekly trend-following model classifies the current market price position as: Uptrend.
| EURO Currency Statistics | SPECULATORS | COMMERCIALS | SMALL TRADERS |
| – Percent of Open Interest Longs: | 26.3 | 55.0 | 13.2 |
| – Percent of Open Interest Shorts: | 16.1 | 72.8 | 5.6 |
| – Net Position: | 75,719 | -131,339 | 55,620 |
| – Gross Longs: | 194,192 | 405,535 | 97,040 |
| – Gross Shorts: | 118,473 | 536,874 | 41,420 |
| – Long to Short Ratio: | 1.6 to 1 | 0.8 to 1 | 2.3 to 1 |
| NET POSITION TREND: | | | |
| – Strength Index Score (3 Year Range Pct): | 57.6 | 36.5 | 96.8 |
| – Strength Index Reading (3 Year Range): | Bullish | Bearish | Bullish-Extreme |
| NET POSITION MOVEMENT INDEX: | | | |
| – 6-Week Change in Strength Index: | 3.9 | -10.6 | 46.3 |
British Pound Sterling Futures:
 The British Pound Sterling large speculator standing this week was a net position of 29,235 contracts in the data reported through Tuesday. This was a weekly rise of 5,276 contracts from the previous week which had a total of 23,959 net contracts.
This week’s current strength score (the trader positioning range over the past three years, measured from 0 to 100) shows the speculators are currently Bearish with a score of 49.2 percent. The commercials are Bearish with a score of 47.6 percent and the small traders (not shown in chart) are Bullish with a score of 73.7 percent.
Price Trend-Following Model: Strong Uptrend
Our weekly trend-following model classifies the current market price position as: Strong Uptrend.
| BRITISH POUND Statistics | SPECULATORS | COMMERCIALS | SMALL TRADERS |
| – Percent of Open Interest Longs: | 47.1 | 28.9 | 15.8 |
| – Percent of Open Interest Shorts: | 32.5 | 46.2 | 13.1 |
| – Net Position: | 29,235 | -34,736 | 5,501 |
| – Gross Longs: | 94,384 | 57,797 | 31,693 |
| – Gross Shorts: | 65,149 | 92,533 | 26,192 |
| – Long to Short Ratio: | 1.4 to 1 | 0.6 to 1 | 1.2 to 1 |
| NET POSITION TREND: | | | |
| – Strength Index Score (3 Year Range Pct): | 49.2 | 47.6 | 73.7 |
| – Strength Index Reading (3 Year Range): | Bearish | Bearish | Bullish |
| NET POSITION MOVEMENT INDEX: | | | |
| – 6-Week Change in Strength Index: | -6.8 | 6.3 | -1.9 |
Japanese Yen Futures:
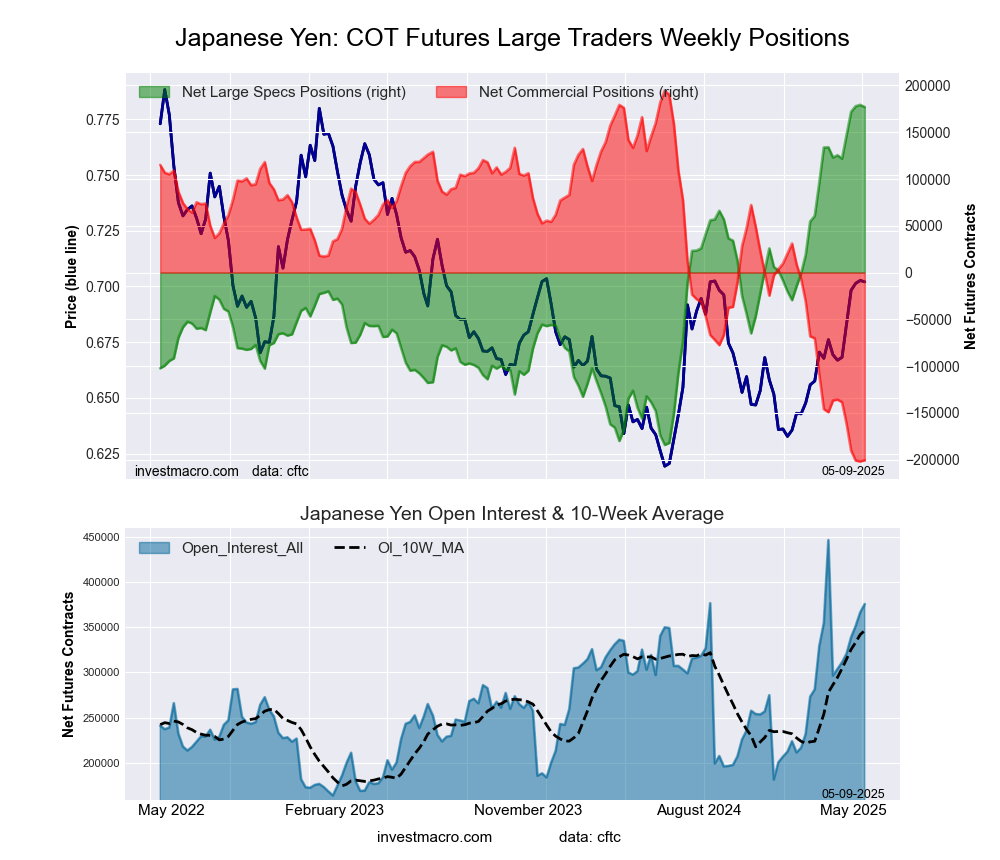 The Japanese Yen large speculator standing this week was a net position of 176,859 contracts in the data reported through Tuesday. This was a weekly lowering of -2,353 contracts from the previous week which had a total of 179,212 net contracts.
This week’s current strength score (the trader positioning range over the past three years, measured from 0 to 100) shows the speculators are currently Bullish-Extreme with a score of 99.4 percent. The commercials are Bearish-Extreme with a score of 0.3 percent and the small traders (not shown in chart) are Bullish-Extreme with a score of 100.0 percent.
Price Trend-Following Model: Uptrend
Our weekly trend-following model classifies the current market price position as: Uptrend.
| JAPANESE YEN Statistics | SPECULATORS | COMMERCIALS | SMALL TRADERS |
| – Percent of Open Interest Longs: | 54.3 | 28.2 | 11.8 |
| – Percent of Open Interest Shorts: | 7.2 | 81.6 | 5.5 |
| – Net Position: | 176,859 | -200,612 | 23,753 |
| – Gross Longs: | 204,008 | 105,878 | 44,435 |
| – Gross Shorts: | 27,149 | 306,490 | 20,682 |
| – Long to Short Ratio: | 7.5 to 1 | 0.3 to 1 | 2.1 to 1 |
| NET POSITION TREND: | | | |
| – Strength Index Score (3 Year Range Pct): | 99.4 | 0.3 | 100.0 |
| – Strength Index Reading (3 Year Range): | Bullish-Extreme | Bearish-Extreme | Bullish-Extreme |
| NET POSITION MOVEMENT INDEX: | | | |
| – 6-Week Change in Strength Index: | 14.2 | -16.4 | 30.8 |
Swiss Franc Futures:
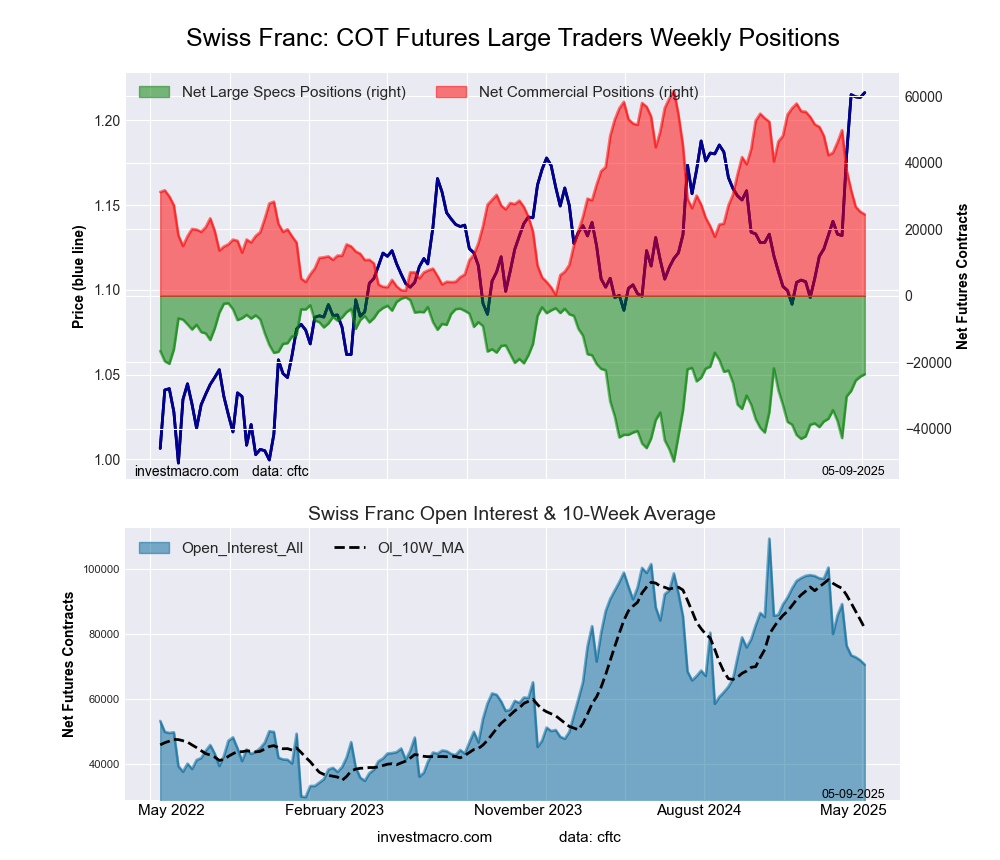 The Swiss Franc large speculator standing this week was a net position of -23,574 contracts in the data reported through Tuesday. This was a weekly advance of 740 contracts from the previous week which had a total of -24,314 net contracts.
This week’s current strength score (the trader positioning range over the past three years, measured from 0 to 100) shows the speculators are currently Bullish with a score of 53.1 percent. The commercials are Bearish with a score of 39.3 percent and the small traders (not shown in chart) are Bullish with a score of 75.1 percent.
Price Trend-Following Model: Strong Uptrend
Our weekly trend-following model classifies the current market price position as: Strong Uptrend.
| SWISS FRANC Statistics | SPECULATORS | COMMERCIALS | SMALL TRADERS |
| – Percent of Open Interest Longs: | 7.9 | 74.1 | 17.9 |
| – Percent of Open Interest Shorts: | 41.3 | 39.4 | 19.1 |
| – Net Position: | -23,574 | 24,432 | -858 |
| – Gross Longs: | 5,558 | 52,272 | 12,634 |
| – Gross Shorts: | 29,132 | 27,840 | 13,492 |
| – Long to Short Ratio: | 0.2 to 1 | 1.9 to 1 | 0.9 to 1 |
| NET POSITION TREND: | | | |
| – Strength Index Score (3 Year Range Pct): | 53.1 | 39.3 | 75.1 |
| – Strength Index Reading (3 Year Range): | Bullish | Bearish | Bullish |
| NET POSITION MOVEMENT INDEX: | | | |
| – 6-Week Change in Strength Index: | 28.4 | -35.3 | 32.4 |
Canadian Dollar Futures:
 The Canadian Dollar large speculator standing this week was a net position of -70,645 contracts in the data reported through Tuesday. This was a weekly decline of -3,440 contracts from the previous week which had a total of -67,205 net contracts.
This week’s current strength score (the trader positioning range over the past three years, measured from 0 to 100) shows the speculators are currently Bullish with a score of 56.3 percent. The commercials are Bearish with a score of 46.0 percent and the small traders (not shown in chart) are Bearish with a score of 27.3 percent.
Price Trend-Following Model: Strong Uptrend
Our weekly trend-following model classifies the current market price position as: Strong Uptrend.
| CANADIAN DOLLAR Statistics | SPECULATORS | COMMERCIALS | SMALL TRADERS |
| – Percent of Open Interest Longs: | 6.5 | 82.2 | 9.4 |
| – Percent of Open Interest Shorts: | 34.2 | 52.2 | 11.7 |
| – Net Position: | -70,645 | 76,469 | -5,824 |
| – Gross Longs: | 16,677 | 209,571 | 24,048 |
| – Gross Shorts: | 87,322 | 133,102 | 29,872 |
| – Long to Short Ratio: | 0.2 to 1 | 1.6 to 1 | 0.8 to 1 |
| NET POSITION TREND: | | | |
| – Strength Index Score (3 Year Range Pct): | 56.3 | 46.0 | 27.3 |
| – Strength Index Reading (3 Year Range): | Bullish | Bearish | Bearish |
| NET POSITION MOVEMENT INDEX: | | | |
| – 6-Week Change in Strength Index: | 26.4 | -27.0 | 13.8 |
Australian Dollar Futures:
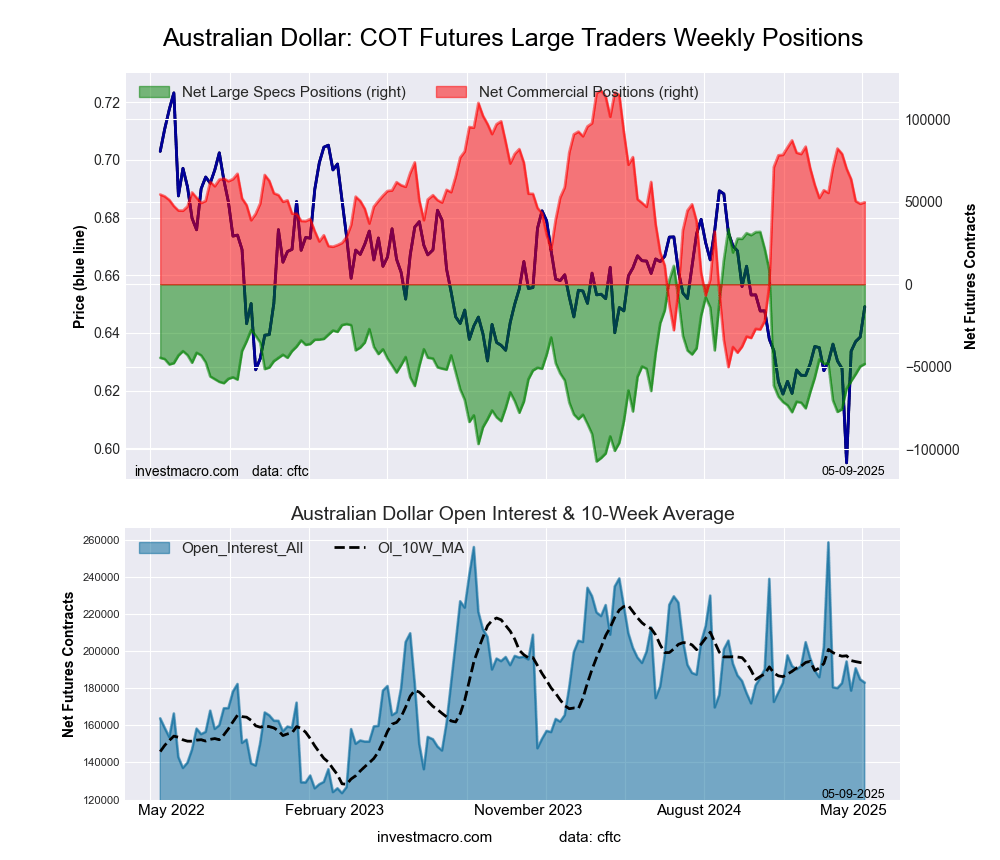 The Australian Dollar large speculator standing this week was a net position of -48,372 contracts in the data reported through Tuesday. This was a weekly boost of 1,571 contracts from the previous week which had a total of -49,943 net contracts.
This week’s current strength score (the trader positioning range over the past three years, measured from 0 to 100) shows the speculators are currently Bearish with a score of 42.0 percent. The commercials are Bullish with a score of 59.6 percent and the small traders (not shown in chart) are Bearish with a score of 45.6 percent.
Price Trend-Following Model: Strong Uptrend
Our weekly trend-following model classifies the current market price position as: Strong Uptrend.
| AUSTRALIAN DOLLAR Statistics | SPECULATORS | COMMERCIALS | SMALL TRADERS |
| – Percent of Open Interest Longs: | 14.3 | 66.4 | 12.5 |
| – Percent of Open Interest Shorts: | 40.8 | 39.2 | 13.2 |
| – Net Position: | -48,372 | 49,713 | -1,341 |
| – Gross Longs: | 26,243 | 121,539 | 22,896 |
| – Gross Shorts: | 74,615 | 71,826 | 24,237 |
| – Long to Short Ratio: | 0.4 to 1 | 1.7 to 1 | 0.9 to 1 |
| NET POSITION TREND: | | | |
| – Strength Index Score (3 Year Range Pct): | 42.0 | 59.6 | 45.6 |
| – Strength Index Reading (3 Year Range): | Bearish | Bullish | Bearish |
| NET POSITION MOVEMENT INDEX: | | | |
| – 6-Week Change in Strength Index: | 20.6 | -19.4 | 9.3 |
New Zealand Dollar Futures:
 The New Zealand Dollar large speculator standing this week was a net position of -23,135 contracts in the data reported through Tuesday. This was a weekly fall of -1,612 contracts from the previous week which had a total of -21,523 net contracts.
This week’s current strength score (the trader positioning range over the past three years, measured from 0 to 100) shows the speculators are currently Bearish with a score of 37.7 percent. The commercials are Bullish with a score of 59.8 percent and the small traders (not shown in chart) are Bullish with a score of 57.3 percent.
Price Trend-Following Model: Strong Uptrend
Our weekly trend-following model classifies the current market price position as: Strong Uptrend.
| NEW ZEALAND DOLLAR Statistics | SPECULATORS | COMMERCIALS | SMALL TRADERS |
| – Percent of Open Interest Longs: | 16.8 | 74.6 | 7.5 |
| – Percent of Open Interest Shorts: | 55.1 | 36.8 | 7.0 |
| – Net Position: | -23,135 | 22,830 | 305 |
| – Gross Longs: | 10,188 | 45,115 | 4,533 |
| – Gross Shorts: | 33,323 | 22,285 | 4,228 |
| – Long to Short Ratio: | 0.3 to 1 | 2.0 to 1 | 1.1 to 1 |
| NET POSITION TREND: | | | |
| – Strength Index Score (3 Year Range Pct): | 37.7 | 59.8 | 57.3 |
| – Strength Index Reading (3 Year Range): | Bearish | Bullish | Bullish |
| NET POSITION MOVEMENT INDEX: | | | |
| – 6-Week Change in Strength Index: | 21.3 | -22.5 | 20.4 |
Mexican Peso Futures:
 The Mexican Peso large speculator standing this week was a net position of 68,555 contracts in the data reported through Tuesday. This was a weekly advance of 9,043 contracts from the previous week which had a total of 59,512 net contracts.
This week’s current strength score (the trader positioning range over the past three years, measured from 0 to 100) shows the speculators are currently Bullish with a score of 63.7 percent. The commercials are Bearish with a score of 38.4 percent and the small traders (not shown in chart) are Bearish with a score of 29.0 percent.
Price Trend-Following Model: Strong Uptrend
Our weekly trend-following model classifies the current market price position as: Strong Uptrend.
| MEXICAN PESO Statistics | SPECULATORS | COMMERCIALS | SMALL TRADERS |
| – Percent of Open Interest Longs: | 67.9 | 27.1 | 3.8 |
| – Percent of Open Interest Shorts: | 14.2 | 81.8 | 2.9 |
| – Net Position: | 68,555 | -69,687 | 1,132 |
| – Gross Longs: | 86,615 | 34,566 | 4,872 |
| – Gross Shorts: | 18,060 | 104,253 | 3,740 |
| – Long to Short Ratio: | 4.8 to 1 | 0.3 to 1 | 1.3 to 1 |
| NET POSITION TREND: | | | |
| – Strength Index Score (3 Year Range Pct): | 63.7 | 38.4 | 29.0 |
| – Strength Index Reading (3 Year Range): | Bullish | Bearish | Bearish |
| NET POSITION MOVEMENT INDEX: | | | |
| – 6-Week Change in Strength Index: | 4.9 | -5.6 | 8.2 |
Brazilian Real Futures:
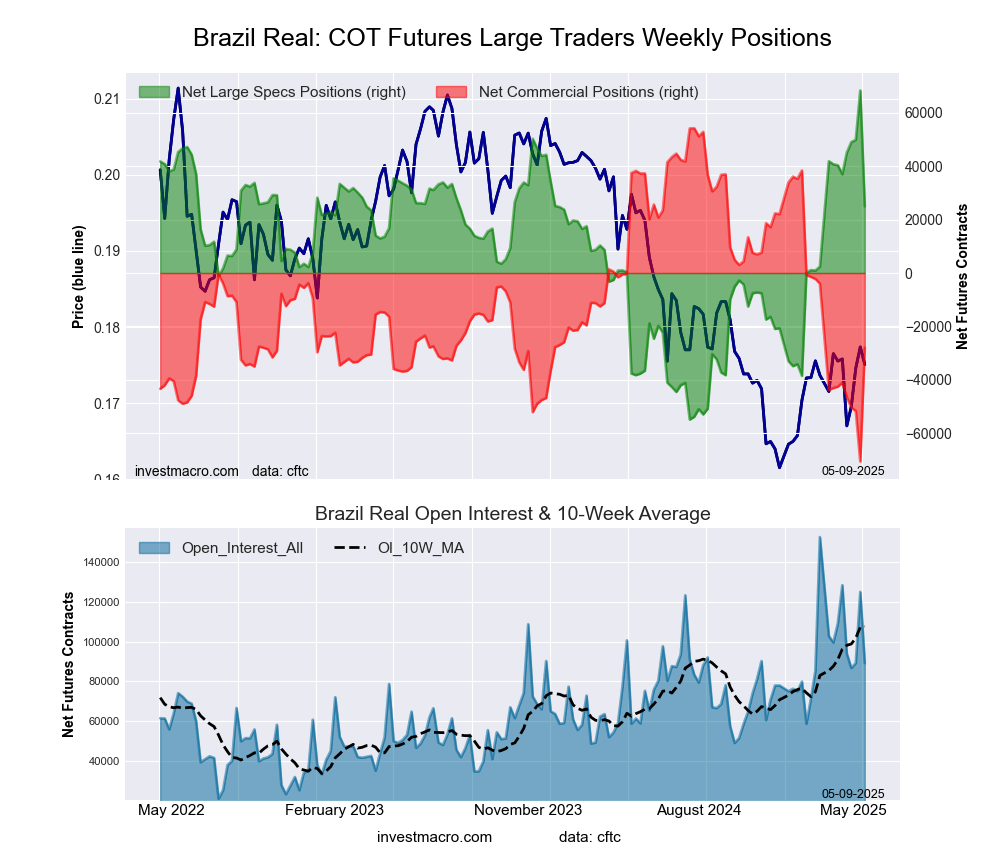 The Brazilian Real large speculator standing this week was a net position of 24,961 contracts in the data reported through Tuesday. This was a weekly fall of -43,377 contracts from the previous week which had a total of 68,338 net contracts.
This week’s current strength score (the trader positioning range over the past three years, measured from 0 to 100) shows the speculators are currently Bullish with a score of 64.8 percent. The commercials are Bearish with a score of 34.2 percent and the small traders (not shown in chart) are Bearish with a score of 37.6 percent.
Price Trend-Following Model: Uptrend
Our weekly trend-following model classifies the current market price position as: Uptrend.
| BRAZIL REAL Statistics | SPECULATORS | COMMERCIALS | SMALL TRADERS |
| – Percent of Open Interest Longs: | 68.5 | 26.9 | 4.4 |
| – Percent of Open Interest Shorts: | 40.5 | 58.1 | 1.1 |
| – Net Position: | 24,961 | -27,927 | 2,966 |
| – Gross Longs: | 61,099 | 23,965 | 3,952 |
| – Gross Shorts: | 36,138 | 51,892 | 986 |
| – Long to Short Ratio: | 1.7 to 1 | 0.5 to 1 | 4.0 to 1 |
| NET POSITION TREND: | | | |
| – Strength Index Score (3 Year Range Pct): | 64.8 | 34.2 | 37.6 |
| – Strength Index Reading (3 Year Range): | Bullish | Bearish | Bearish |
| NET POSITION MOVEMENT INDEX: | | | |
| – 6-Week Change in Strength Index: | -12.5 | 11.7 | 4.3 |
Bitcoin Futures:
 The Bitcoin large speculator standing this week was a net position of -1,781 contracts in the data reported through Tuesday. This was a weekly reduction of -550 contracts from the previous week which had a total of -1,231 net contracts.
This week’s current strength score (the trader positioning range over the past three years, measured from 0 to 100) shows the speculators are currently Bearish-Extreme with a score of 12.4 percent. The commercials are Bullish-Extreme with a score of 100.0 percent and the small traders (not shown in chart) are Bearish with a score of 41.0 percent.
Price Trend-Following Model: Weak Downtrend
Our weekly trend-following model classifies the current market price position as: Weak Downtrend.
| BITCOIN Statistics | SPECULATORS | COMMERCIALS | SMALL TRADERS |
| – Percent of Open Interest Longs: | 82.0 | 7.1 | 4.9 |
| – Percent of Open Interest Shorts: | 88.4 | 1.6 | 4.0 |
| – Net Position: | -1,781 | 1,541 | 240 |
| – Gross Longs: | 22,936 | 1,982 | 1,360 |
| – Gross Shorts: | 24,717 | 441 | 1,120 |
| – Long to Short Ratio: | 0.9 to 1 | 4.5 to 1 | 1.2 to 1 |
| NET POSITION TREND: | | | |
| – Strength Index Score (3 Year Range Pct): | 12.4 | 100.0 | 41.0 |
| – Strength Index Reading (3 Year Range): | Bearish-Extreme | Bullish-Extreme | Bearish |
| NET POSITION MOVEMENT INDEX: | | | |
| – 6-Week Change in Strength Index: | -64.6 | 65.9 | 16.4 |
Article By InvestMacro – Receive our weekly COT Newsletter
*COT Report: The COT data, released weekly to the public each Friday, is updated through the most recent Tuesday (data is 3 days old) and shows a quick view of how large speculators or non-commercials (for-profit traders) were positioned in the futures markets.
The CFTC categorizes trader positions according to commercial hedgers (traders who use futures contracts for hedging as part of the business), non-commercials (large traders who speculate to realize trading profits) and nonreportable traders (usually small traders/speculators) as well as their open interest (contracts open in the market at time of reporting). See CFTC criteria here.


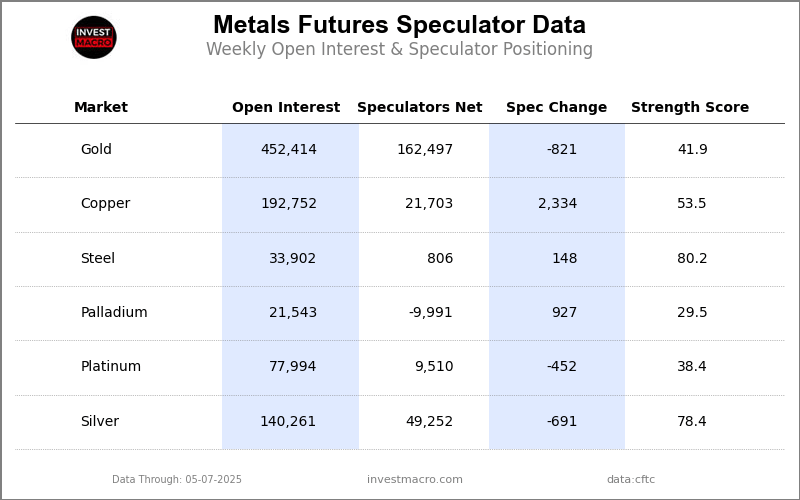
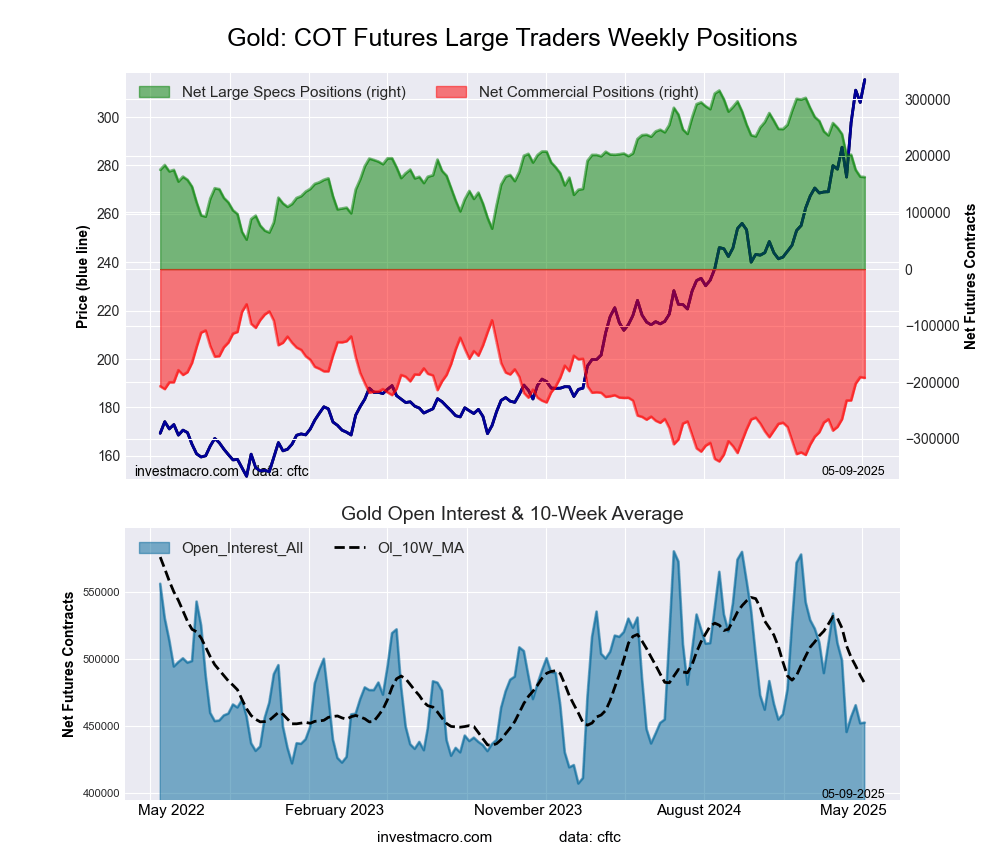
 The Gold Comex Futures large speculator standing this week equaled a net position of 161,209 contracts in the data reported through Tuesday. This was a weekly reduction of -1,288 contracts from the previous week which had a total of 162,497 net contracts.
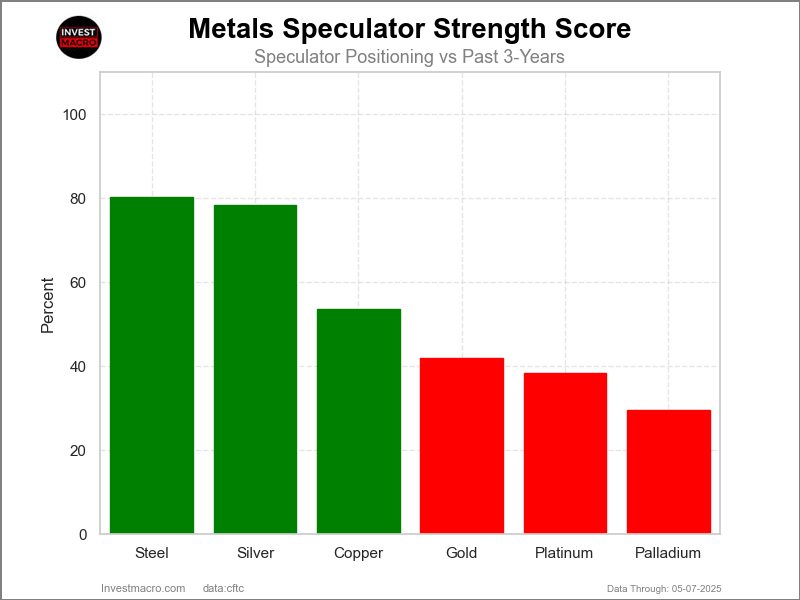
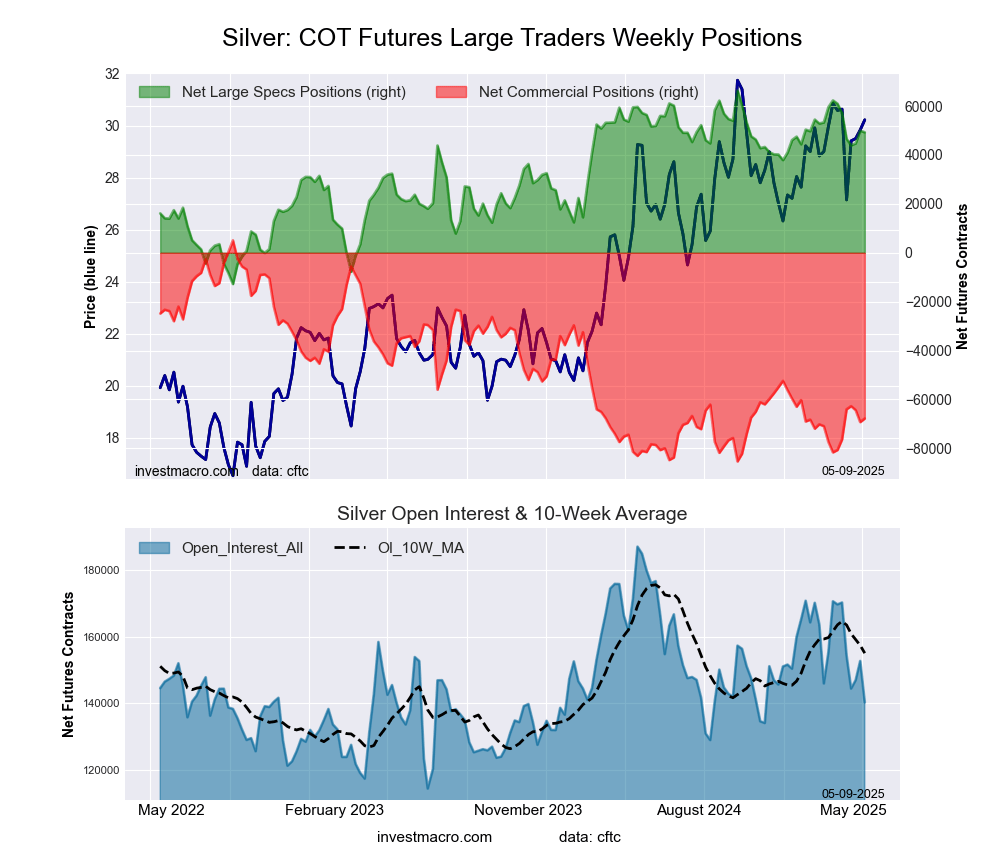
 The Silver Comex Futures large speculator standing this week equaled a net position of 47,754 contracts in the data reported through Tuesday. This was a weekly fall of -1,498 contracts from the previous week which had a total of 49,252 net contracts.
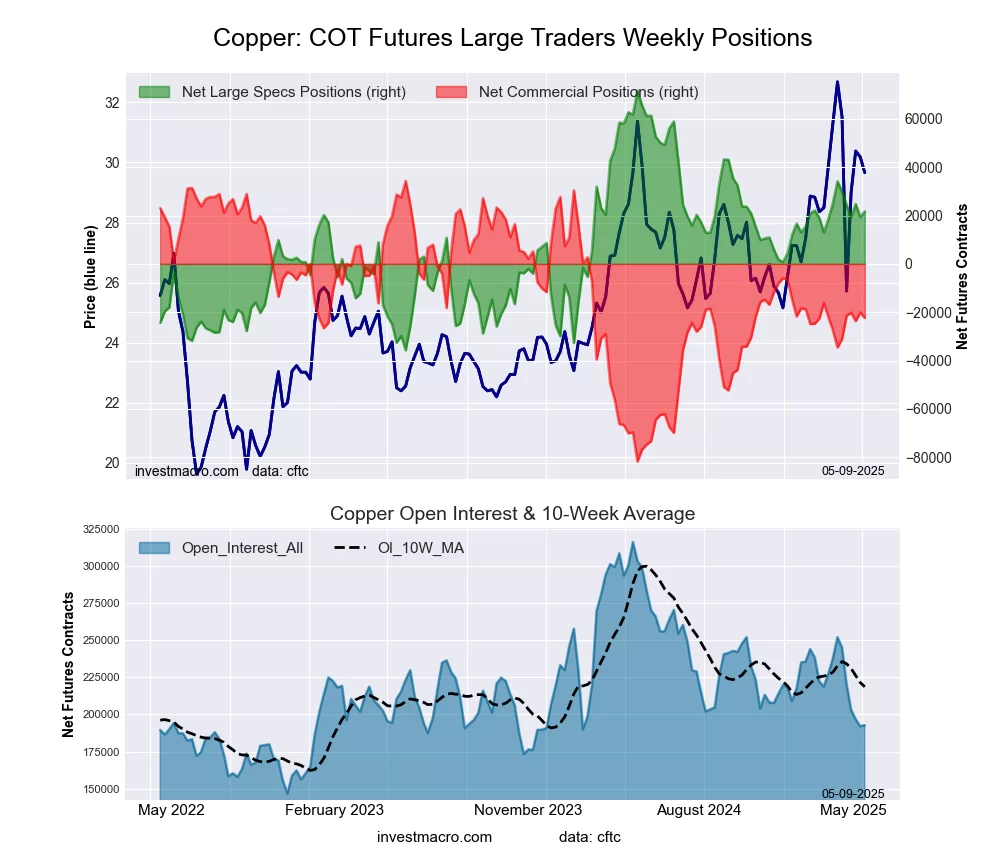
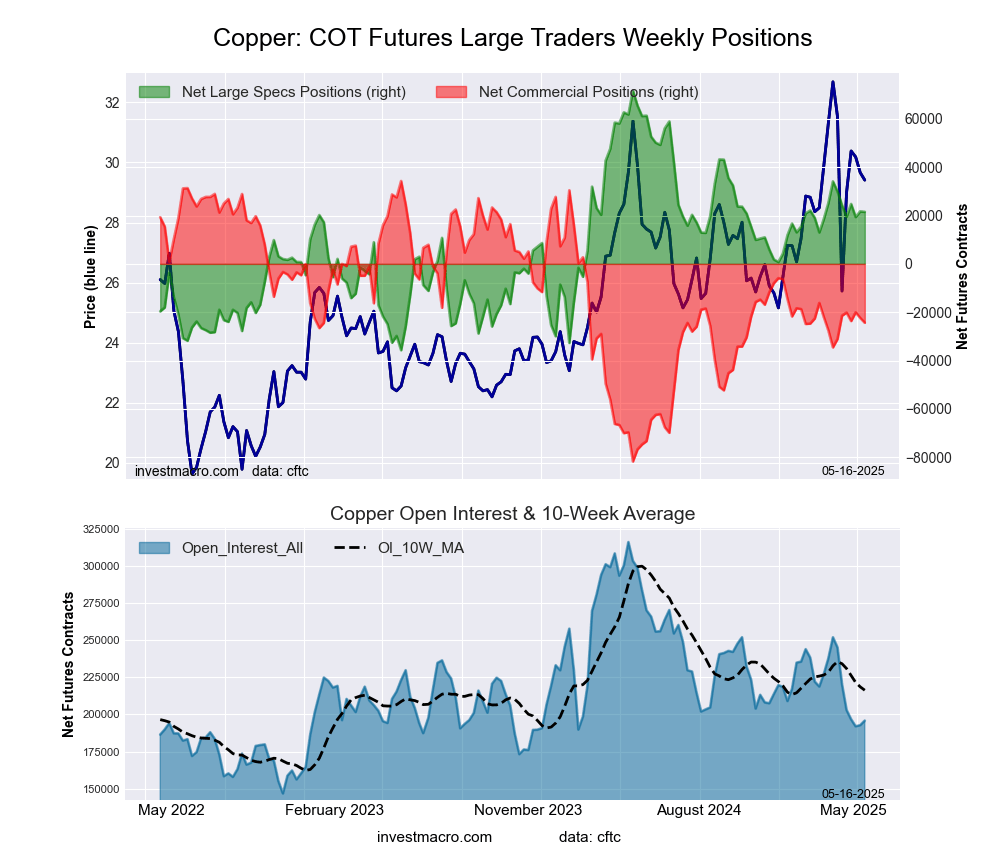 The Copper Grade #1 Futures large speculator standing this week equaled a net position of 21,522 contracts in the data reported through Tuesday. This was a weekly decrease of -181 contracts from the previous week which had a total of 21,703 net contracts.
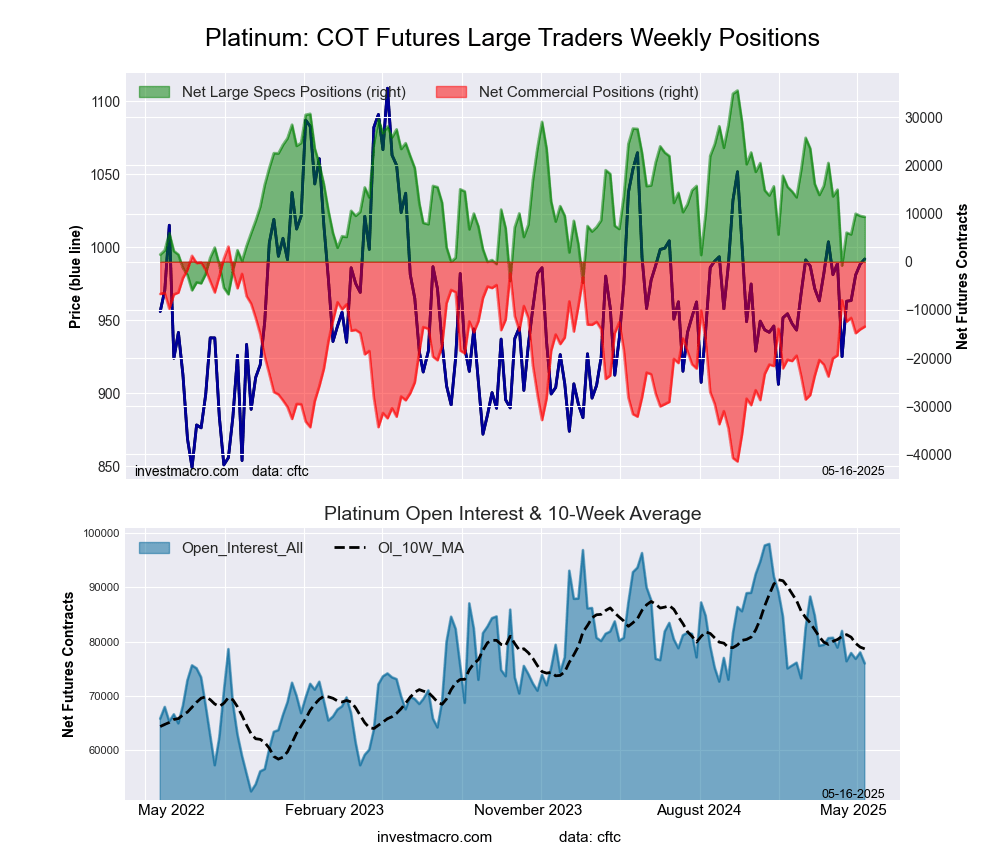 The Platinum Futures large speculator standing this week equaled a net position of 9,316 contracts in the data reported through Tuesday. This was a weekly reduction of -194 contracts from the previous week which had a total of 9,510 net contracts.
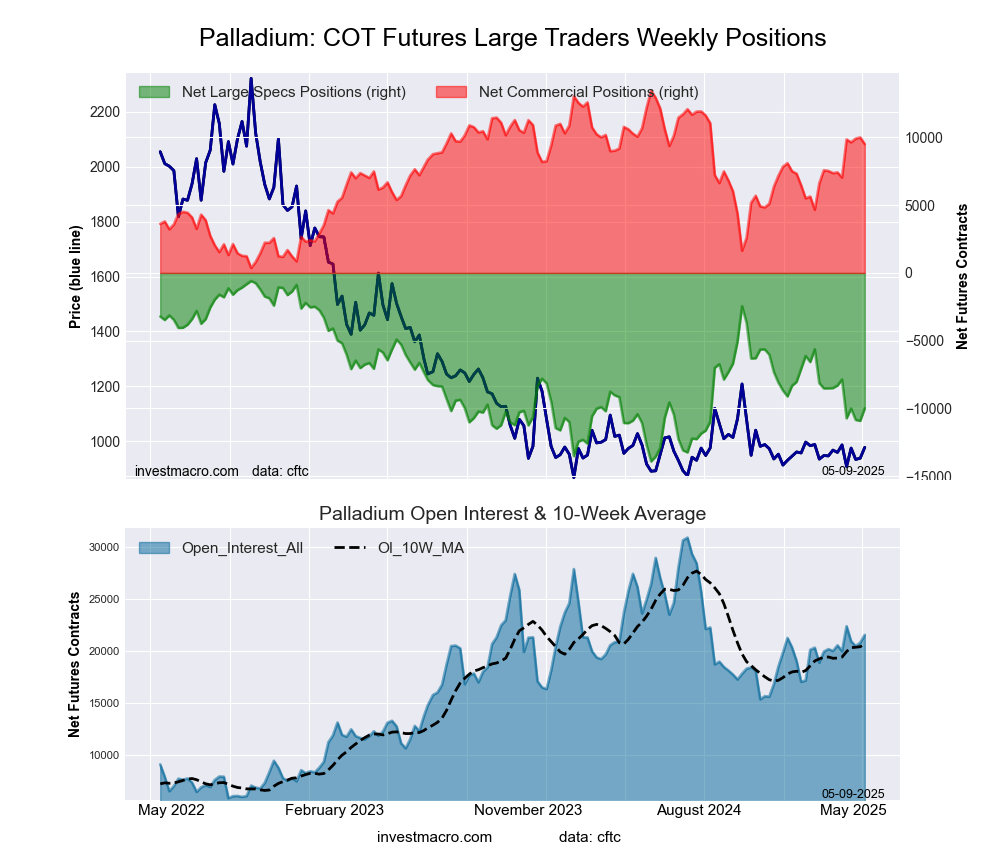
 The Palladium Futures large speculator standing this week equaled a net position of -10,461 contracts in the data reported through Tuesday. This was a weekly reduction of -470 contracts from the previous week which had a total of -9,991 net contracts.
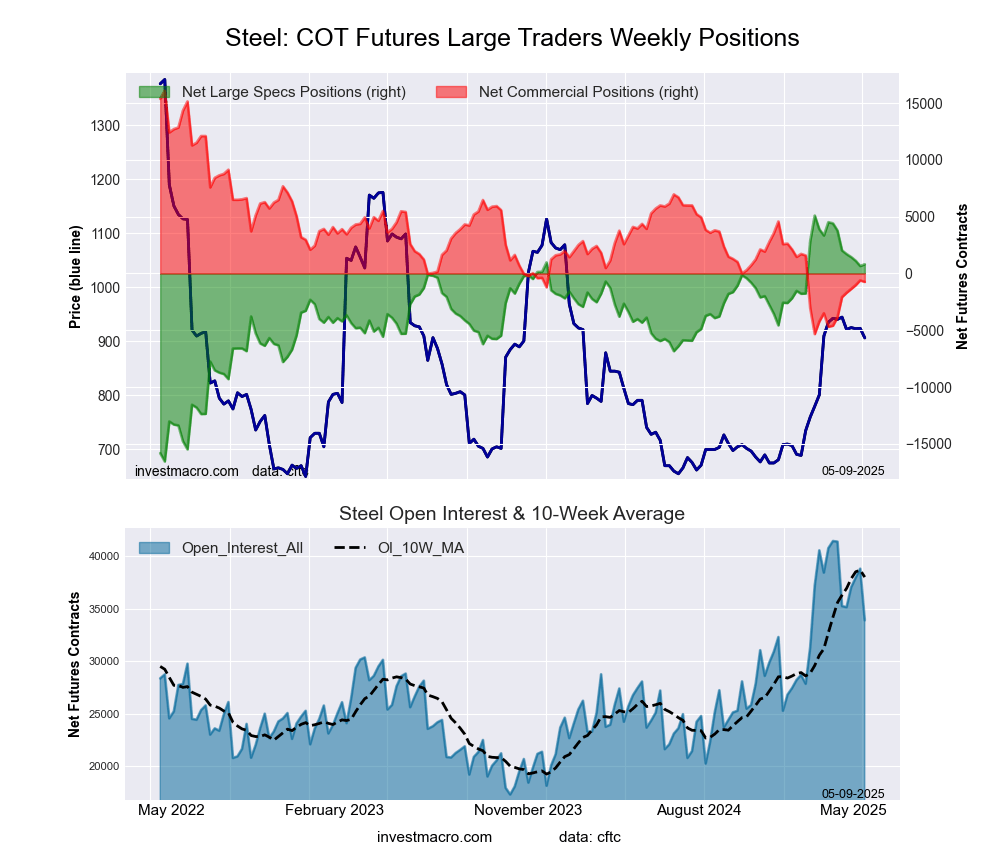
 The Steel Futures large speculator standing this week equaled a net position of 171 contracts in the data reported through Tuesday. This was a weekly lowering of -635 contracts from the previous week which had a total of 806 net contracts.