By InvestMacro
Here are the latest charts and statistics for the Commitment of Traders (COT) reports data published by the Commodities Futures Trading Commission (CFTC).
The latest COT data is updated through Tuesday May 19th and shows a quick view of how large traders (for-profit speculators and commercial entities) were positioned in the futures markets.
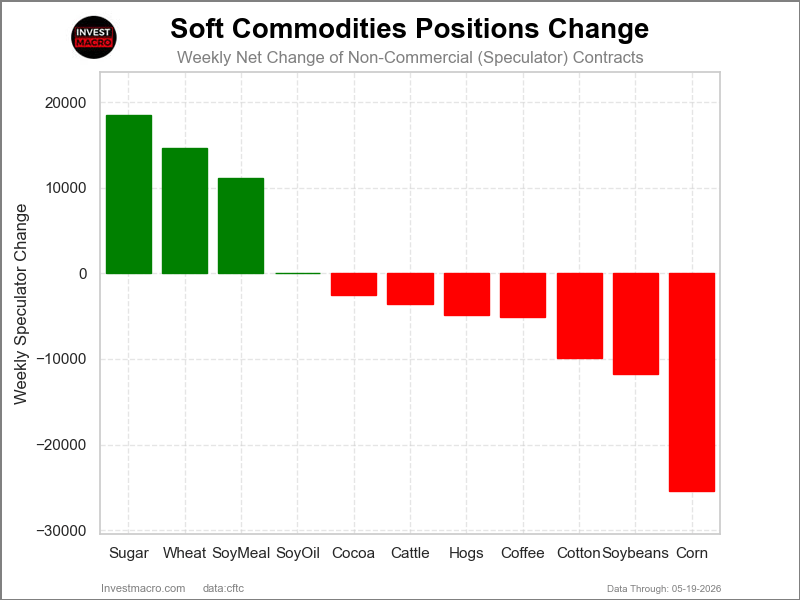
The COT soft commodities markets speculator bets were overall lower this week as just four out of the eleven softs markets we cover had higher positioning while the other seven markets had lower speculator contracts.
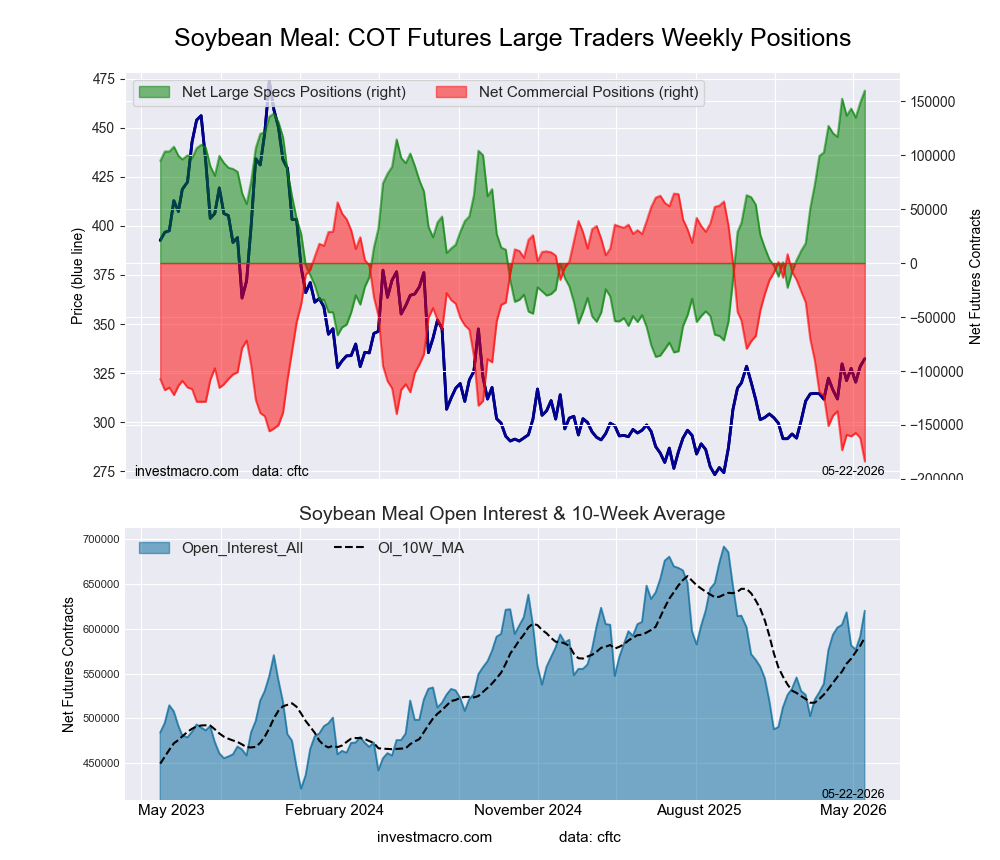
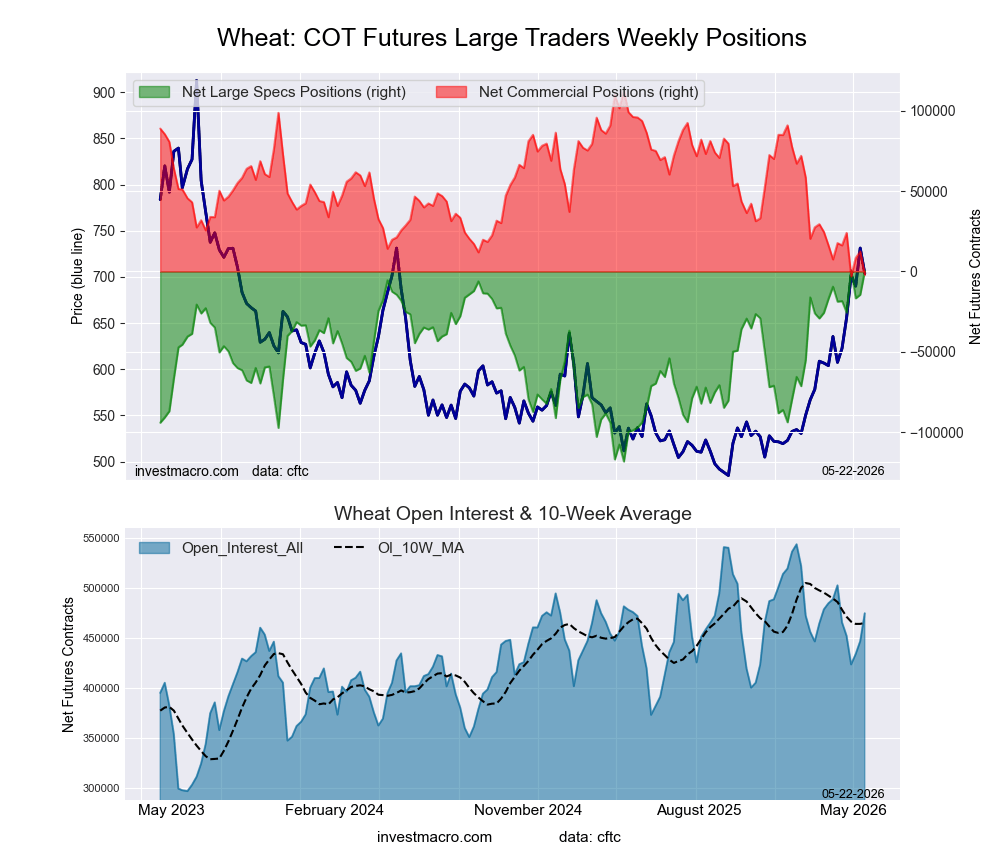
Leading the gains for the softs markets was Sugar (18,509 contracts) with Wheat (14,684 contracts), Soybean Meal (11,088 contracts) and Soybean Oil (5 contracts) also showing positive weeks.
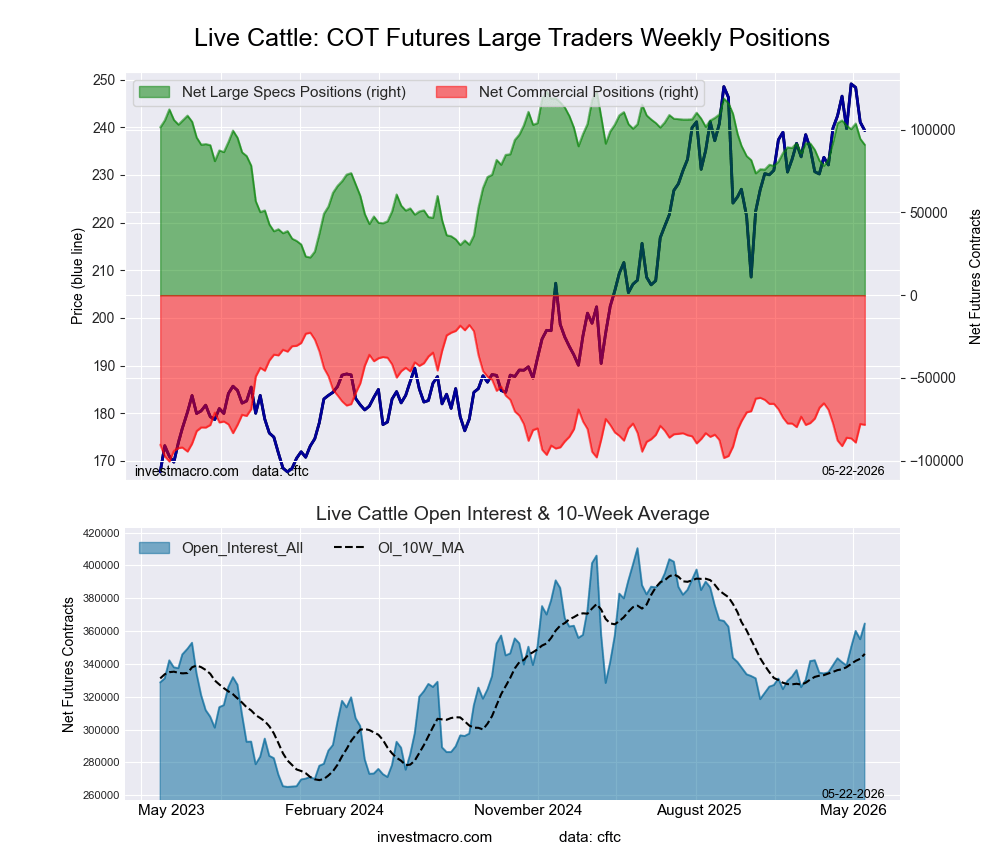
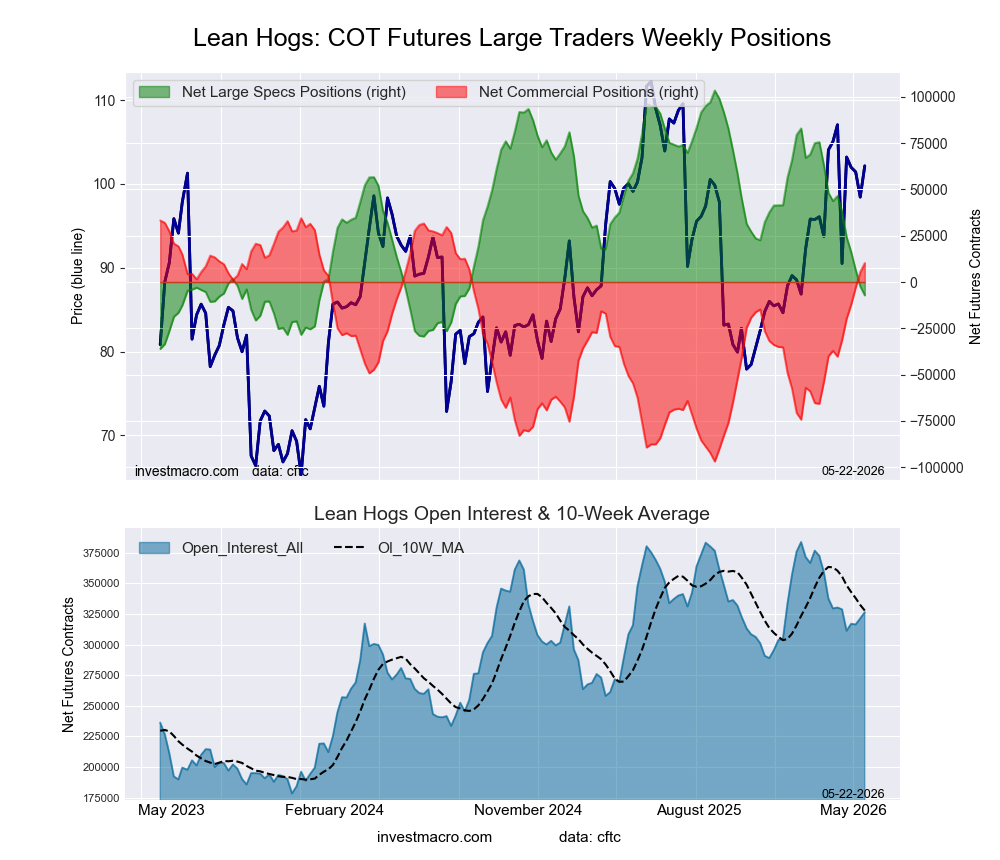
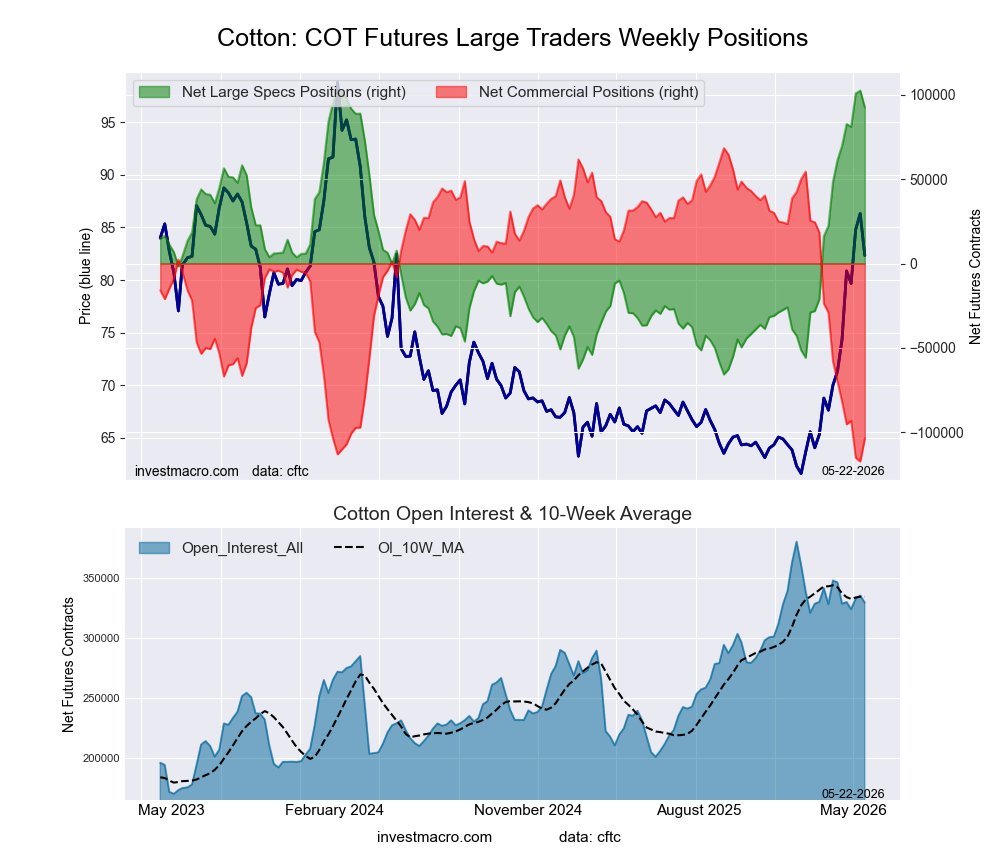
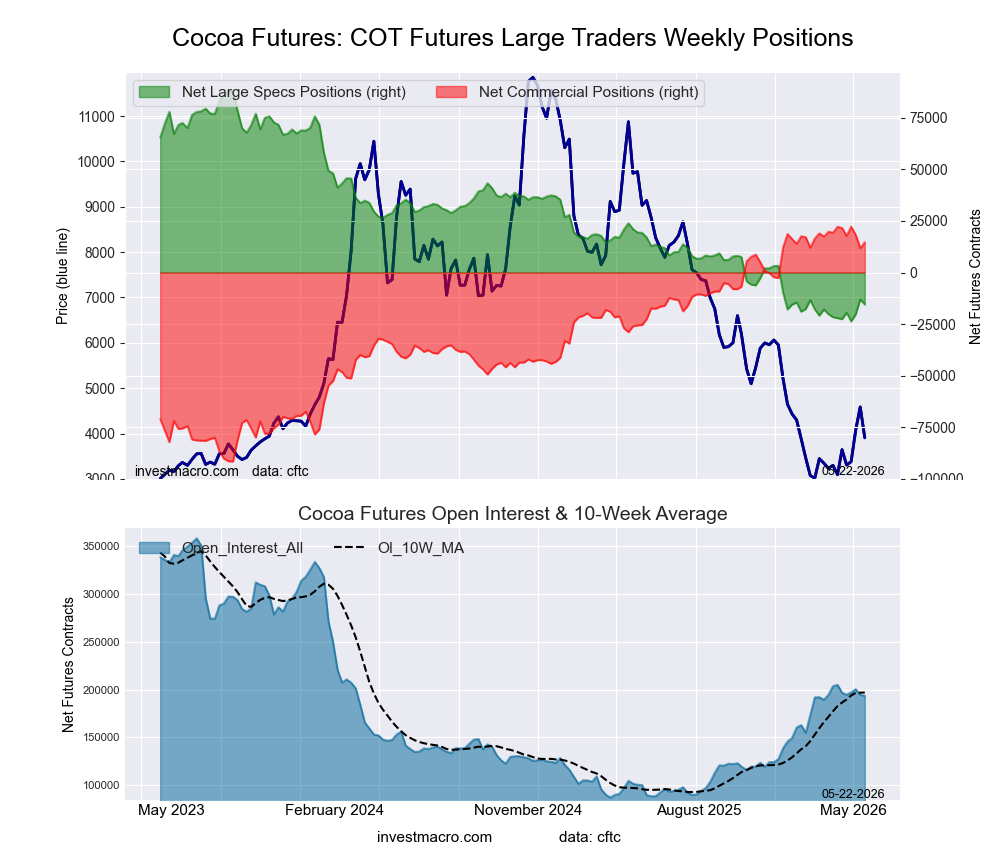
The markets with the declines in speculator bets this week were Corn (-25,435 contracts) with Soybeans (-11,764 contracts), Cotton (-9,919 contracts), Coffee (-5,099 contracts), Lean Hogs (-4,863 contracts), Cocoa (-2,507 contracts) and with Live Cattle (-3,616 contracts) also seeing lower bets on the week.
Free Reports:
Coffee led the Soft Commodities price performances this week in an overall down week for most of the Soft Commodities markets. Coffee rose by over 2% with a 2.14% gain and was followed by Soybeans, which was virtually unchanged but had a 0.21% uptick.
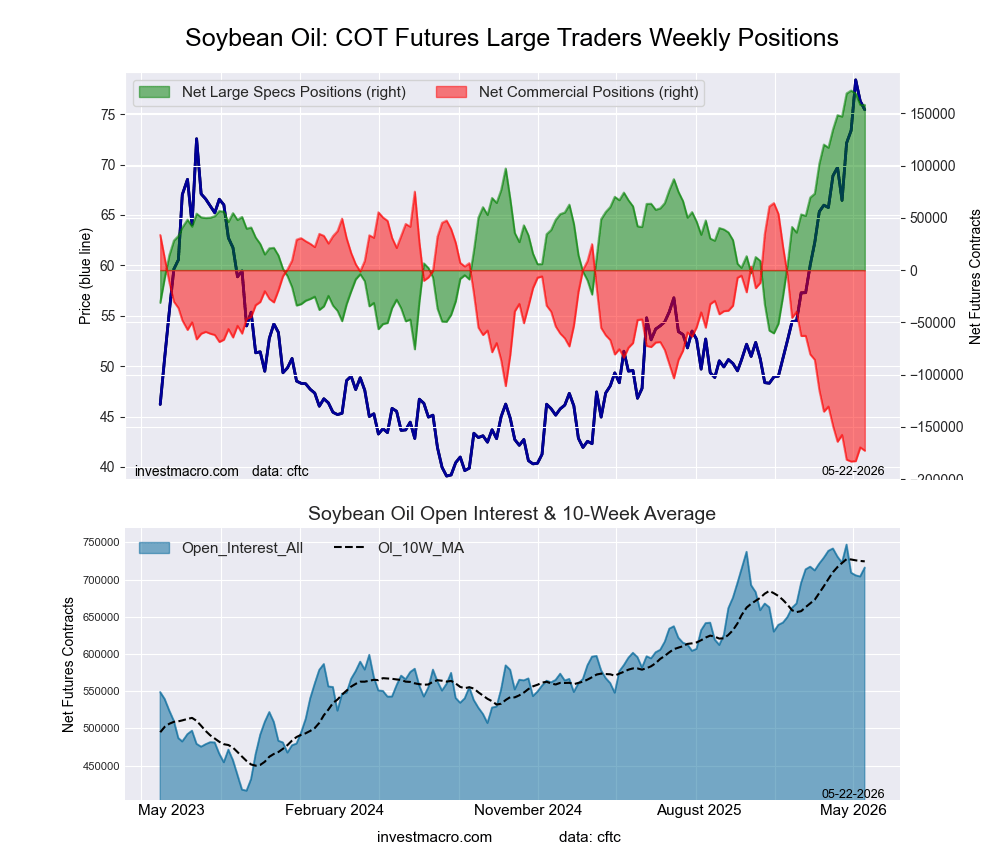
On the downside, Soybean Oil dipped by -0.67%, followed by Sugar, which was lower by -0.68%, and by Corn, which declined by -0.91%.
Next, Soybean Oil fell by more than -2% with a -2.21% decline, followed by Wheat, which fell by -2.40%, and Lean Hogs, which dropped by -2.85%. Cocoa was lower by over -5% with a -5.26% shortfall, while Cotton was lower by -5.76% over the past five days.
The biggest negative gainer on the week was Live Cattle, which dropped by almost 7% with a -6.94% decrease for the past 5 days.
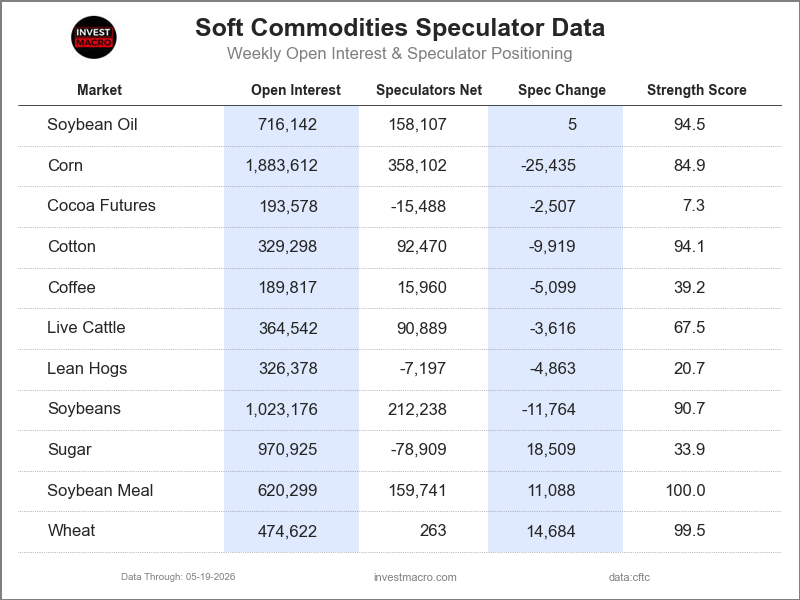
Legend: Weekly Speculators Change | Speculators Current Net Position | Speculators Strength Score compared to last 3-Years (0-100 range)
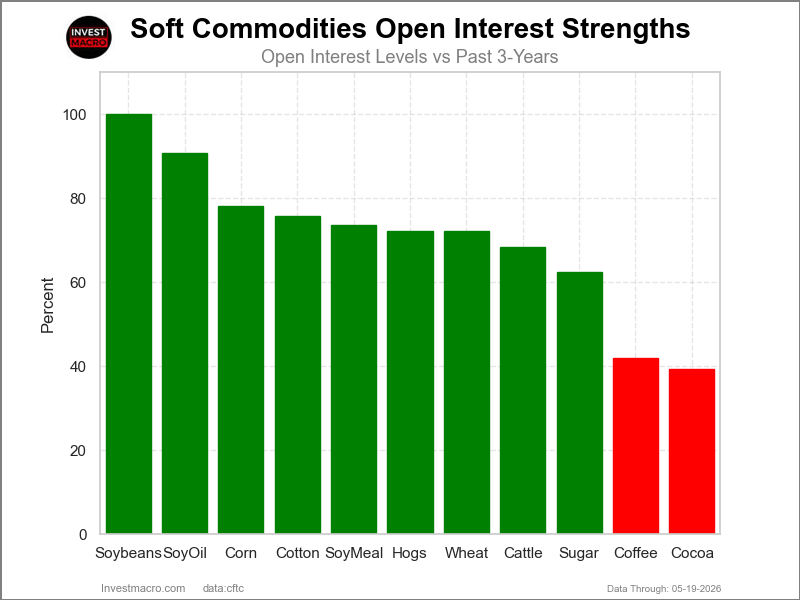
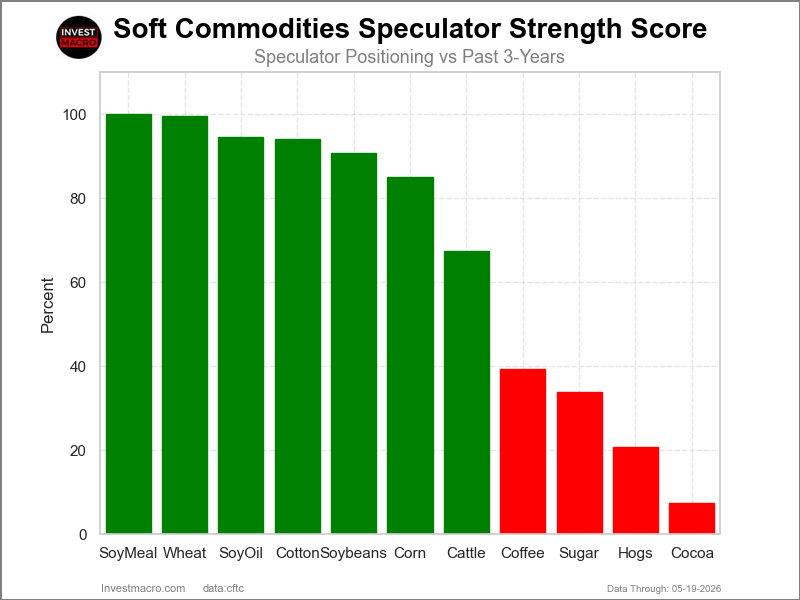
COT Strength Scores (a normalized measure of Speculator positions over a 3-Year range, from 0 to 100 where above 80 is Extreme-Bullish and below 20 is Extreme-Bearish) showed that Soybean Meal (100 percent) and Wheat (99 percent) lead the softs markets this week. Soybean Oil (94 percent), Cotton (94 percent) and Soybeans (91 percent) come in as the next highest in the weekly strength scores.
On the downside, Cocoa (7 percent) comes in at the lowest strength levels currently and are in Extreme-Bearish territory (below 20 percent). The next lowest strength scores are Lean Hogs (21 percent), Sugar (34 percent) and Coffee (39 percent).
Strength Statistics:
Corn (84.9 percent) vs Corn previous week (88.4 percent)
Sugar (33.9 percent) vs Sugar previous week (30.3 percent)
Coffee (39.2 percent) vs Coffee previous week (44.3 percent)
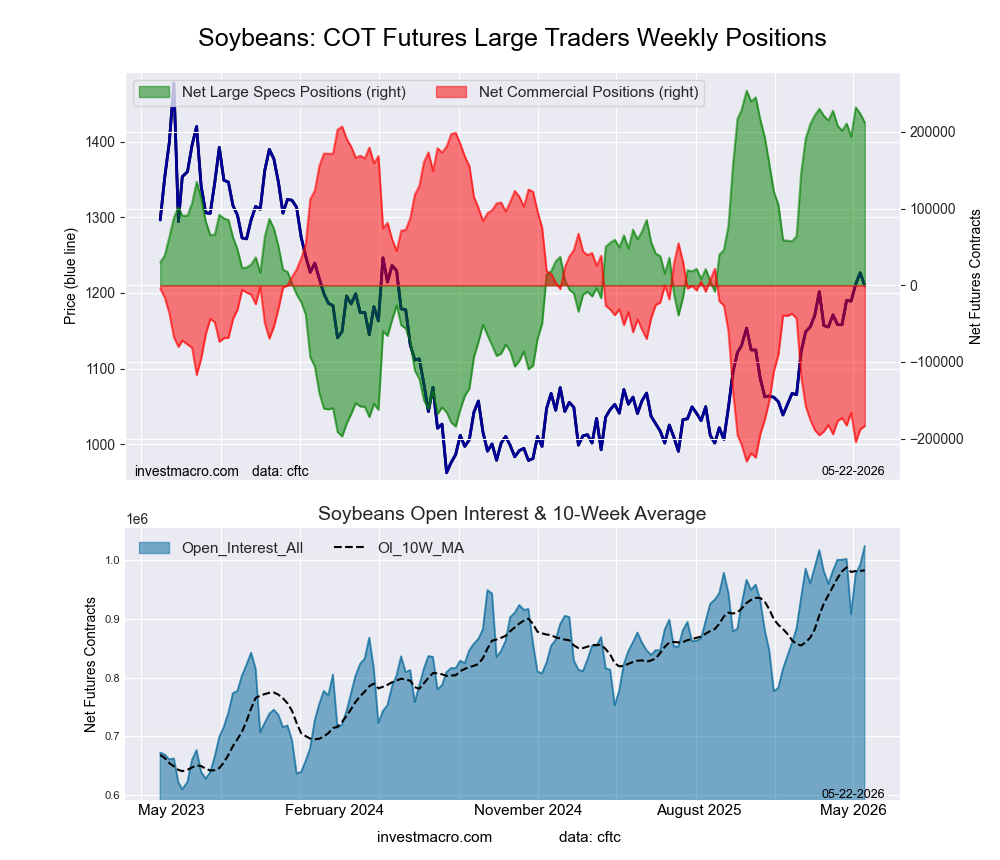
Soybeans (90.7 percent) vs Soybeans previous week (93.3 percent)
Soybean Oil (94.5 percent) vs Soybean Oil previous week (94.5 percent)
Soybean Meal (100.0 percent) vs Soybean Meal previous week (95.5 percent)
Live Cattle (67.5 percent) vs Live Cattle previous week (71.1 percent)
Lean Hogs (20.7 percent) vs Lean Hogs previous week (24.2 percent)
Cotton (94.1 percent) vs Cotton previous week (100.0 percent)
Cocoa (7.3 percent) vs Cocoa previous week (9.5 percent)
Wheat (99.5 percent) vs Wheat previous week (87.2 percent)
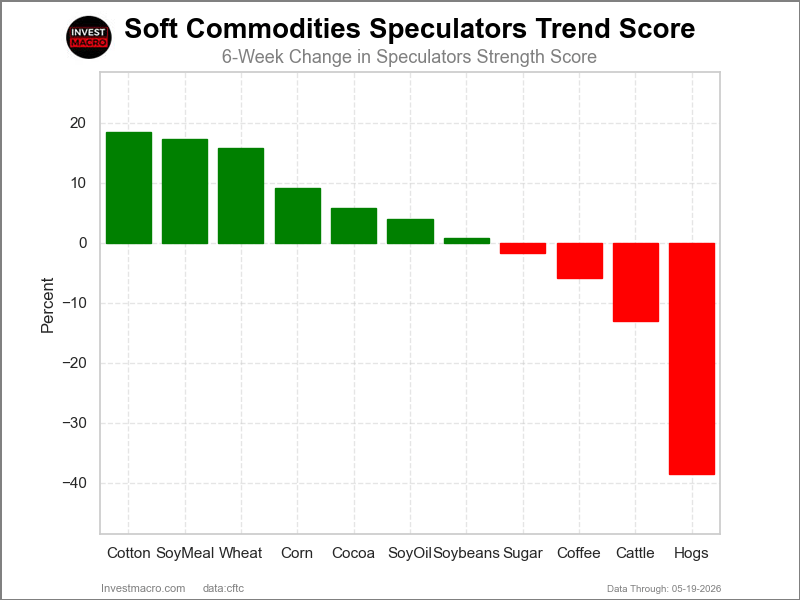
COT Strength Score Trends (or move index, calculates the 6-week changes in strength scores) showed that Cotton (19 percent) and Soybean Meal (17 percent) lead the past six weeks trends for soft commodities. Wheat (16 percent), Corn (9 percent) and Cocoa (6 percent) are the next highest positive movers in the latest trends data.
Lean Hogs (-38 percent) leads the downside trend scores currently with Live Cattle (-13 percent), Coffee (-6 percent) and Sugar (-2 percent) following next with lower trend scores.
Strength Trend Statistics:
Corn (9.2 percent) vs Corn previous week (6.6 percent)
Sugar (-1.6 percent) vs Sugar previous week (-6.3 percent)
Coffee (-5.8 percent) vs Coffee previous week (-4.0 percent)
Soybeans (0.8 percent) vs Soybeans previous week (-0.9 percent)
Soybean Oil (4.0 percent) vs Soybean Oil previous week (9.5 percent)
Soybean Meal (17.4 percent) vs Soybean Meal previous week (11.5 percent)
Live Cattle (-13.0 percent) vs Live Cattle previous week (2.2 percent)
Lean Hogs (-38.5 percent) vs Lean Hogs previous week (-33.0 percent)
Cotton (18.5 percent) vs Cotton previous week (32.1 percent)
Cocoa (5.9 percent) vs Cocoa previous week (7.7 percent)
Wheat (15.9 percent) vs Wheat previous week (-4.2 percent)
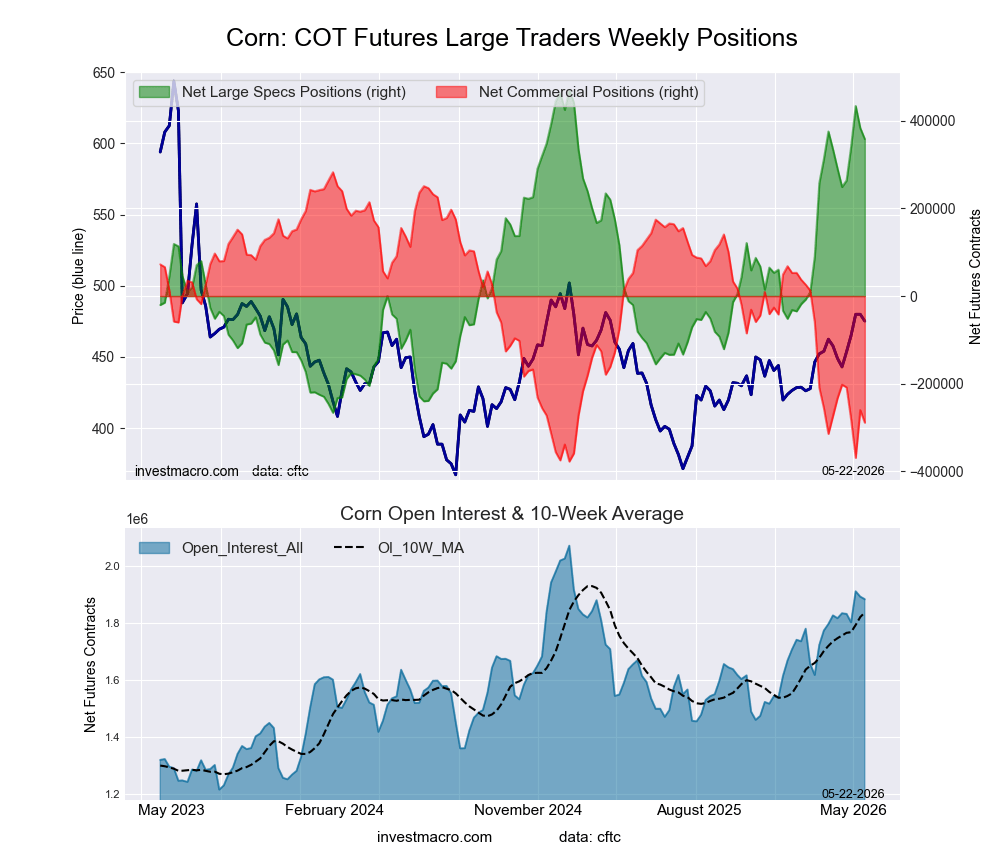
Our weekly trend-following model classifies the current market price position as: Uptrend.
| CORN Futures Statistics | SPECULATORS | COMMERCIALS | SMALL TRADERS |
| – Percent of Open Interest Longs: | 30.2 | 40.2 | 6.9 |
| – Percent of Open Interest Shorts: | 11.2 | 55.5 | 10.6 |
| – Net Position: | 358,102 | -288,625 | -69,477 |
| – Gross Longs: | 569,689 | 757,342 | 129,874 |
| – Gross Shorts: | 211,587 | 1,045,967 | 199,351 |
| – Long to Short Ratio: | 2.7 to 1 | 0.7 to 1 | 0.7 to 1 |
| NET POSITION TREND: | |||
| – Strength Index Score (3 Year Range Pct): | 84.9 | 13.4 | 45.9 |
| – Strength Index Reading (3 Year Range): | Bullish-Extreme | Bearish-Extreme | Bearish |
| NET POSITION MOVEMENT INDEX: | |||
| – 6-Week Change in Strength Index: | 9.2 | -8.4 | -9.9 |
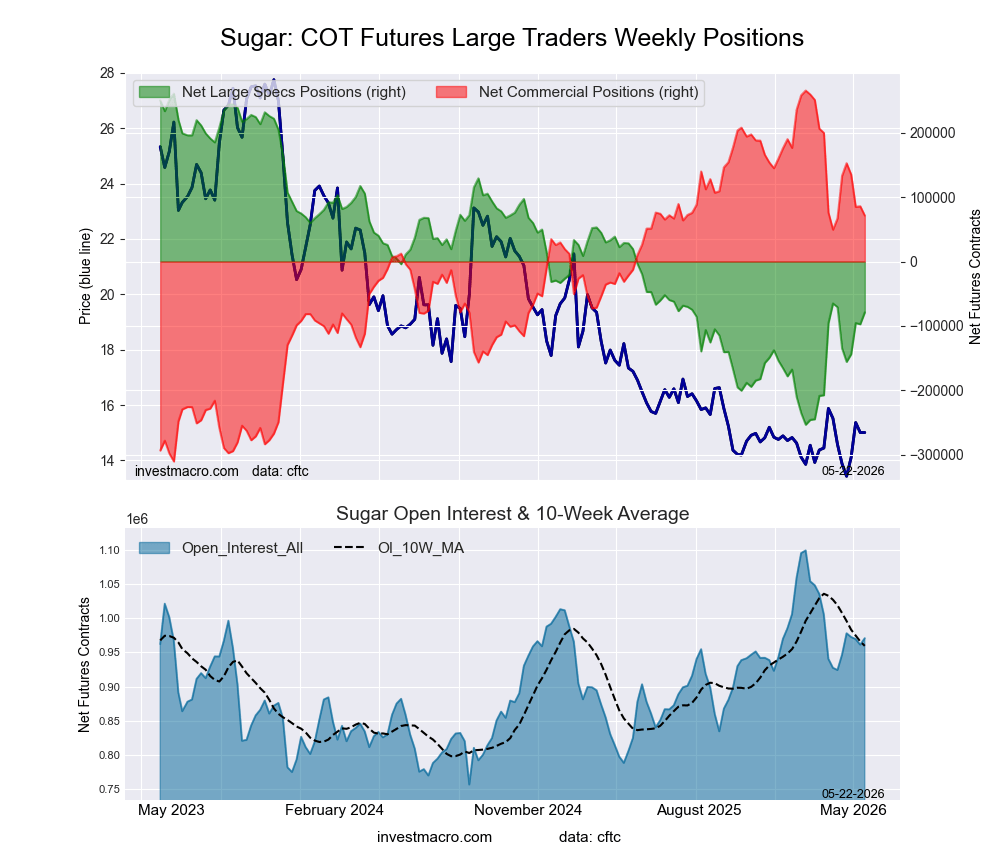
Our weekly trend-following model classifies the current market price position as: Weak Downtrend.
| SUGAR Futures Statistics | SPECULATORS | COMMERCIALS | SMALL TRADERS |
| – Percent of Open Interest Longs: | 24.7 | 50.2 | 8.9 |
| – Percent of Open Interest Shorts: | 32.9 | 42.8 | 8.1 |
| – Net Position: | -78,909 | 71,445 | 7,464 |
| – Gross Longs: | 240,256 | 487,110 | 86,264 |
| – Gross Shorts: | 319,165 | 415,665 | 78,800 |
| – Long to Short Ratio: | 0.8 to 1 | 1.2 to 1 | 1.1 to 1 |
| NET POSITION TREND: | |||
| – Strength Index Score (3 Year Range Pct): | 33.9 | 66.3 | 41.4 |
| – Strength Index Reading (3 Year Range): | Bearish | Bullish | Bearish |
| NET POSITION MOVEMENT INDEX: | |||
| – 6-Week Change in Strength Index: | -1.6 | 0.7 | 4.9 |
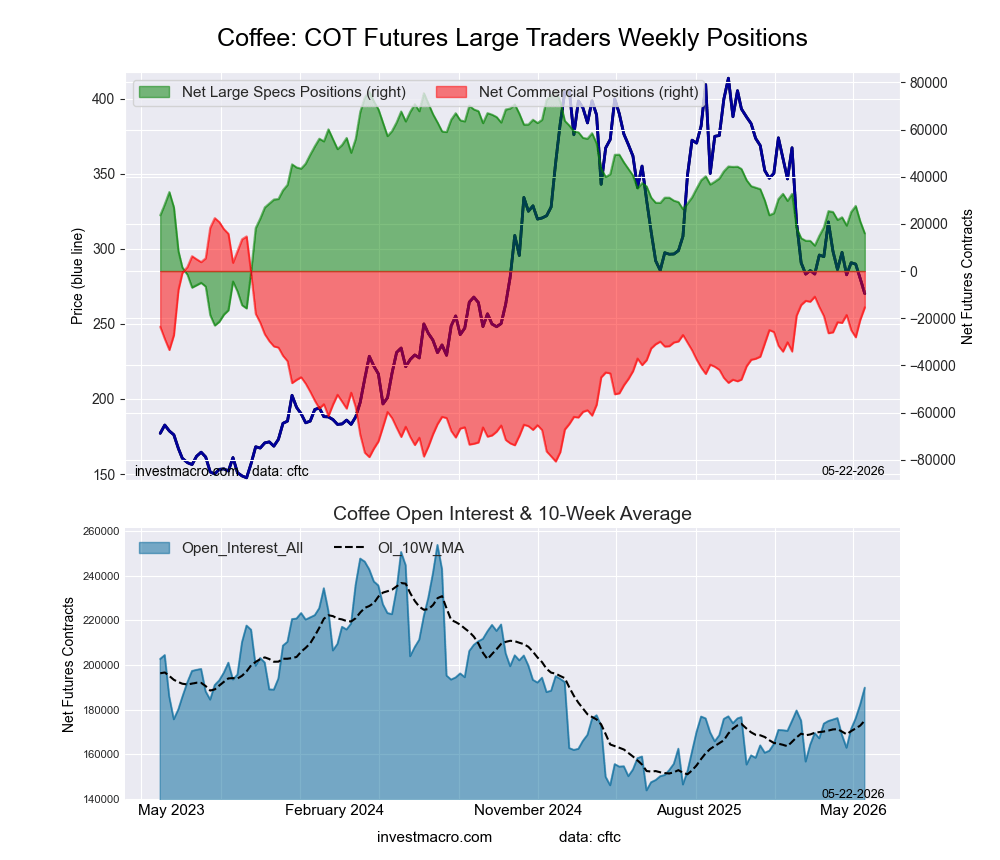
Our weekly trend-following model classifies the current market price position as: Downtrend.
| COFFEE Futures Statistics | SPECULATORS | COMMERCIALS | SMALL TRADERS |
| – Percent of Open Interest Longs: | 28.3 | 38.6 | 4.3 |
| – Percent of Open Interest Shorts: | 19.9 | 46.7 | 4.6 |
| – Net Position: | 15,960 | -15,381 | -579 |
| – Gross Longs: | 53,799 | 73,346 | 8,137 |
| – Gross Shorts: | 37,839 | 88,727 | 8,716 |
| – Long to Short Ratio: | 1.4 to 1 | 0.8 to 1 | 0.9 to 1 |
| NET POSITION TREND: | |||
| – Strength Index Score (3 Year Range Pct): | 39.2 | 63.3 | 5.3 |
| – Strength Index Reading (3 Year Range): | Bearish | Bullish | Bearish-Extreme |
| NET POSITION MOVEMENT INDEX: | |||
| – 6-Week Change in Strength Index: | -5.8 | 6.1 | -9.8 |
Our weekly trend-following model classifies the current market price position as: Uptrend.
| SOYBEANS Futures Statistics | SPECULATORS | COMMERCIALS | SMALL TRADERS |
| – Percent of Open Interest Longs: | 28.2 | 46.9 | 5.1 |
| – Percent of Open Interest Shorts: | 7.5 | 64.8 | 7.9 |
| – Net Position: | 212,238 | -183,266 | -28,972 |
| – Gross Longs: | 288,551 | 479,743 | 52,144 |
| – Gross Shorts: | 76,313 | 663,009 | 81,116 |
| – Long to Short Ratio: | 3.8 to 1 | 0.7 to 1 | 0.6 to 1 |
| NET POSITION TREND: | |||
| – Strength Index Score (3 Year Range Pct): | 90.7 | 10.7 | 22.2 |
| – Strength Index Reading (3 Year Range): | Bullish-Extreme | Bearish-Extreme | Bearish |
| NET POSITION MOVEMENT INDEX: | |||
| – 6-Week Change in Strength Index: | 0.8 | -1.4 | 7.4 |
Our weekly trend-following model classifies the current market price position as: Uptrend.
| SOYBEAN OIL Futures Statistics | SPECULATORS | COMMERCIALS | SMALL TRADERS |
| – Percent of Open Interest Longs: | 29.3 | 44.7 | 6.0 |
| – Percent of Open Interest Shorts: | 7.2 | 68.9 | 4.0 |
| – Net Position: | 158,107 | -172,756 | 14,649 |
| – Gross Longs: | 209,661 | 320,353 | 43,107 |
| – Gross Shorts: | 51,554 | 493,109 | 28,458 |
| – Long to Short Ratio: | 4.1 to 1 | 0.6 to 1 | 1.5 to 1 |
| NET POSITION TREND: | |||
| – Strength Index Score (3 Year Range Pct): | 94.5 | 4.0 | 91.3 |
| – Strength Index Reading (3 Year Range): | Bullish-Extreme | Bearish-Extreme | Bullish-Extreme |
| NET POSITION MOVEMENT INDEX: | |||
| – 6-Week Change in Strength Index: | 4.0 | -3.3 | -6.3 |
Our weekly trend-following model classifies the current market price position as: Uptrend.
| SOYBEAN MEAL Futures Statistics | SPECULATORS | COMMERCIALS | SMALL TRADERS |
| – Percent of Open Interest Longs: | 33.5 | 39.5 | 8.2 |
| – Percent of Open Interest Shorts: | 7.8 | 69.1 | 4.4 |
| – Net Position: | 159,741 | -183,762 | 24,021 |
| – Gross Longs: | 208,033 | 245,006 | 51,157 |
| – Gross Shorts: | 48,292 | 428,768 | 27,136 |
| – Long to Short Ratio: | 4.3 to 1 | 0.6 to 1 | 1.9 to 1 |
| NET POSITION TREND: | |||
| – Strength Index Score (3 Year Range Pct): | 100.0 | 0.0 | 77.3 |
| – Strength Index Reading (3 Year Range): | Bullish-Extreme | Bearish-Extreme | Bullish |
| NET POSITION MOVEMENT INDEX: | |||
| – 6-Week Change in Strength Index: | 17.4 | -18.8 | 21.7 |
Our weekly trend-following model classifies the current market price position as: Weak Uptrend.
| LIVE CATTLE Futures Statistics | SPECULATORS | COMMERCIALS | SMALL TRADERS |
| – Percent of Open Interest Longs: | 42.9 | 28.7 | 8.2 |
| – Percent of Open Interest Shorts: | 18.0 | 50.2 | 11.7 |
| – Net Position: | 90,889 | -78,298 | -12,591 |
| – Gross Longs: | 156,500 | 104,747 | 29,883 |
| – Gross Shorts: | 65,611 | 183,045 | 42,474 |
| – Long to Short Ratio: | 2.4 to 1 | 0.6 to 1 | 0.7 to 1 |
| NET POSITION TREND: | |||
| – Strength Index Score (3 Year Range Pct): | 67.5 | 26.9 | 54.1 |
| – Strength Index Reading (3 Year Range): | Bullish | Bearish | Bullish |
| NET POSITION MOVEMENT INDEX: | |||
| – 6-Week Change in Strength Index: | -13.0 | 11.5 | 12.9 |
Our weekly trend-following model classifies the current market price position as: Uptrend.
| LEAN HOGS Futures Statistics | SPECULATORS | COMMERCIALS | SMALL TRADERS |
| – Percent of Open Interest Longs: | 27.3 | 39.8 | 7.1 |
| – Percent of Open Interest Shorts: | 29.5 | 36.7 | 8.0 |
| – Net Position: | -7,197 | 10,228 | -3,031 |
| – Gross Longs: | 89,006 | 129,862 | 23,175 |
| – Gross Shorts: | 96,203 | 119,634 | 26,206 |
| – Long to Short Ratio: | 0.9 to 1 | 1.1 to 1 | 0.9 to 1 |
| NET POSITION TREND: | |||
| – Strength Index Score (3 Year Range Pct): | 20.7 | 81.5 | 62.5 |
| – Strength Index Reading (3 Year Range): | Bearish | Bullish-Extreme | Bullish |
| NET POSITION MOVEMENT INDEX: | |||
| – 6-Week Change in Strength Index: | -38.5 | 38.5 | 20.1 |
Our weekly trend-following model classifies the current market price position as: Uptrend.
| COTTON Futures Statistics | SPECULATORS | COMMERCIALS | SMALL TRADERS |
| – Percent of Open Interest Longs: | 41.7 | 33.7 | 5.9 |
| – Percent of Open Interest Shorts: | 13.6 | 65.1 | 2.5 |
| – Net Position: | 92,470 | -103,545 | 11,075 |
| – Gross Longs: | 137,278 | 110,947 | 19,326 |
| – Gross Shorts: | 44,808 | 214,492 | 8,251 |
| – Long to Short Ratio: | 3.1 to 1 | 0.5 to 1 | 2.3 to 1 |
| NET POSITION TREND: | |||
| – Strength Index Score (3 Year Range Pct): | 94.1 | 7.3 | 79.3 |
| – Strength Index Reading (3 Year Range): | Bullish-Extreme | Bearish-Extreme | Bullish |
| NET POSITION MOVEMENT INDEX: | |||
| – 6-Week Change in Strength Index: | 18.5 | -18.2 | 14.5 |
Our weekly trend-following model classifies the current market price position as: Weak Downtrend.
| COCOA Futures Statistics | SPECULATORS | COMMERCIALS | SMALL TRADERS |
| – Percent of Open Interest Longs: | 20.7 | 52.6 | 5.6 |
| – Percent of Open Interest Shorts: | 28.7 | 45.0 | 5.2 |
| – Net Position: | -15,488 | 14,704 | 784 |
| – Gross Longs: | 40,134 | 101,849 | 10,773 |
| – Gross Shorts: | 55,622 | 87,145 | 9,989 |
| – Long to Short Ratio: | 0.7 to 1 | 1.2 to 1 | 1.1 to 1 |
| NET POSITION TREND: | |||
| – Strength Index Score (3 Year Range Pct): | 7.3 | 93.4 | 34.7 |
| – Strength Index Reading (3 Year Range): | Bearish-Extreme | Bullish-Extreme | Bearish |
| NET POSITION MOVEMENT INDEX: | |||
| – 6-Week Change in Strength Index: | 5.9 | -6.6 | 8.7 |
Our weekly trend-following model classifies the current market price position as: Uptrend.
| WHEAT Futures Statistics | SPECULATORS | COMMERCIALS | SMALL TRADERS |
| – Percent of Open Interest Longs: | 30.2 | 33.1 | 7.6 |
| – Percent of Open Interest Shorts: | 30.1 | 33.5 | 7.2 |
| – Net Position: | 263 | -1,992 | 1,729 |
| – Gross Longs: | 143,267 | 157,233 | 36,126 |
| – Gross Shorts: | 143,004 | 159,225 | 34,397 |
| – Long to Short Ratio: | 1.0 to 1 | 1.0 to 1 | 1.1 to 1 |
| NET POSITION TREND: | |||
| – Strength Index Score (3 Year Range Pct): | 99.5 | 0.9 | 62.7 |
| – Strength Index Reading (3 Year Range): | Bullish-Extreme | Bearish-Extreme | Bullish |
| NET POSITION MOVEMENT INDEX: | |||
| – 6-Week Change in Strength Index: | 15.9 | -17.0 | 3.8 |
Article By InvestMacro – Receive our weekly COT Reports by Email
*COT Report: The COT data, released weekly to the public each Friday, is updated through the most recent Tuesday (data is 3 days old) and shows a quick view of how large speculators or non-commercials (for-profit traders) were positioned in the futures markets.
The CFTC categorizes trader positions according to commercial hedgers (traders who use futures contracts for hedging as part of the business), non-commercials (large traders who speculate to realize trading profits) and nonreportable traders (usually small traders/speculators) as well as their open interest (contracts open in the market at time of reporting).See CFTC criteria here.
All information and opinions on this website and contained in this article are for general informational purposes only and do not constitute investment advice.
By Jeffrey Young, Georgia Institute of Technology You’ve probably heard artificial intelligence models described as…
Source: Barry Dawes (7/23/26) Barry Dawes of Martin Place Securities shares his analysis of the…
By JustMarkets The US stock indices ended Thursday’s session with a notable decline amid a…
By Analytical Department RoboForex USD/JPY soared to 163.81 on Friday, marking a new 40-year high.…
By JustMarkets The US equities ended Wednesday’s session lower amid investor caution ahead of the…
By Analytical Department RoboForex EUR/USD rose to 1.1429 on Thursday, with the US dollar continuing…
This website uses cookies.