By InvestMacro
Here are the latest charts and statistics for the Commitment of Traders (COT) data published by the Commodities Futures Trading Commission (CFTC).
The latest COT data is updated through Tuesday May 19th and shows a quick view of how large traders (for-profit speculators and commercial entities) were positioned in the futures markets.
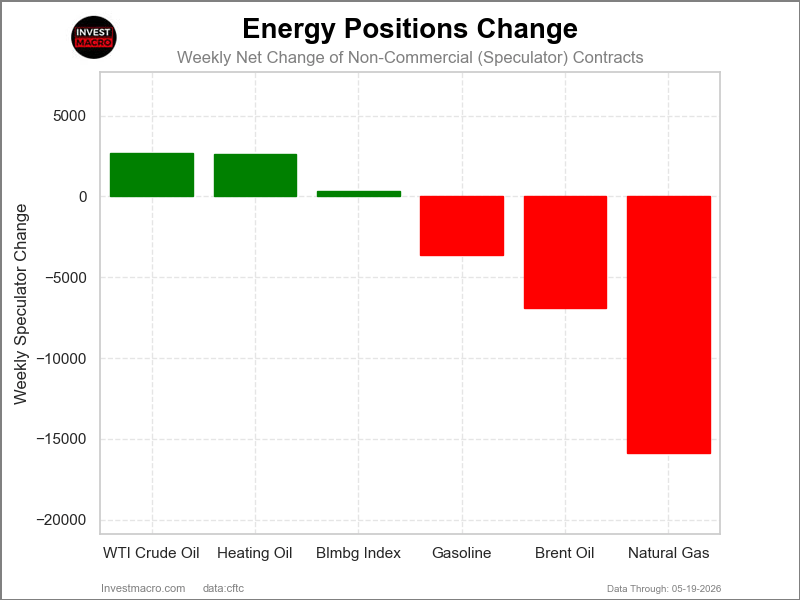
The COT energy market speculator bets were mixed this week as three out of the six energy markets we cover had higher positioning while the other three markets had lower speculator contracts.
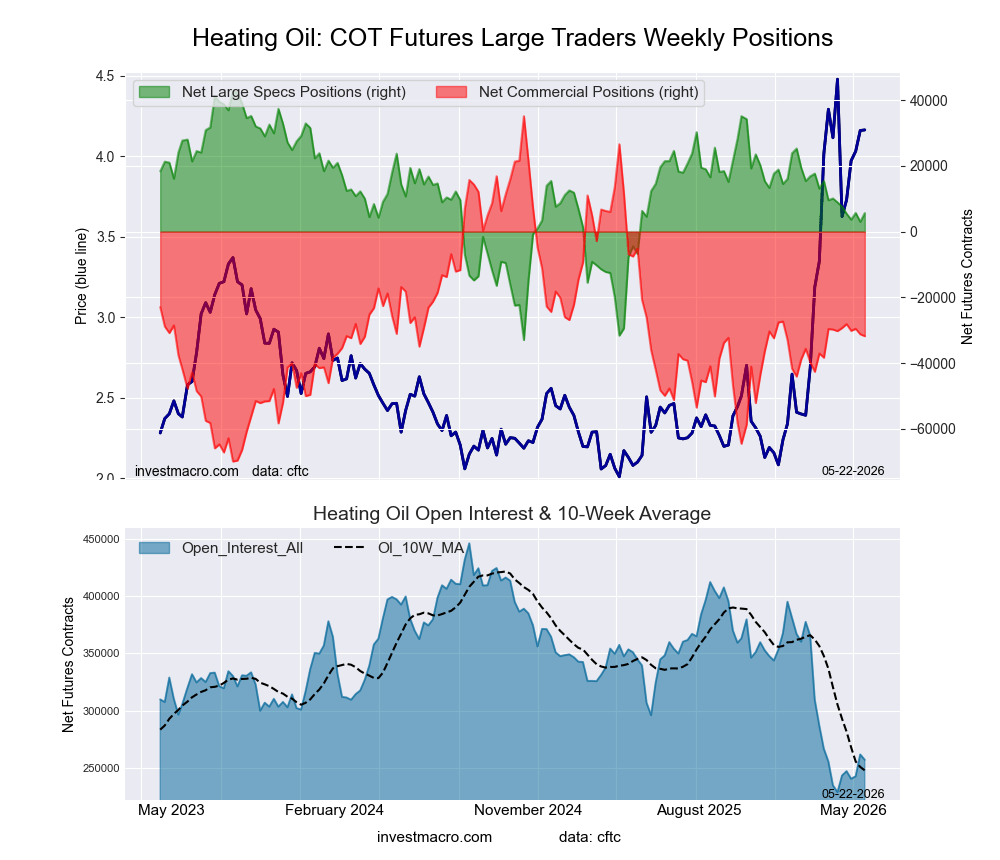
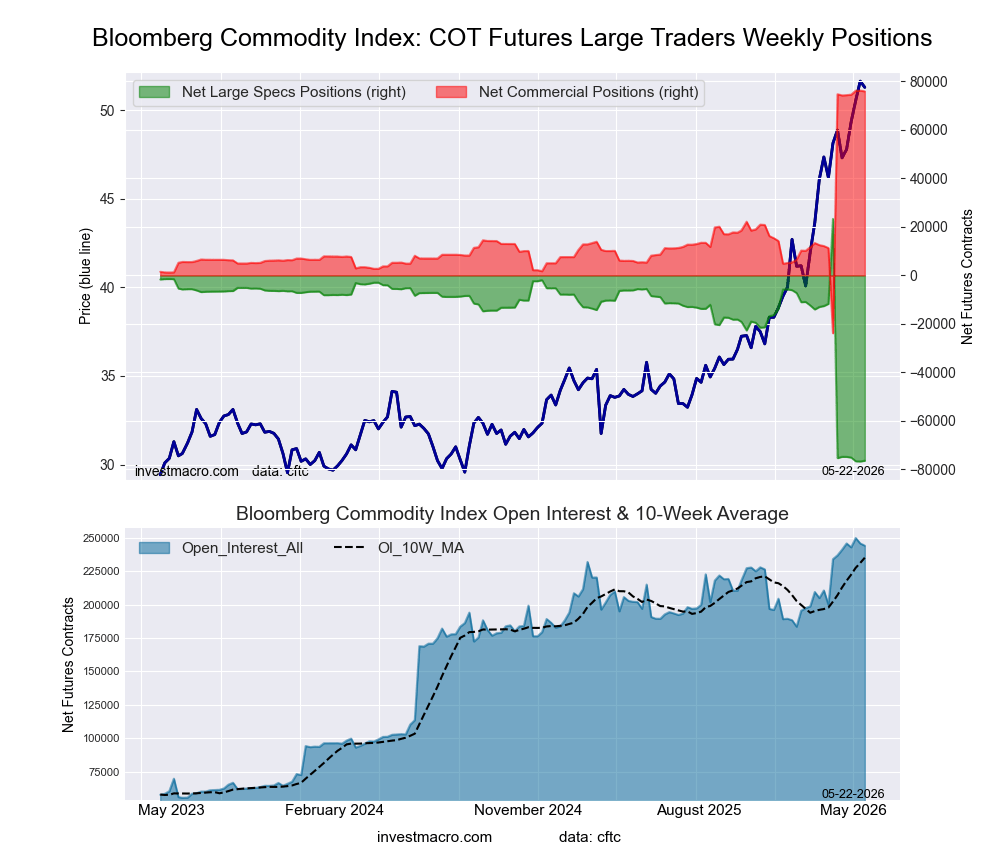
Leading the gains for the energy markets with a modest weekly rise was WTI Crude (2,703 contracts) with Heating Oil (2,635 contracts) and the Bloomberg Index (315 contracts) also having positive weeks.
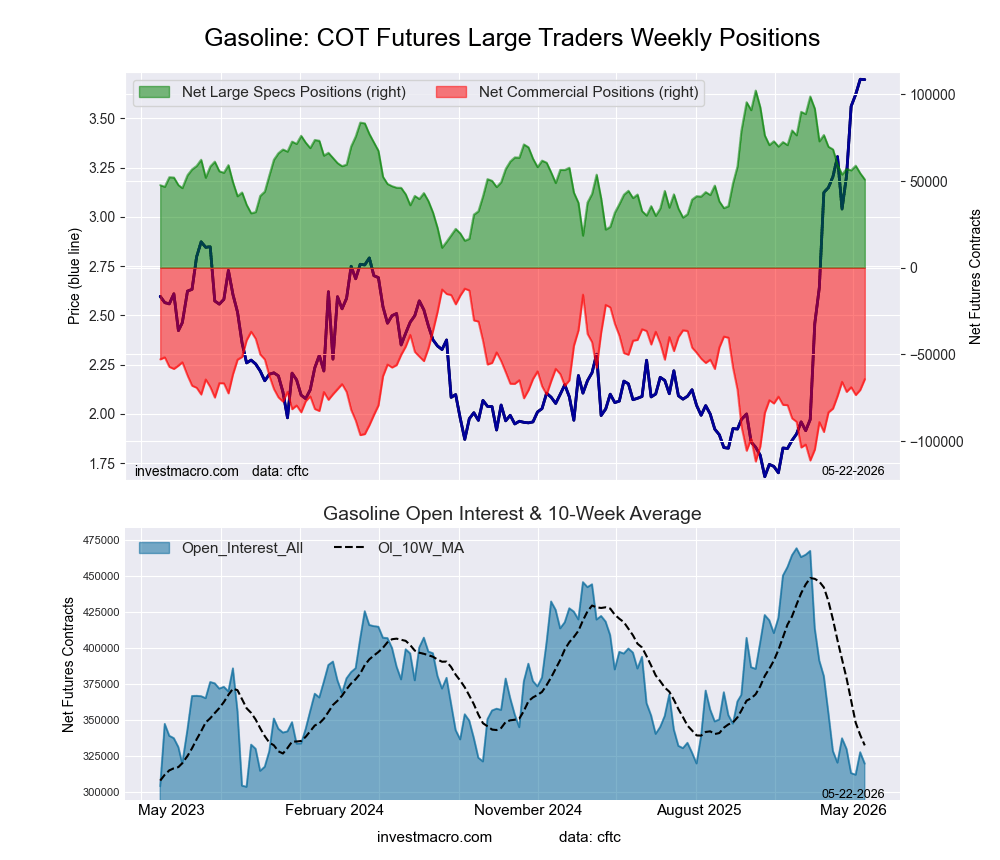
The markets with declines in speculator bets for the week were Natural Gas (-15,890 contracts), Brent Oil (-6,932 contracts) and with Gasoline (-3,596 contracts) also seeing lower bets on the week.
Free Reports:
The Energy Markets saw lower prices across the board with all six of the markets we cover seeing weekly declines. The lowest weekly decline for the past five days was by the Bloomberg Commodity Index, which fell by -1.94%. Natural Gas came in second with a -3.61% decline, and Gasoline fell by almost -4% with a -3.96% shortfall.
Heating Oil was next with a -5.42% decrease on the week, while WTI Crude Oil dropped by -6.78%. Brent Oil saw the biggest decline on the week with a -7.25% drop.
All the Energy Markets have seen higher percentages over the past 30 days, with Gasoline the highest at a 16.68% increase over the past 30 days.
Natural Gas is the only market with a decline over the past 90 days as it has fallen by -16.98%. Gasoline prices are up 78.39% over the past 90 days. Heating Oil, WTI Crude Oil, and Brent Oil are all higher by over 50% in these past 90 days.
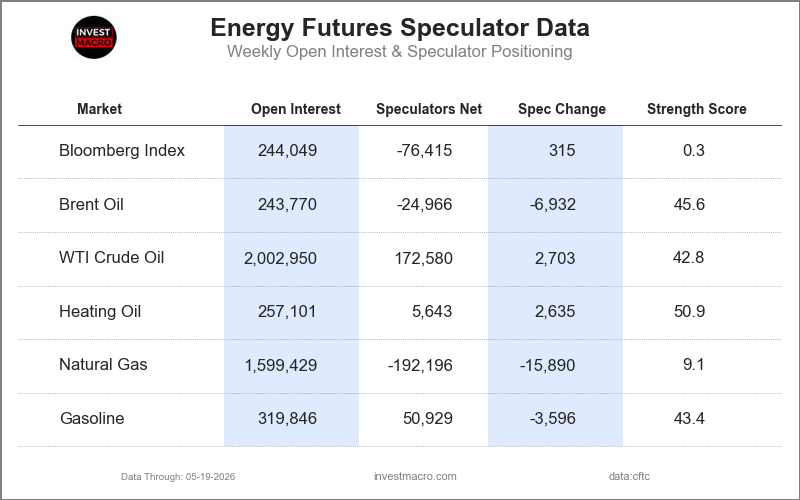
Legend: Weekly Speculators Change | Speculators Current Net Position | Speculators Strength Score compared to last 3-Years (0-100 range)
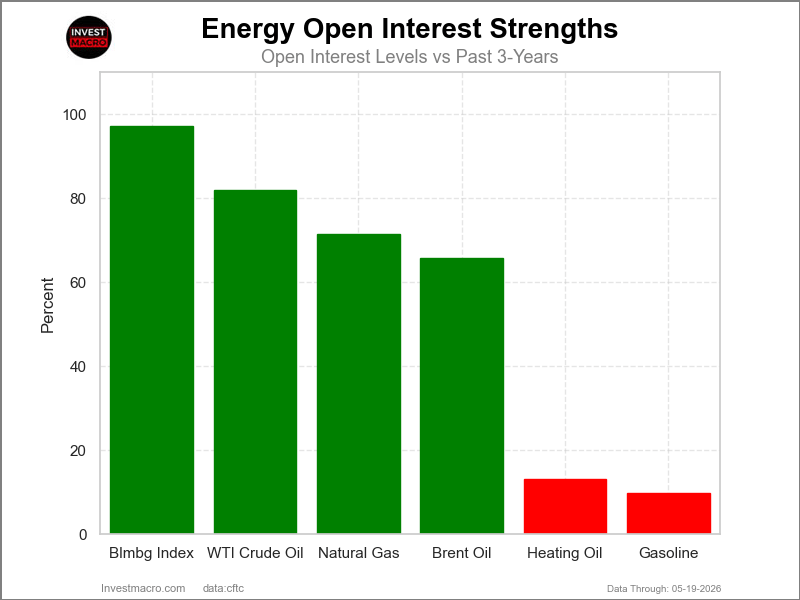
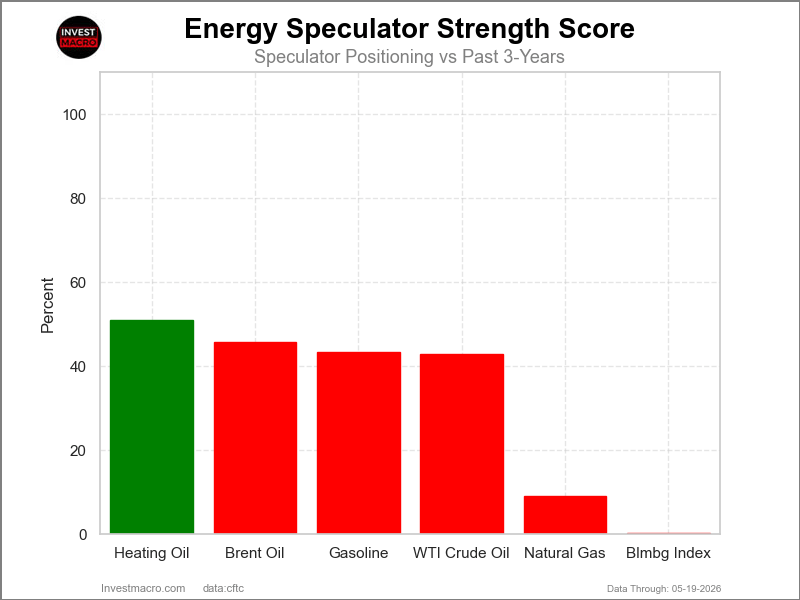
COT Strength Scores (a normalized measure of Speculator positions over a 3-Year range, from 0 to 100 where above 80 is Extreme-Bullish and below 20 is Extreme-Bearish) showed that Heating Oil (50.9 percent) leads the energy markets this week.
On the downside, the Bloomberg Commodity Index (0.3 percent) and Natural Gas (9.1 percent) come in at the lowest strength level currently and are in Extreme-Bearish territory (below 20 percent). The next lowest strength score was WTI Crude (42.8 percent).
Strength Statistics:
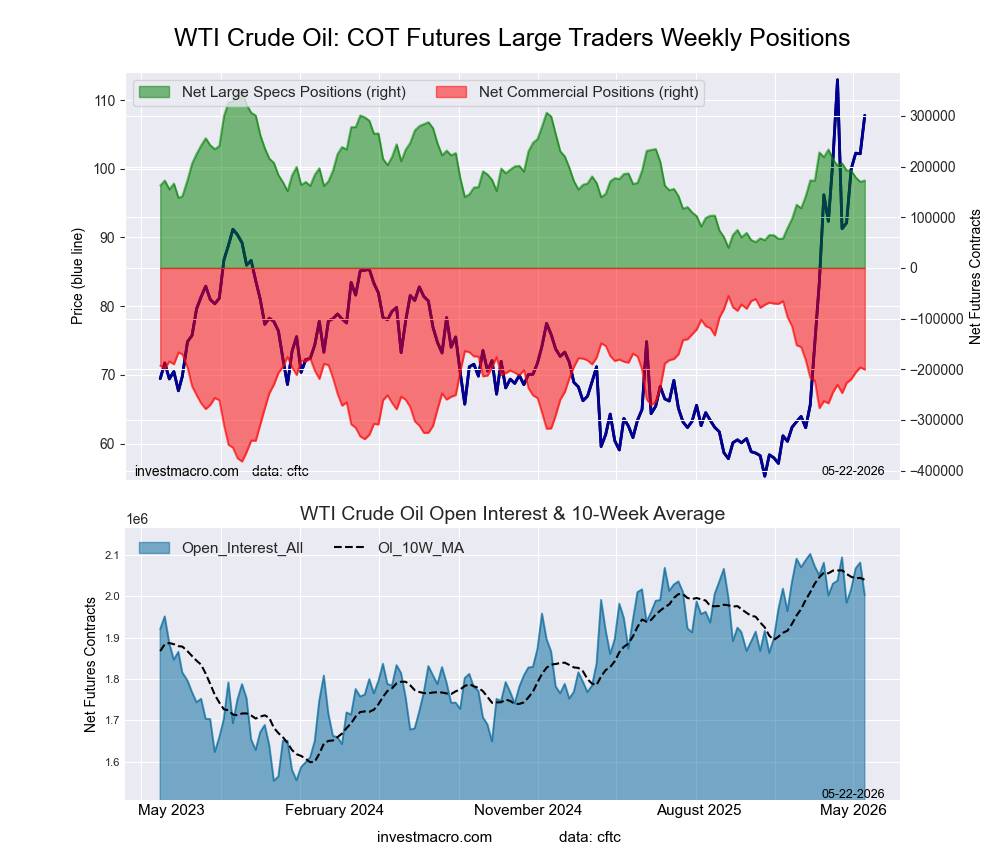
WTI Crude Oil (42.8 percent) vs WTI Crude Oil previous week (41.9 percent)
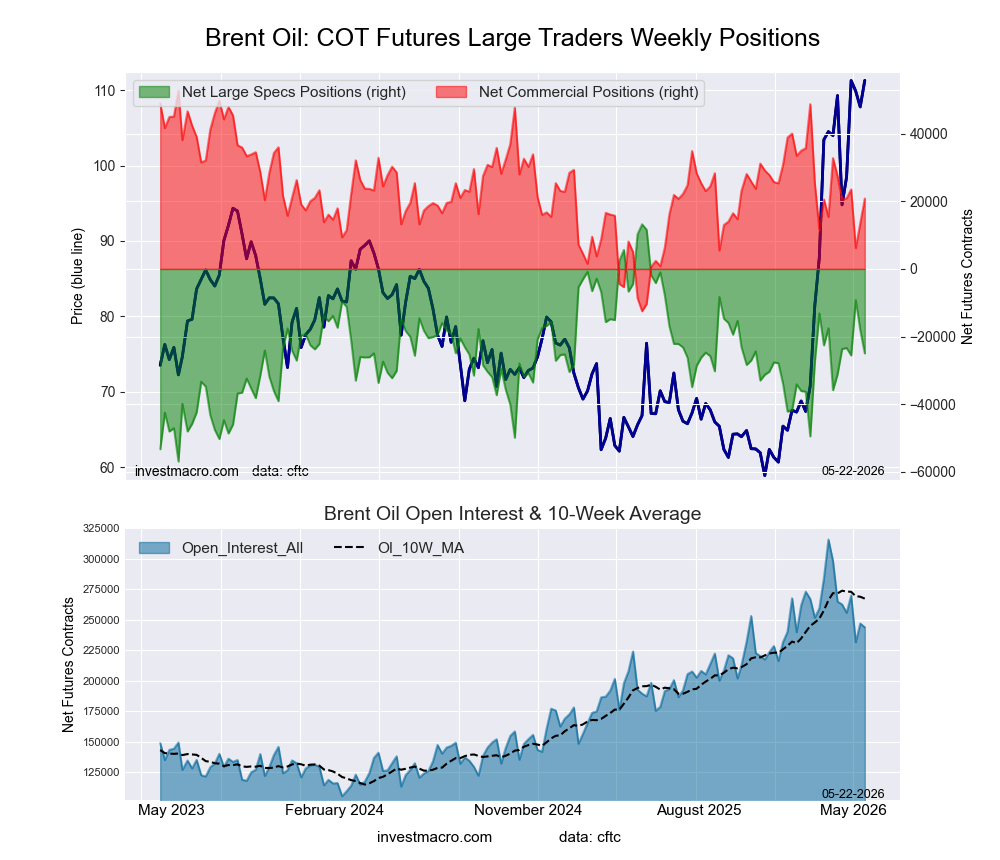
Brent Crude Oil (45.6 percent) vs Brent Crude Oil previous week (55.4 percent)
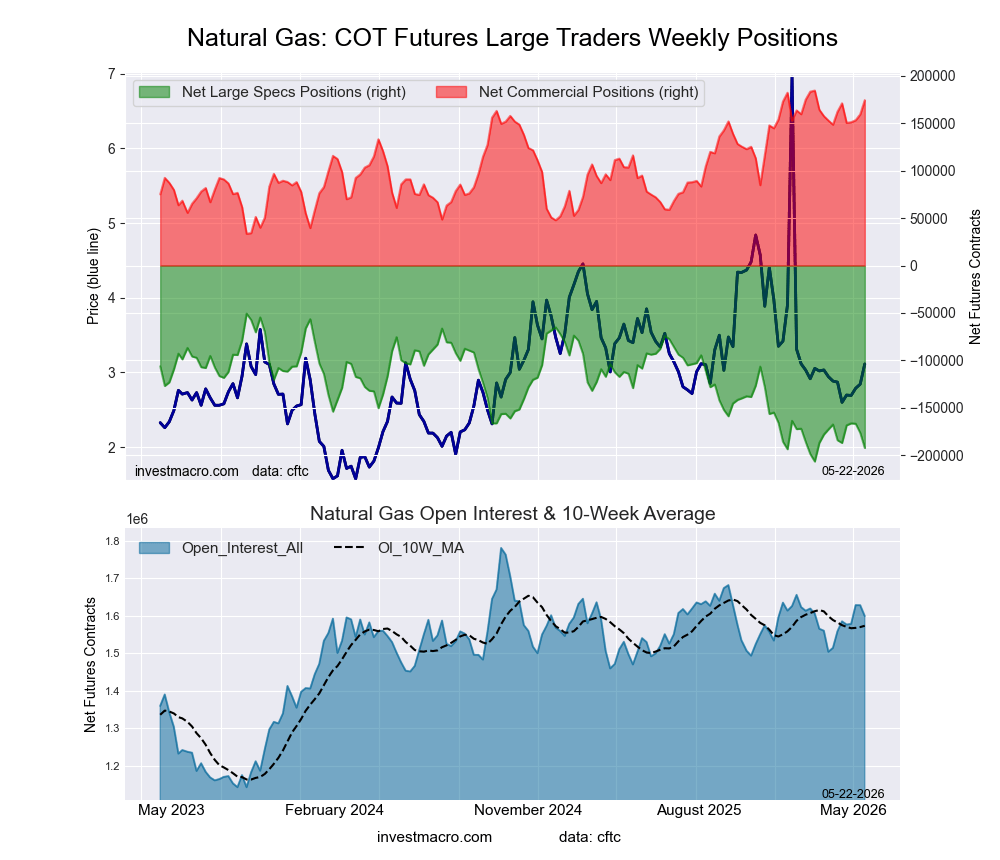
Natural Gas (9.1 percent) vs Natural Gas previous week (19.3 percent)
Gasoline (43.4 percent) vs Gasoline previous week (47.4 percent)
Heating Oil (50.9 percent) vs Heating Oil previous week (47.4 percent)
Bloomberg Commodity Index (0.3 percent) vs Bloomberg Commodity Index previous week (0.0 percent)
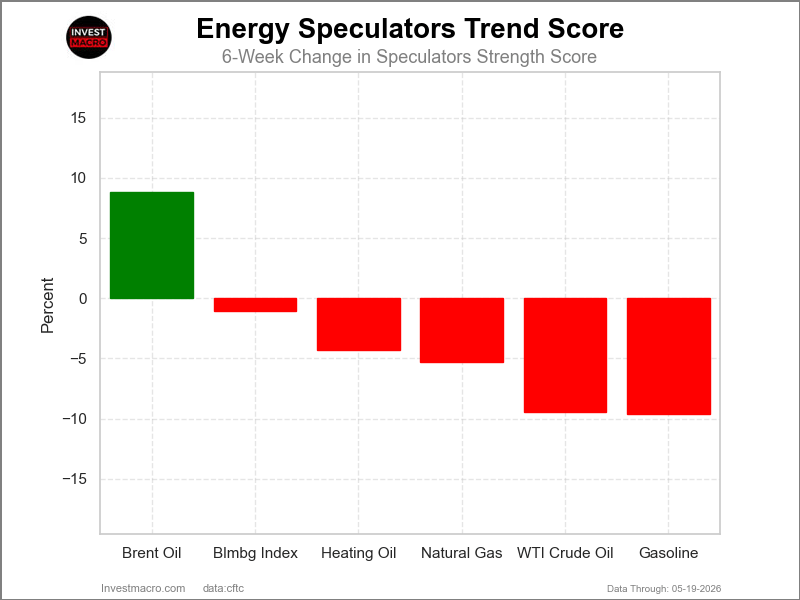
COT Strength Score Trends (or move index, calculates the 6-week changes in strength scores) showed that Brent Oil (8.8 percent) leads the past six weeks trends for the energy markets and was the only positive mover in the latest trends data.
Gasoline (-9.6 percent) and WTI Crude (-9.5 percent) lead the downside trend scores currently with Natural Gas (-5.3 percent) as the next market with lower trend scores.
Move Statistics:
WTI Crude Oil (-9.5 percent) vs WTI Crude Oil previous week (-14.1 percent)
Brent Crude Oil (8.8 percent) vs Brent Crude Oil previous week (25.4 percent)
Natural Gas (-5.3 percent) vs Natural Gas previous week (-5.7 percent)
Gasoline (-9.6 percent) vs Gasoline previous week (-15.2 percent)
Heating Oil (-4.3 percent) vs Heating Oil previous week (-9.3 percent)
Bloomberg Commodity Index (-1.1 percent) vs Bloomberg Commodity Index previous week (-100.0 percent)
Our weekly trend-following model classifies the current market price position as: Uptrend.
| WTI Crude Oil Futures Statistics | SPECULATORS | COMMERCIALS | SMALL TRADERS |
| – Percent of Open Interest Longs: | 19.2 | 45.0 | 3.9 |
| – Percent of Open Interest Shorts: | 10.6 | 55.0 | 2.5 |
| – Net Position: | 172,580 | -200,409 | 27,829 |
| – Gross Longs: | 384,294 | 900,625 | 78,845 |
| – Gross Shorts: | 211,714 | 1,101,034 | 51,016 |
| – Long to Short Ratio: | 1.8 to 1 | 0.8 to 1 | 1.5 to 1 |
| NET POSITION TREND: | |||
| – Strength Index Score (3 Year Range Pct): | 42.8 | 55.5 | 55.9 |
| – Strength Index Reading (3 Year Range): | Bearish | Bullish | Bullish |
| NET POSITION MOVEMENT INDEX: | |||
| – 6-Week Change in Strength Index: | -9.5 | 9.2 | -1.0 |
Our weekly trend-following model classifies the current market price position as: Uptrend.
| Brent Crude Oil Futures Statistics | SPECULATORS | COMMERCIALS | SMALL TRADERS |
| – Percent of Open Interest Longs: | 24.5 | 34.2 | 4.1 |
| – Percent of Open Interest Shorts: | 34.8 | 25.6 | 2.4 |
| – Net Position: | -24,966 | 20,829 | 4,137 |
| – Gross Longs: | 59,813 | 83,284 | 9,907 |
| – Gross Shorts: | 84,779 | 62,455 | 5,770 |
| – Long to Short Ratio: | 0.7 to 1 | 1.3 to 1 | 1.7 to 1 |
| NET POSITION TREND: | |||
| – Strength Index Score (3 Year Range Pct): | 45.6 | 51.1 | 95.7 |
| – Strength Index Reading (3 Year Range): | Bearish | Bullish | Bullish-Extreme |
| NET POSITION MOVEMENT INDEX: | |||
| – 6-Week Change in Strength Index: | 8.8 | -10.1 | 5.7 |
Our weekly trend-following model classifies the current market price position as: Downtrend.
| Natural Gas Futures Statistics | SPECULATORS | COMMERCIALS | SMALL TRADERS |
| – Percent of Open Interest Longs: | 14.4 | 36.2 | 3.7 |
| – Percent of Open Interest Shorts: | 26.4 | 25.3 | 2.6 |
| – Net Position: | -192,196 | 174,224 | 17,972 |
| – Gross Longs: | 230,391 | 578,821 | 59,864 |
| – Gross Shorts: | 422,587 | 404,597 | 41,892 |
| – Long to Short Ratio: | 0.5 to 1 | 1.4 to 1 | 1.4 to 1 |
| NET POSITION TREND: | |||
| – Strength Index Score (3 Year Range Pct): | 9.1 | 93.3 | 48.5 |
| – Strength Index Reading (3 Year Range): | Bearish-Extreme | Bullish-Extreme | Bearish |
| NET POSITION MOVEMENT INDEX: | |||
| – 6-Week Change in Strength Index: | -5.3 | 8.0 | -9.9 |
Our weekly trend-following model classifies the current market price position as: Uptrend.
| Nasdaq Mini Futures Statistics | SPECULATORS | COMMERCIALS | SMALL TRADERS |
| – Percent of Open Interest Longs: | 25.1 | 47.4 | 8.5 |
| – Percent of Open Interest Shorts: | 9.1 | 67.5 | 4.3 |
| – Net Position: | 50,929 | -64,242 | 13,313 |
| – Gross Longs: | 80,150 | 151,612 | 27,203 |
| – Gross Shorts: | 29,221 | 215,854 | 13,890 |
| – Long to Short Ratio: | 2.7 to 1 | 0.7 to 1 | 2.0 to 1 |
| NET POSITION TREND: | |||
| – Strength Index Score (3 Year Range Pct): | 43.4 | 47.6 | 78.2 |
| – Strength Index Reading (3 Year Range): | Bearish | Bearish | Bullish |
| NET POSITION MOVEMENT INDEX: | |||
| – 6-Week Change in Strength Index: | -9.6 | 9.8 | -5.1 |
Our weekly trend-following model classifies the current market price position as: Uptrend.
| Heating Oil Futures Statistics | SPECULATORS | COMMERCIALS | SMALL TRADERS |
| – Percent of Open Interest Longs: | 16.2 | 46.3 | 19.6 |
| – Percent of Open Interest Shorts: | 14.0 | 58.6 | 9.4 |
| – Net Position: | 5,643 | -31,776 | 26,133 |
| – Gross Longs: | 41,735 | 118,940 | 50,371 |
| – Gross Shorts: | 36,092 | 150,716 | 24,238 |
| – Long to Short Ratio: | 1.2 to 1 | 0.8 to 1 | 2.1 to 1 |
| NET POSITION TREND: | |||
| – Strength Index Score (3 Year Range Pct): | 50.9 | 36.3 | 89.5 |
| – Strength Index Reading (3 Year Range): | Bullish | Bearish | Bullish-Extreme |
| NET POSITION MOVEMENT INDEX: | |||
| – 6-Week Change in Strength Index: | -4.3 | -1.5 | 13.1 |
Our weekly trend-following model classifies the current market price position as: Uptrend.
| Bloomberg Index Futures Statistics | SPECULATORS | COMMERCIALS | SMALL TRADERS |
| – Percent of Open Interest Longs: | 43.5 | 55.7 | 0.2 |
| – Percent of Open Interest Shorts: | 74.8 | 24.6 | 0.0 |
| – Net Position: | -76,415 | 75,902 | 513 |
| – Gross Longs: | 106,216 | 135,902 | 538 |
| – Gross Shorts: | 182,631 | 60,000 | 25 |
| – Long to Short Ratio: | 0.6 to 1 | 2.3 to 1 | 21.5 to 1 |
| NET POSITION TREND: | |||
| – Strength Index Score (3 Year Range Pct): | 0.3 | 99.7 | 66.0 |
| – Strength Index Reading (3 Year Range): | Bearish-Extreme | Bullish-Extreme | Bullish |
| NET POSITION MOVEMENT INDEX: | |||
| – 6-Week Change in Strength Index: | -1.1 | 1.2 | -8.6 |
Article By InvestMacro – Receive our weekly COT Reports by Email
*COT Report: The COT data, released weekly to the public each Friday, is updated through the most recent Tuesday (data is 3 days old) and shows a quick view of how large speculators or non-commercials (for-profit traders) were positioned in the futures markets.
The CFTC categorizes trader positions according to commercial hedgers (traders who use futures contracts for hedging as part of the business), non-commercials (large traders who speculate to realize trading profits) and nonreportable traders (usually small traders/speculators) as well as their open interest (contracts open in the market at time of reporting).See CFTC criteria here.
All information and opinions on this website and contained in this article are for general informational purposes only and do not constitute investment advice.
By Jeffrey Young, Georgia Institute of Technology You’ve probably heard artificial intelligence models described as…
Source: Barry Dawes (7/23/26) Barry Dawes of Martin Place Securities shares his analysis of the…
By JustMarkets The US stock indices ended Thursday’s session with a notable decline amid a…
By Analytical Department RoboForex USD/JPY soared to 163.81 on Friday, marking a new 40-year high.…
By JustMarkets The US equities ended Wednesday’s session lower amid investor caution ahead of the…
By Analytical Department RoboForex EUR/USD rose to 1.1429 on Thursday, with the US dollar continuing…
This website uses cookies.