
By InvestMacro
Here are the latest charts and statistics for the Commitment of Traders (COT) data published by the Commodities Futures Trading Commission (CFTC).
The latest COT data is updated through Tuesday June 9th and shows a quick view of how large traders (for-profit speculators and commercial entities) were positioned in the futures markets.
Weekly Speculator Changes led by Brent Oil
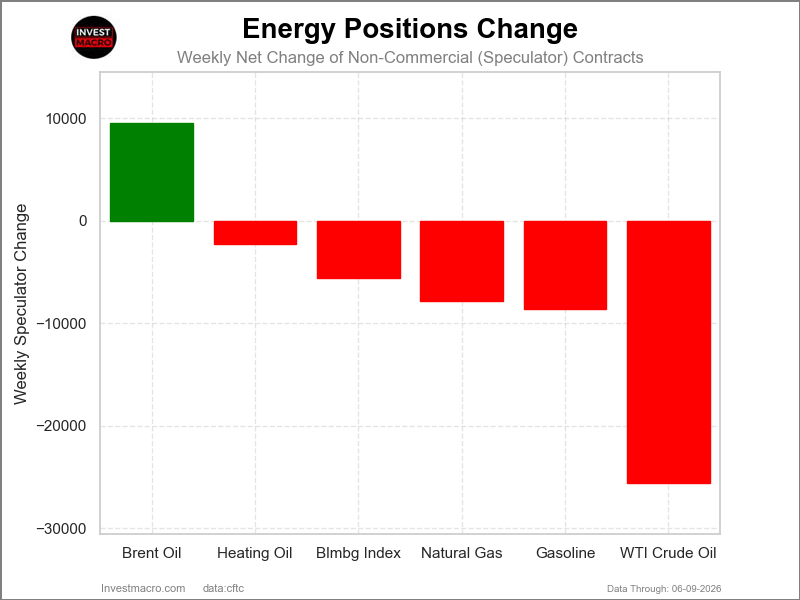
The COT energy market speculator bets were lower this week as just one out of the six energy markets we cover had higher positioning while the other five markets had lower speculator contracts.
Leading the gains for the energy markets was Brent Oil with an increase by 9,488 contracts.
The markets with declines in speculator bets for the week were WTI Crude (-25,573 contracts), Gasoline (-8,579 contracts), Natural Gas (-7,842 contracts), the Bloomberg Index (-5,608 contracts) and with Heating Oil (-2,267 contracts) also seeing lower bets on the week.
Free Reports:
 Get our Weekly Commitment of Traders Reports - See where the biggest traders (Hedge Funds and Commercial Hedgers) are positioned in the futures markets on a weekly basis.
 Download Our Metatrader 4 Indicators – Put Our Free MetaTrader 4 Custom Indicators on your charts when you join our Weekly Newsletter
Energy markets were lower across the board
For the Energy markets this week, they were all lower across the board with Natural Gas seeing the least decline on the week with a -1.29% shortfall. The Bloomberg Commodity Index dropped by -2.42%, while Gasoline was lower by -2.54%.
Heating Oil was lower by -9.23%, followed by WTI Crude Oil, which dropped by -9.73%.
Brent Oil was the biggest decliner on the week with a -9.76% decrease.
Energy Data:
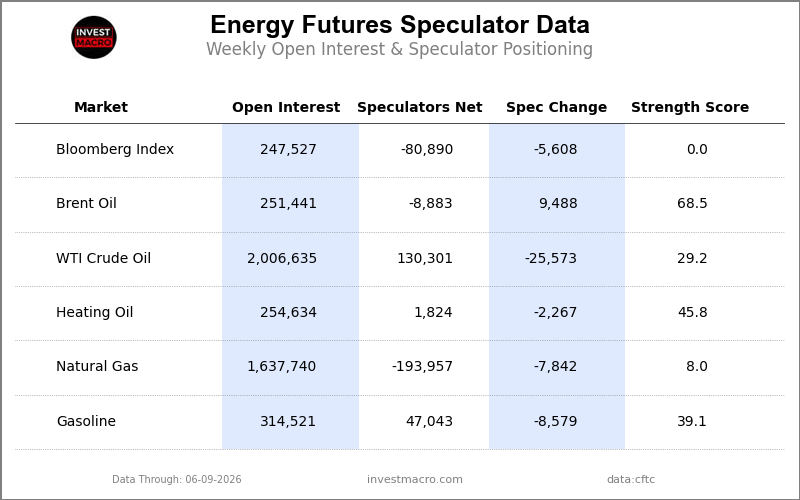
Legend: Weekly Speculators Change | Speculators Current Net Position | Speculators Strength Score compared to last 3-Years (0-100 range)
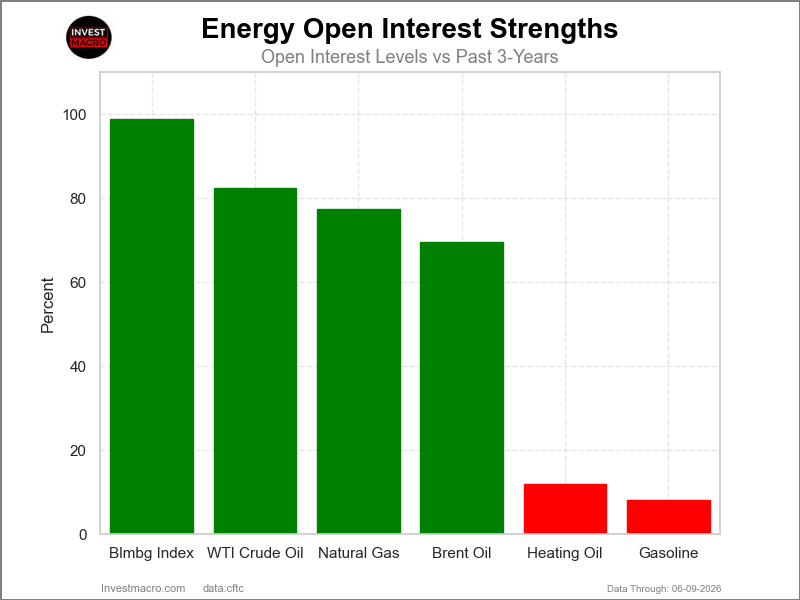
Strength Scores led by Brent Oil
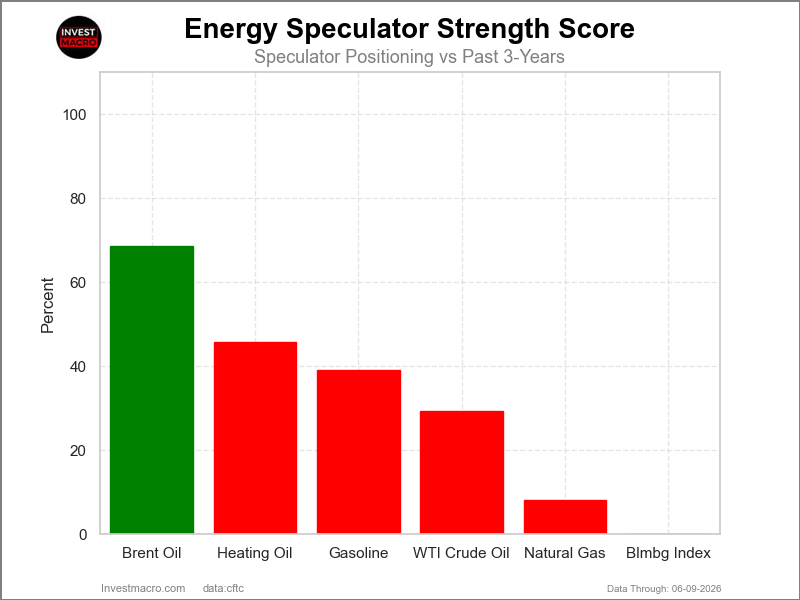
COT Strength Scores (a normalized measure of Speculator positions over a 3-Year range, from 0 to 100 where above 80 is Extreme-Bullish and below 20 is Extreme-Bearish) showed that Brent Oil (68.5 percent) leads the energy markets this week.
On the downside, the Bloomberg Commodity Index (0.0 percent) and Natural Gas (8.0 percent) come in at the lowest strength level currently and is in Extreme-Bearish territory (below 20 percent). The next lowest strength score was WTI Crude (29.2 percent).
Strength Statistics:
WTI Crude Oil (29.2 percent) vs WTI Crude Oil previous week (37.4 percent)
Brent Crude Oil (68.5 percent) vs Brent Crude Oil previous week (55.0 percent)
Natural Gas (8.0 percent) vs Natural Gas previous week (13.0 percent)
Gasoline (39.1 percent) vs Gasoline previous week (48.6 percent)
Heating Oil (45.8 percent) vs Heating Oil previous week (48.8 percent)
Bloomberg Commodity Index (0.0 percent) vs Bloomberg Commodity Index previous week (5.4 percent)
Brent Oil top the 6-Week Strength Trends
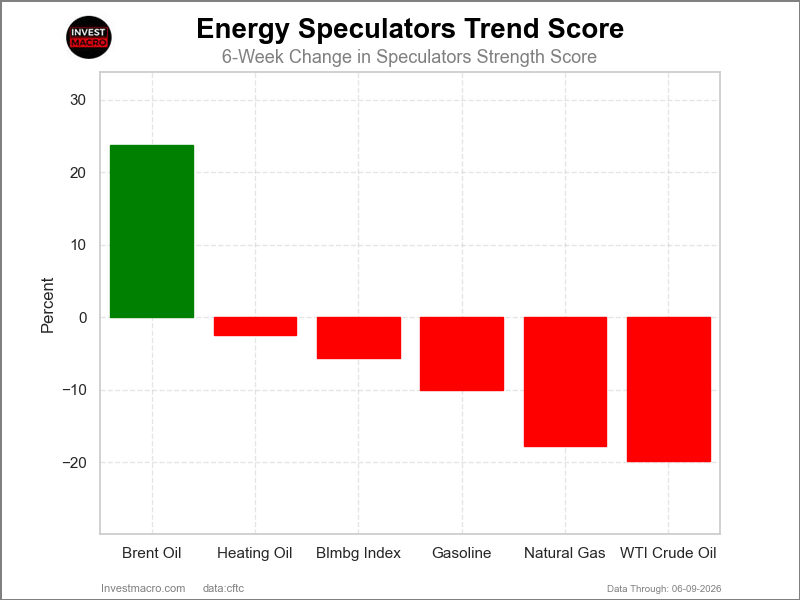
COT Strength Score Trends (or move index, calculates the 6-week changes in strength scores) showed that Brent Oil (23.8 percent) leads the past six weeks trends for the energy markets.
WTI Crude (-19.9 percent) leads the downside trend scores currently with Natural Gas (-17.8 percent) as the next market with lower trend scores.
Move Statistics:
WTI Crude Oil (-19.9 percent) vs WTI Crude Oil previous week (-11.7 percent)
Brent Crude Oil (23.8 percent) vs Brent Crude Oil previous week (7.1 percent)
Natural Gas (-17.8 percent) vs Natural Gas previous week (-11.4 percent)
Gasoline (-10.1 percent) vs Gasoline previous week (-1.6 percent)
Heating Oil (-2.4 percent) vs Heating Oil previous week (-1.8 percent)
Bloomberg Commodity Index (-5.6 percent) vs Bloomberg Commodity Index previous week (-0.4 percent)
Individual COT Market Charts:
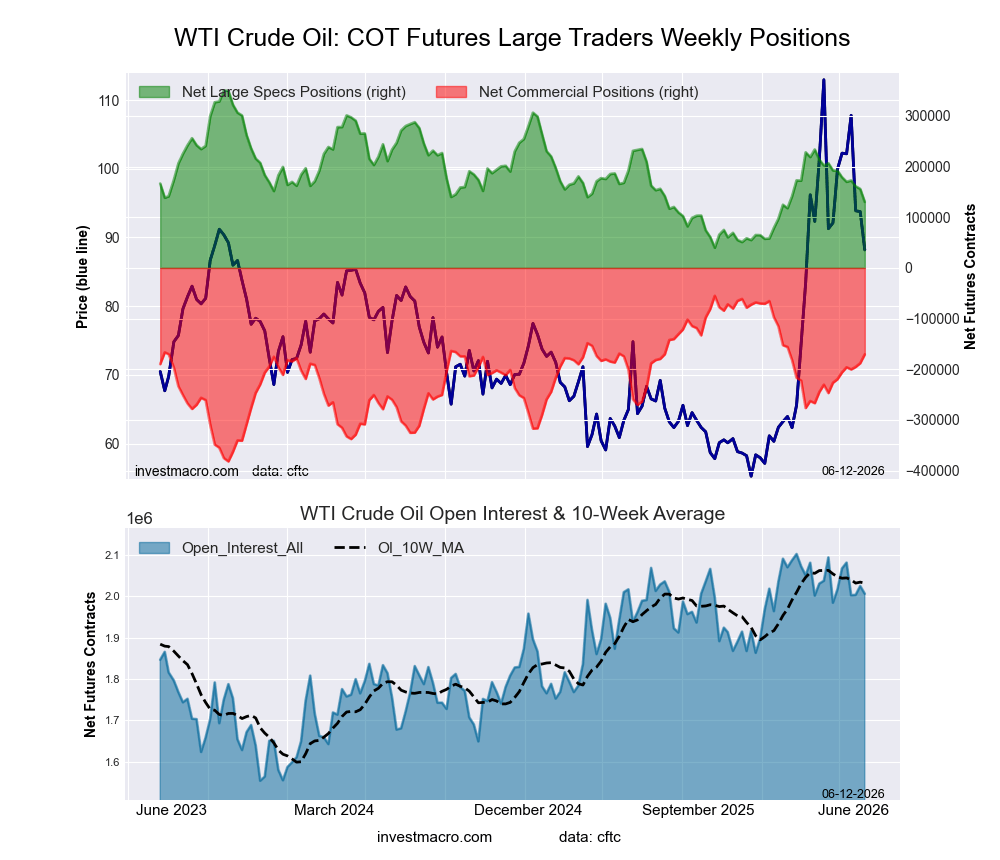
WTI Crude Oil Futures Futures:
 Positioning Notes:
- WTI Crude Oil Futures large speculator standing this week resulted in a net position of 130,301 contracts in the data reported through Tuesday.
- Weekly Speculator position lowering of -25,573 contracts from the previous week which had a total of 155,874 net contracts.
- This week’s current strength score (range over the past 3 years, measured from 0 to 100) shows the speculators are currently Bearish with a score of 29.2 percent.
- The Commercials are Bullish with a score of 64.6 percent.
- The Small Traders (not shown in chart) are Bullish-Extreme with a score of 80.7 percent.
Price Trend-Following Model: Weak Uptrend
Our weekly trend-following model classifies the current market price position as: Weak Uptrend.
| WTI Crude Oil Futures Statistics | SPECULATORS | COMMERCIALS | SMALL TRADERS |
| – Percent of Open Interest Longs: | 18.0 | 45.8 | 4.5 |
| – Percent of Open Interest Shorts: | 11.5 | 54.3 | 2.4 |
| – Net Position: | 130,301 | -170,726 | 40,425 |
| – Gross Longs: | 360,524 | 919,786 | 89,544 |
| – Gross Shorts: | 230,223 | 1,090,512 | 49,119 |
| – Long to Short Ratio: | 1.6 to 1 | 0.8 to 1 | 1.8 to 1 |
| NET POSITION TREND: | |||
| – Strength Index Score (3 Year Range Pct): | 29.2 | 64.6 | 80.7 |
| – Strength Index Reading (3 Year Range): | Bearish | Bullish | Bullish-Extreme |
| NET POSITION MOVEMENT INDEX: | |||
| – 6-Week Change in Strength Index: | -19.9 | 15.0 | 25.0 |
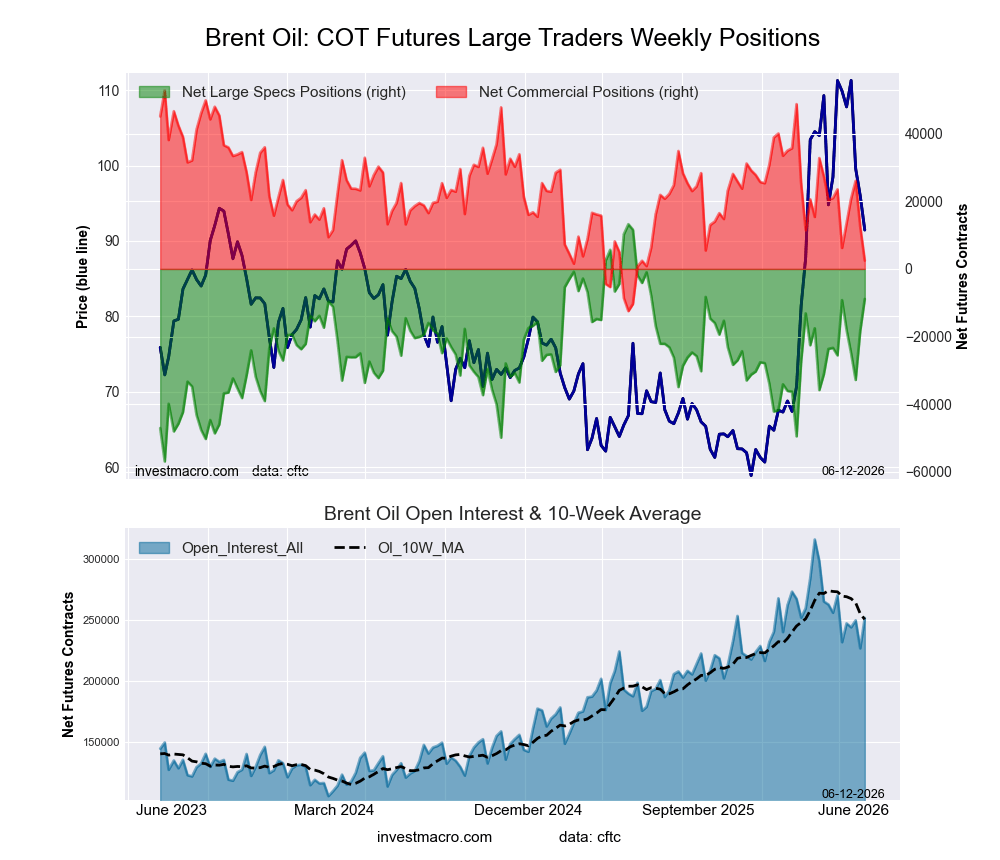
Brent Crude Oil Futures Futures:
 Positioning Notes:
- Brent Crude Oil Futures large speculator standing this week resulted in a net position of -8,883 contracts in the data reported through Tuesday.
- Weekly Speculator position gain of 9,488 contracts from the previous week which had a total of -18,371 net contracts.
- This week’s current strength score (range over the past 3 years, measured from 0 to 100) shows the speculators are currently Bullish with a score of 68.5 percent.
- The Commercials are Bearish with a score of 22.9 percent.
- The Small Traders (not shown in chart) are Bullish-Extreme with a score of 96.5 percent.
Price Trend-Following Model: Weak Uptrend
Our weekly trend-following model classifies the current market price position as: Weak Uptrend.
| Brent Crude Oil Futures Statistics | SPECULATORS | COMMERCIALS | SMALL TRADERS |
| – Percent of Open Interest Longs: | 22.3 | 31.9 | 5.3 |
| – Percent of Open Interest Shorts: | 25.9 | 30.9 | 2.7 |
| – Net Position: | -8,883 | 2,462 | 6,421 |
| – Gross Longs: | 56,151 | 80,160 | 13,212 |
| – Gross Shorts: | 65,034 | 77,698 | 6,791 |
| – Long to Short Ratio: | 0.9 to 1 | 1.0 to 1 | 1.9 to 1 |
| NET POSITION TREND: | |||
| – Strength Index Score (3 Year Range Pct): | 68.5 | 22.9 | 96.5 |
| – Strength Index Reading (3 Year Range): | Bullish | Bearish | Bullish-Extreme |
| NET POSITION MOVEMENT INDEX: | |||
| – 6-Week Change in Strength Index: | 23.8 | -32.3 | 44.8 |
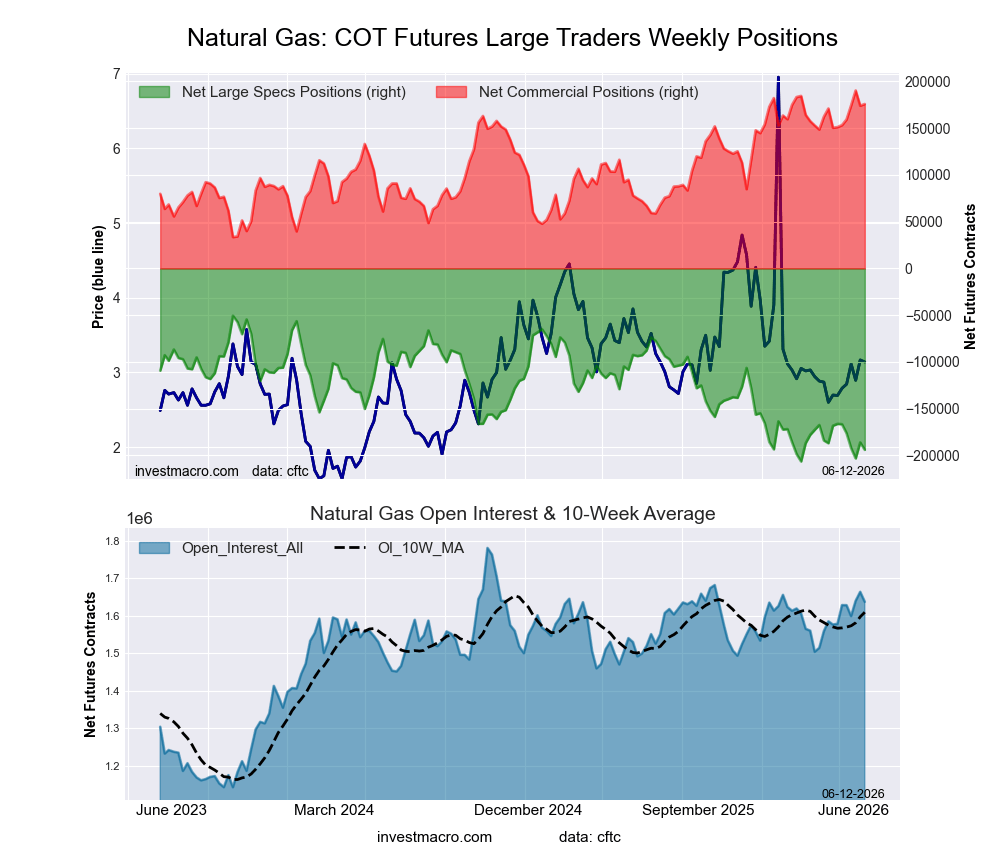
Natural Gas Futures Futures:
 Positioning Notes:
- Natural Gas Futures large speculator standing this week resulted in a net position of -193,957 contracts in the data reported through Tuesday.
- Weekly Speculator position reduction of -7,842 contracts from the previous week which had a total of -186,115 net contracts.
- This week’s current strength score (range over the past 3 years, measured from 0 to 100) shows the speculators are currently Bearish-Extreme with a score of 8.0 percent.
- The Commercials are Bullish-Extreme with a score of 90.8 percent.
- The Small Traders (not shown in chart) are Bearish with a score of 49.2 percent.
Price Trend-Following Model: Weak Downtrend
Our weekly trend-following model classifies the current market price position as: Weak Downtrend.
| Natural Gas Futures Statistics | SPECULATORS | COMMERCIALS | SMALL TRADERS |
| – Percent of Open Interest Longs: | 14.7 | 35.8 | 3.4 |
| – Percent of Open Interest Shorts: | 26.6 | 25.1 | 2.3 |
| – Net Position: | -193,957 | 175,738 | 18,219 |
| – Gross Longs: | 240,948 | 586,195 | 56,264 |
| – Gross Shorts: | 434,905 | 410,457 | 38,045 |
| – Long to Short Ratio: | 0.6 to 1 | 1.4 to 1 | 1.5 to 1 |
| NET POSITION TREND: | |||
| – Strength Index Score (3 Year Range Pct): | 8.0 | 90.8 | 49.2 |
| – Strength Index Reading (3 Year Range): | Bearish-Extreme | Bullish-Extreme | Bearish |
| NET POSITION MOVEMENT INDEX: | |||
| – 6-Week Change in Strength Index: | -17.8 | 15.8 | 7.5 |
Gasoline Blendstock Futures Futures:
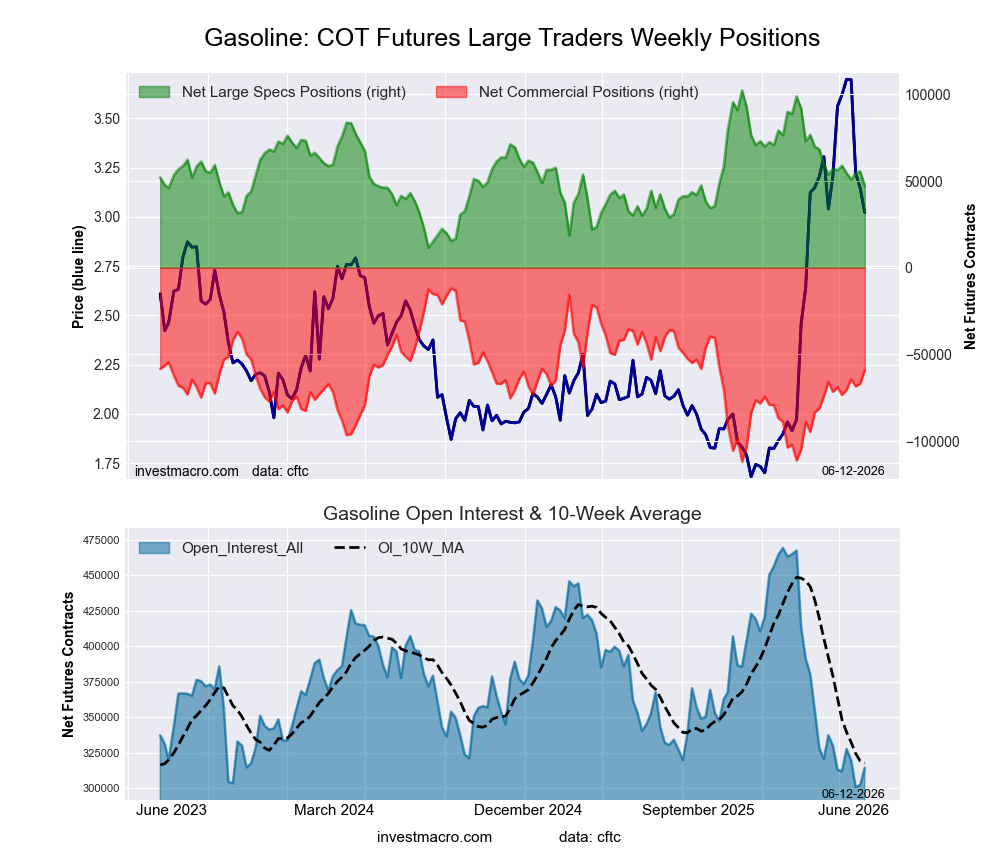 Positioning Notes:
- Gasoline Blendstock Futures large speculator standing this week resulted in a net position of 47,043 contracts in the data reported through Tuesday.
- Weekly Speculator position fall of -8,579 contracts from the previous week which had a total of 55,622 net contracts.
- This week’s current strength score (range over the past 3 years, measured from 0 to 100) shows the speculators are currently Bearish with a score of 39.1 percent.
- The Commercials are Bullish with a score of 52.9 percent.
- The Small Traders (not shown in chart) are Bullish with a score of 71.9 percent.
Price Trend-Following Model: Weak Uptrend
Our weekly trend-following model classifies the current market price position as: Weak Uptrend.
| Nasdaq Mini Futures Statistics | SPECULATORS | COMMERCIALS | SMALL TRADERS |
| – Percent of Open Interest Longs: | 25.5 | 47.5 | 8.4 |
| – Percent of Open Interest Shorts: | 10.5 | 66.2 | 4.6 |
| – Net Position: | 47,043 | -58,973 | 11,930 |
| – Gross Longs: | 80,104 | 149,266 | 26,345 |
| – Gross Shorts: | 33,061 | 208,239 | 14,415 |
| – Long to Short Ratio: | 2.4 to 1 | 0.7 to 1 | 1.8 to 1 |
| NET POSITION TREND: | |||
| – Strength Index Score (3 Year Range Pct): | 39.1 | 52.9 | 71.9 |
| – Strength Index Reading (3 Year Range): | Bearish | Bullish | Bullish |
| NET POSITION MOVEMENT INDEX: | |||
| – 6-Week Change in Strength Index: | -10.1 | 9.9 | -3.4 |
#2 Heating Oil NY-Harbor Futures Futures:
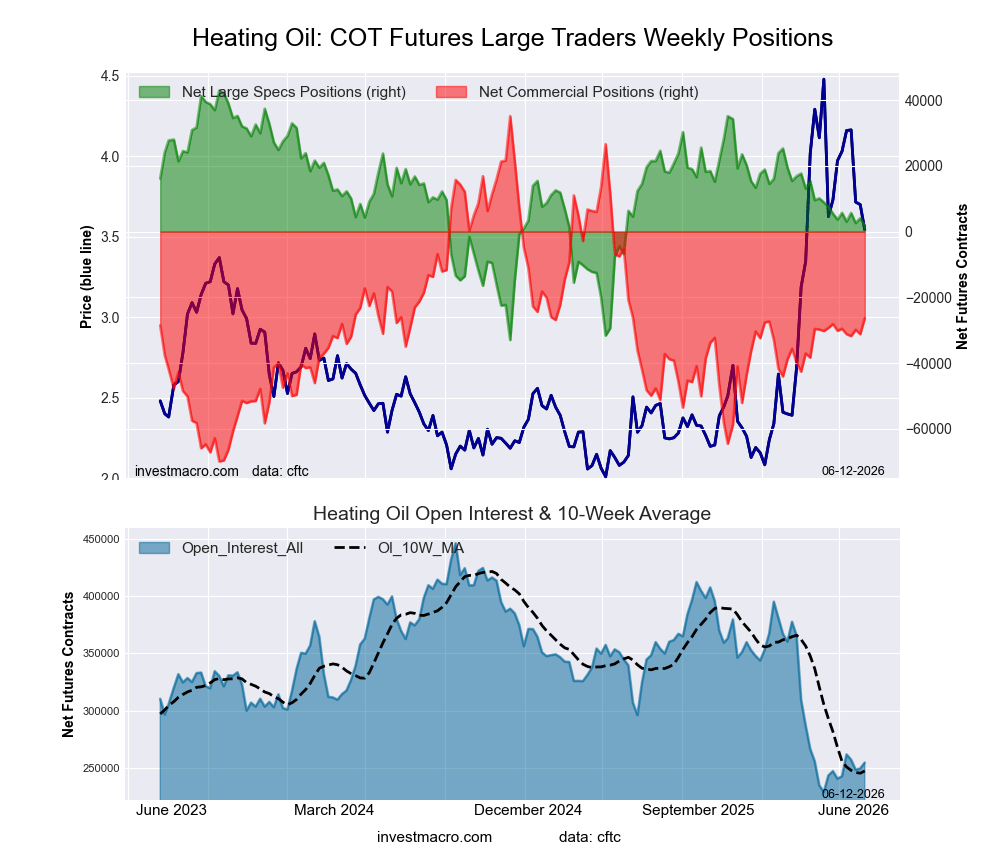 Positioning Notes:
- #2 Heating Oil NY-Harbor Futures large speculator standing this week resulted in a net position of 1,824 contracts in the data reported through Tuesday.
- Weekly Speculator position lowering of -2,267 contracts from the previous week which had a total of 4,091 net contracts.
- This week’s current strength score (range over the past 3 years, measured from 0 to 100) shows the speculators are currently Bearish with a score of 45.8 percent.
- The Commercials are Bearish with a score of 41.5 percent.
- The Small Traders (not shown in chart) are Bullish-Extreme with a score of 85.1 percent.
Price Trend-Following Model: Weak Uptrend
Our weekly trend-following model classifies the current market price position as: Weak Uptrend.
| Heating Oil Futures Statistics | SPECULATORS | COMMERCIALS | SMALL TRADERS |
| – Percent of Open Interest Longs: | 15.7 | 44.1 | 19.5 |
| – Percent of Open Interest Shorts: | 15.0 | 54.4 | 9.9 |
| – Net Position: | 1,824 | -26,341 | 24,517 |
| – Gross Longs: | 40,044 | 112,298 | 49,677 |
| – Gross Shorts: | 38,220 | 138,639 | 25,160 |
| – Long to Short Ratio: | 1.0 to 1 | 0.8 to 1 | 2.0 to 1 |
| NET POSITION TREND: | |||
| – Strength Index Score (3 Year Range Pct): | 45.8 | 41.5 | 85.1 |
| – Strength Index Reading (3 Year Range): | Bearish | Bearish | Bullish-Extreme |
| NET POSITION MOVEMENT INDEX: | |||
| – 6-Week Change in Strength Index: | -2.4 | 3.6 | -5.4 |
Bloomberg Commodity Index Futures Futures:
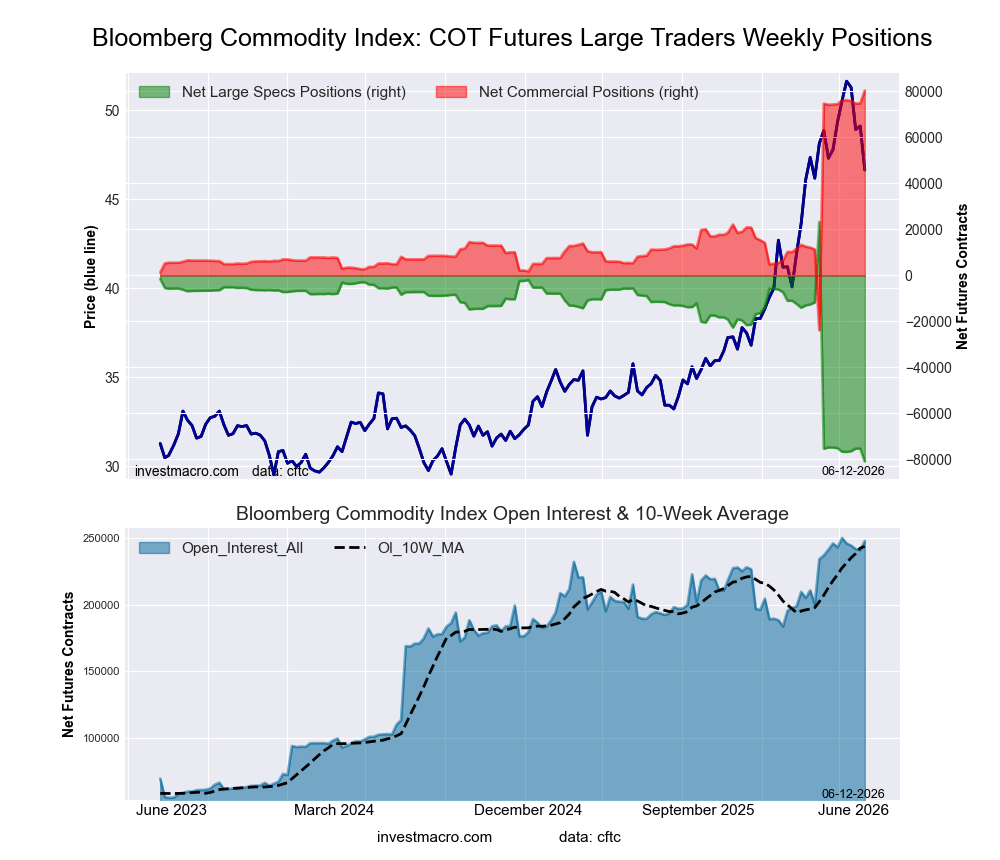 Positioning Notes:
- Bloomberg Commodity Index Futures large speculator standing this week resulted in a net position of -80,890 contracts in the data reported through Tuesday.
- Weekly Speculator position decline of -5,608 contracts from the previous week which had a total of -75,282 net contracts.
- This week’s current strength score (range over the past 3 years, measured from 0 to 100) shows the speculators are currently Bearish-Extreme with a score of 0.0 percent.
- The Commercials are Bullish-Extreme with a score of 100.0 percent.
- The Small Traders (not shown in chart) are Bullish with a score of 63.4 percent.
Price Trend-Following Model: Weak Uptrend
Our weekly trend-following model classifies the current market price position as: Weak Uptrend.
| Bloomberg Index Futures Statistics | SPECULATORS | COMMERCIALS | SMALL TRADERS |
| – Percent of Open Interest Longs: | 41.6 | 56.7 | 0.2 |
| – Percent of Open Interest Shorts: | 74.2 | 24.2 | 0.0 |
| – Net Position: | -80,890 | 80,412 | 478 |
| – Gross Longs: | 102,893 | 140,412 | 536 |
| – Gross Shorts: | 183,783 | 60,000 | 58 |
| – Long to Short Ratio: | 0.6 to 1 | 2.3 to 1 | 9.2 to 1 |
| NET POSITION TREND: | |||
| – Strength Index Score (3 Year Range Pct): | 0.0 | 100.0 | 63.4 |
| – Strength Index Reading (3 Year Range): | Bearish-Extreme | Bullish-Extreme | Bullish |
| NET POSITION MOVEMENT INDEX: | |||
| – 6-Week Change in Strength Index: | -5.6 | 5.6 | -5.0 |
Article By InvestMacro – Receive our weekly COT Reports by Email
*COT Report: The COT data, released weekly to the public each Friday, is updated through the most recent Tuesday (data is 3 days old) and shows a quick view of how large speculators or non-commercials (for-profit traders) were positioned in the futures markets.
The CFTC categorizes trader positions according to commercial hedgers (traders who use futures contracts for hedging as part of the business), non-commercials (large traders who speculate to realize trading profits) and nonreportable traders (usually small traders/speculators) as well as their open interest (contracts open in the market at time of reporting).See CFTC criteria here.
All information and opinions on this website and contained in this article are for general informational purposes only and do not constitute investment advice.

- The US introduces new import tariffs for 60 countries. Brent crude surpasses $100 per barrel Jul 24, 2026
- USD/JPY Breaks Records: Nothing Slows the Yen’s Decline Jul 24, 2026
- Oil prices reached a 6‑week high. The AUD strengthened on the back of a strong labor‑market report Jul 23, 2026
- EUR/USD Recovers as Dollar Weakens Jul 23, 2026
- Bitcoin rose to $66,000. The New Zealand dollar continues to strengthen Jul 22, 2026
- Inflationary pressure is easing in Canada. In New Zealand, on the contrary, inflation is rising Jul 21, 2026
- GBP/USD Falls After Cabinet Changes Jul 21, 2026
- Geopolitical and macroeconomic conditions continue to pressure market sentiment Jul 20, 2026
- USD/JPY Poised to Continue Gains as Expensive Oil and Lack of Support Weigh on Yen Jul 20, 2026
- COT Metals Charts: Weekly Speculator Bets led by Copper & Steel Jul 18, 2026