USDCAD Intermediate Correction To End Near 1.341

By Orbex

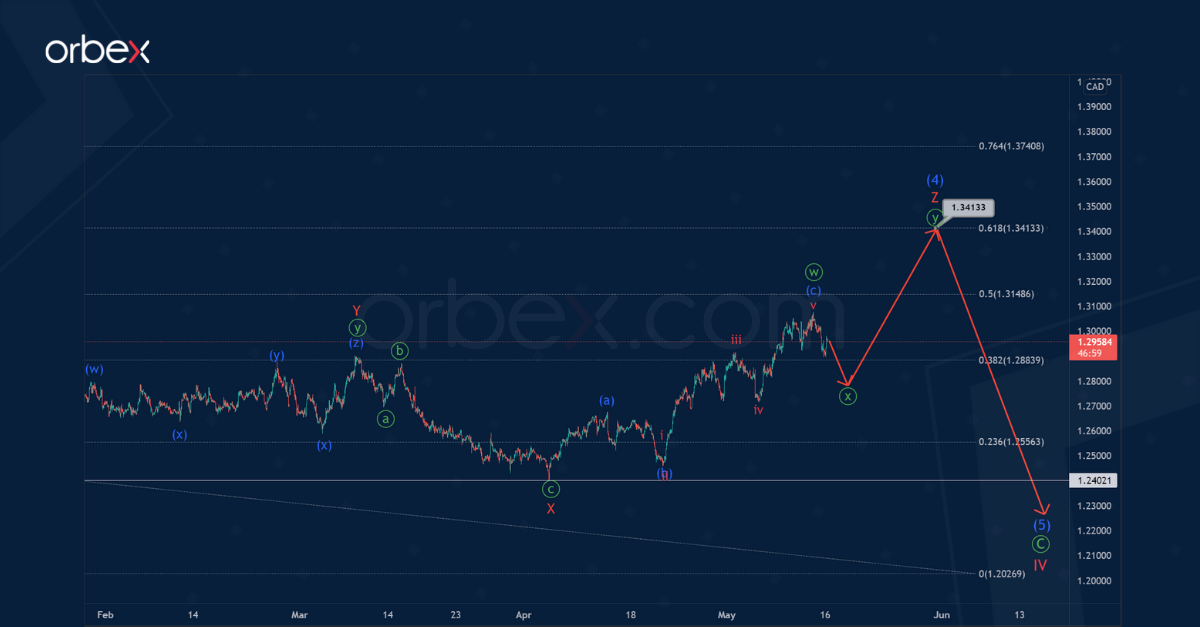
The USDCAD structure indicates the construction of a large correction wave IV. This is part of a global cycle impulse and consists of sub-waves Ⓐ-Ⓑ-Ⓒ.

On the current chart, we see the final part of the primary impulse wave Ⓒ. Wave Ⓒ consists of intermediate sub-waves (1)-(2)-(3)-(4)-(5). A deep intermediate correction (4) is currently under development. This could take the form of a minor triple zigzag W-X-Y-X-Z.

In the near future, prices should rise in the last minor sub-wave Z. It is most likely to be a minute double zigzag, and will end its pattern near 1.341.

At that price level, correction (4) will be at 61.8% of previous impulse wave (3).

According to the second option, the formation of the intermediate correction (4) has already been fully completed. In this scenario, it has the form not of a triple, but of a double zigzag W-X-Y.

Thus, in the last section of the chart, we see the development of the initial part of the intermediate wave (5). This can take the form of a minor impulse 1-2-3-4-5.

A price decline in the sub-waves 1-2-3-4-5 is then likely, and the entire intermediate wave (5) is likely to end near 1.195.

At the level of 1.195, impulse (5) will be at the 50% Fibonacci extension of intermediate impulse (3).


Orbex-LogoArticle by Orbex

Orbex is a fully licensed broker that was established in 2011. Founded with a mission to serve its traders responsibly and provides traders with access to the world’s largest and most liquid financial markets. www.orbex.com

Intraday Market Analysis – USD Holds Onto Recent Gains

By Orbex

USDCHF grinds higher

The US dollar consolidates its gains as traders ponder whether inflation has peaked. A close above the parity, last seen in November 2019 indicates strong bullish sentiment. Trend followers have been eager to buy at pullbacks and may continue to do so in this directional market. The RSI’s overbought condition has prompted intraday buyers to take profit. 0.9960 is the closest support and 0.9870 a second line of defence for the bulls. A rebound would bring the greenback back to a three-year high at 1.0120.

USDNOK rides trendline

The Norwegian krone recoups losses as oil prices bounce back. The US dollar has been grinding up a rising trend line after a bullish breakout in early May. Sentiment remains extremely bullish and the pair is on its way to the psychological level of 10.0000. The RSI’s repeatedly overbought situation and a break below the trend line may cause a retracement as buyers would be unwilling to chase after higher bids. The demand zone around 9.6300 is a key level to keep short-term sentiment upbeat.

GER 40 tests daily resistance

The Dax 40 bounces higher amid bargain hunting after earlier sell-off. The index found support at the base of the mid-March rally at 13300. A bullish RSI divergence revealed a deceleration in the latest sell-off and a close above 13850 prompted sellers to cover their bets. The daily resistance at 14300 is a major hurdle and its breach could turn sentiment around. An overbought RSI may cause a pullback to test buyers’ commitment. 13750 is a fresh support and 13300 a floor to keep the current rebound relevant.

Test your strategy on how the CHF will fare with Orbex – Open Your Account Now. 


Orbex-LogoArticle by Orbex

Orbex is a fully licensed broker that was established in 2011. Founded with a mission to serve its traders responsibly and provides traders with access to the world’s largest and most liquid financial markets. www.orbex.com

COT Currency Speculators raised British Pound Sterling bearish bets for 10th week

By InvestMacro | COT | Data Tables | COT Leaders | Downloads | COT Newsletter

Here are the latest charts and statistics for this week’s Commitment of Traders (COT) data published by the Commodities Futures Trading Commission (CFTC).

The latest COT data is updated through Tuesday May 10th and shows a quick view of how large traders (for-profit speculators and commercial entities) were positioned in the futures markets. All currency positions are in direct relation to the US dollar where, for example, a bet for the euro is a bet that the euro will rise versus the dollar while a bet against the euro will be a bet that the euro will decline versus the dollar.

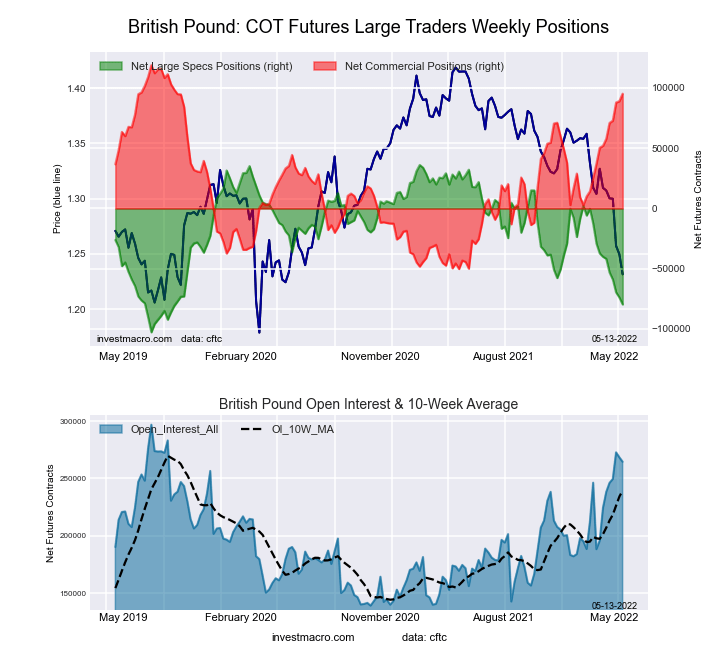
Highlighting the COT currency data this week was the rise in bearish bets for the British pound sterling currency futures contracts. Pound speculators have raised their bearish bets for a tenth consecutive week this week and for the eleventh time out of the past twelve weeks. Over the past ten-week time-frame, pound bets have dropped by a total of -79,261 contracts, going from -337 net positions on March 1st to a total of -79,598 net positions this week. The deterioration in speculator sentiment has now pushed the pound net position to the most bearish standing of the past one hundred and thirty-seven weeks, dating back to September 24th of 2019.

Pound sterling sentiment has been hit by a recent slowing economy as the UK GDP declined by 0.1 percent in March after flat growth in February. Also, weighing on the UK economy is the war in Ukraine that has sharply raised inflation in the country (and elsewhere) and which could see the UK economy with the lowest growth rate among G7 countries in 2023, according to the IMF.

Overall, the currencies with higher speculator bets this week were the Euro (22,907 contracts), US Dollar Index (1,705 contracts), Bitcoin (315 contracts) and the Mexican peso (2,102 contracts).

The currencies with declining bets were the Japanese yen (-9,660 contracts), Australian dollar (-13,198 contracts), Brazil real (-1,010 contracts), Swiss franc (-1,856 contracts), British pound sterling (-5,785 contracts), New Zealand dollar (-6,386 contracts), Canadian dollar (-14,436 contracts), Russian ruble (-263 contracts) and the Mexican peso (2,102 contracts).


Speculator strength standings for each Commodity where strength index is current net position compared to past three years, above 80 is bullish extreme, below 20 is bearish extreme OI Strength = Current Open Interest level compared to last 3 years range Spec Strength = Current Net Speculator level compared to last 3 years range Strength Move = Six week change of Spec Strength


Data Snapshot of Forex Market Traders | Columns Legend
May-10-2022OIOI-IndexSpec-NetSpec-IndexCom-NetCOM-IndexSmalls-NetSmalls-Index
USD Index57,5568434,77686-37,174132,39843
EUR705,0468416,52940-43,0266426,49718
GBP264,59480-79,5981795,24586-15,64723
JPY247,27887-110,4541124,92797-14,47324
CHF51,28237-15,7634029,81969-14,05616
CAD151,00931-5,407382,939672,46835
AUD153,20947-41,7144647,12654-5,41239
NZD56,23556-12,9964916,87456-3,8787
MXN153,8582816,72534-20,866644,14161
RUB20,93047,54331-7,15069-39324
BRL61,4505540,77890-42,031101,25379
Bitcoin10,84157703100-78908615

Open Interest is the amount of contracts that were live in the marketplace at time of data.


US Dollar Index Futures:
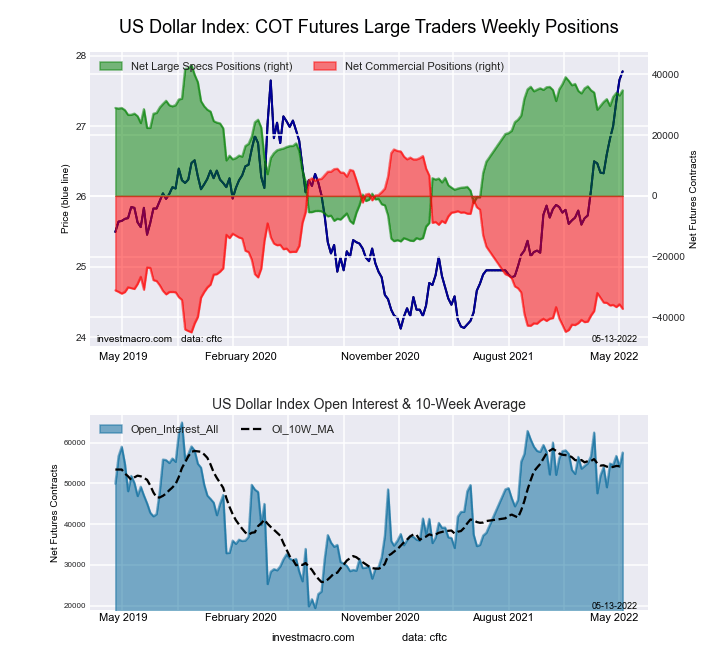
US Dollar Index Forex Futures COT ChartThe US Dollar Index large speculator standing this week came in at a net position of 34,776 contracts in the data reported through Tuesday. This was a weekly lift of 1,705 contracts from the previous week which had a total of 33,071 net contracts.

This week’s current strength score (the trader positioning range over the past three years, measured from 0 to 100) shows the speculators are currently Bullish-Extreme with a score of 85.8 percent. The commercials are Bearish-Extreme with a score of 12.8 percent and the small traders (not shown in chart) are Bearish with a score of 42.8 percent.

US DOLLAR INDEX StatisticsSPECULATORSCOMMERCIALSSMALL TRADERS
– Percent of Open Interest Longs:86.63.28.6
– Percent of Open Interest Shorts:26.267.84.5
– Net Position:34,776-37,1742,398
– Gross Longs:49,8641,8374,970
– Gross Shorts:15,08839,0112,572
– Long to Short Ratio:3.3 to 10.0 to 11.9 to 1
NET POSITION TREND:
– Strength Index Score (3 Year Range Pct):85.812.842.8
– Strength Index Reading (3 Year Range):Bullish-ExtremeBearish-ExtremeBearish
NET POSITION MOVEMENT INDEX:
– 6-Week Change in Strength Index:6.6-3.4-19.3


Euro Currency Futures:

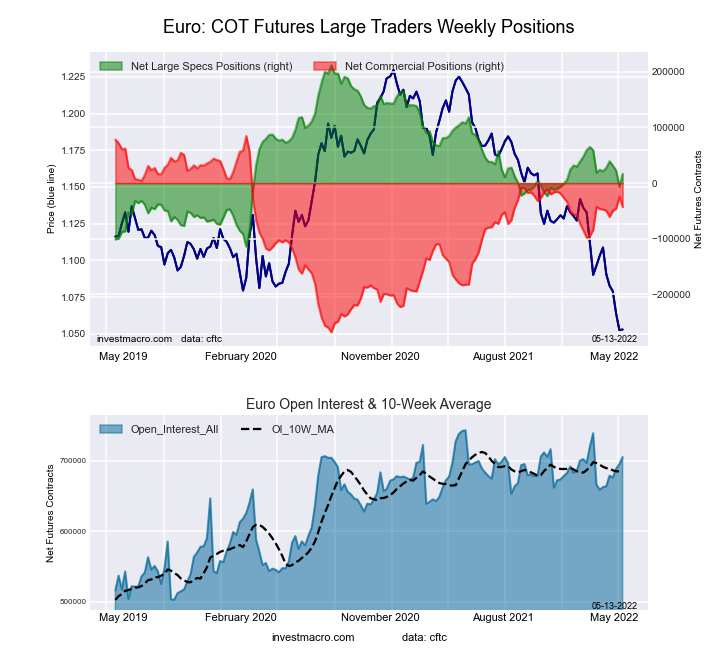
Euro Currency Futures COT ChartThe Euro Currency large speculator standing this week came in at a net position of 16,529 contracts in the data reported through Tuesday. This was a weekly increase of 22,907 contracts from the previous week which had a total of -6,378 net contracts.

This week’s current strength score (the trader positioning range over the past three years, measured from 0 to 100) shows the speculators are currently Bearish with a score of 40.1 percent. The commercials are Bullish with a score of 63.8 percent and the small traders (not shown in chart) are Bearish-Extreme with a score of 18.3 percent.

EURO Currency StatisticsSPECULATORSCOMMERCIALSSMALL TRADERS
– Percent of Open Interest Longs:32.453.312.0
– Percent of Open Interest Shorts:30.059.48.3
– Net Position:16,529-43,02626,497
– Gross Longs:228,230376,04384,921
– Gross Shorts:211,701419,06958,424
– Long to Short Ratio:1.1 to 10.9 to 11.5 to 1
NET POSITION TREND:
– Strength Index Score (3 Year Range Pct):40.163.818.3
– Strength Index Reading (3 Year Range):BearishBullishBearish-Extreme
NET POSITION MOVEMENT INDEX:
– 6-Week Change in Strength Index:-1.51.20.9


British Pound Sterling Futures:

British Pound Sterling Futures COT ChartThe British Pound Sterling large speculator standing this week came in at a net position of -79,598 contracts in the data reported through Tuesday. This was a weekly fall of -5,785 contracts from the previous week which had a total of -73,813 net contracts.

This week’s current strength score (the trader positioning range over the past three years, measured from 0 to 100) shows the speculators are currently Bearish-Extreme with a score of 16.6 percent. The commercials are Bullish-Extreme with a score of 86.0 percent and the small traders (not shown in chart) are Bearish with a score of 23.2 percent.

BRITISH POUND StatisticsSPECULATORSCOMMERCIALSSMALL TRADERS
– Percent of Open Interest Longs:11.179.67.6
– Percent of Open Interest Shorts:41.243.613.5
– Net Position:-79,59895,245-15,647
– Gross Longs:29,469210,62720,157
– Gross Shorts:109,067115,38235,804
– Long to Short Ratio:0.3 to 11.8 to 10.6 to 1
NET POSITION TREND:
– Strength Index Score (3 Year Range Pct):16.686.023.2
– Strength Index Reading (3 Year Range):Bearish-ExtremeBullish-ExtremeBearish
NET POSITION MOVEMENT INDEX:
– 6-Week Change in Strength Index:-28.525.6-7.7


Japanese Yen Futures:

The Japanese Yen large speculator standing this week came in at a net position of -110,454 contracts in the data reported through Tuesday. This was a weekly decline of -9,660 contracts from the previous week which had a total of -100,794 net contracts.

This week’s current strength score (the trader positioning range over the past three years, measured from 0 to 100) shows the speculators are currently Bearish-Extreme with a score of 0.8 percent. The commercials are Bullish-Extreme with a score of 96.6 percent and the small traders (not shown in chart) are Bearish with a score of 24.0 percent.

JAPANESE YEN StatisticsSPECULATORSCOMMERCIALSSMALL TRADERS
– Percent of Open Interest Longs:4.586.28.0
– Percent of Open Interest Shorts:49.235.713.9
– Net Position:-110,454124,927-14,473
– Gross Longs:11,196213,08419,811
– Gross Shorts:121,65088,15734,284
– Long to Short Ratio:0.1 to 12.4 to 10.6 to 1
NET POSITION TREND:
– Strength Index Score (3 Year Range Pct):0.896.624.0
– Strength Index Reading (3 Year Range):Bearish-ExtremeBullish-ExtremeBearish
NET POSITION MOVEMENT INDEX:
– 6-Week Change in Strength Index:-5.10.016.7


Swiss Franc Futures:

The Swiss Franc large speculator standing this week came in at a net position of -15,763 contracts in the data reported through Tuesday. This was a weekly fall of -1,856 contracts from the previous week which had a total of -13,907 net contracts.

This week’s current strength score (the trader positioning range over the past three years, measured from 0 to 100) shows the speculators are currently Bearish with a score of 39.8 percent. The commercials are Bullish with a score of 69.2 percent and the small traders (not shown in chart) are Bearish-Extreme with a score of 15.5 percent.

SWISS FRANC StatisticsSPECULATORSCOMMERCIALSSMALL TRADERS
– Percent of Open Interest Longs:9.274.616.1
– Percent of Open Interest Shorts:40.016.543.5
– Net Position:-15,76329,819-14,056
– Gross Longs:4,72738,2588,271
– Gross Shorts:20,4908,43922,327
– Long to Short Ratio:0.2 to 14.5 to 10.4 to 1
NET POSITION TREND:
– Strength Index Score (3 Year Range Pct):39.869.215.5
– Strength Index Reading (3 Year Range):BearishBullishBearish-Extreme
NET POSITION MOVEMENT INDEX:
– 6-Week Change in Strength Index:-7.78.0-7.6


Canadian Dollar Futures:

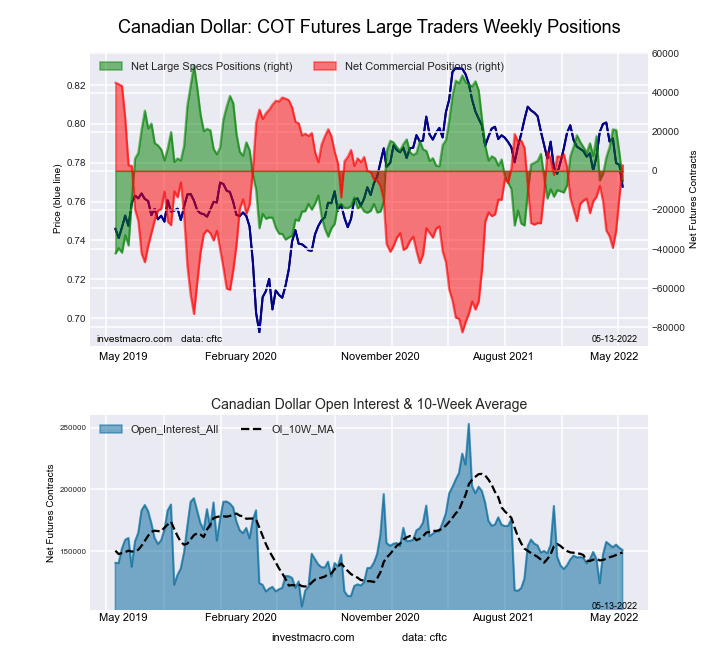
Canadian Dollar Forex Futures COT ChartThe Canadian Dollar large speculator standing this week came in at a net position of -5,407 contracts in the data reported through Tuesday. This was a weekly fall of -14,436 contracts from the previous week which had a total of 9,029 net contracts.

This week’s current strength score (the trader positioning range over the past three years, measured from 0 to 100) shows the speculators are currently Bearish with a score of 38.3 percent. The commercials are Bullish with a score of 66.9 percent and the small traders (not shown in chart) are Bearish with a score of 34.7 percent.

CANADIAN DOLLAR StatisticsSPECULATORSCOMMERCIALSSMALL TRADERS
– Percent of Open Interest Longs:25.649.821.8
– Percent of Open Interest Shorts:29.247.920.1
– Net Position:-5,4072,9392,468
– Gross Longs:38,67975,21532,880
– Gross Shorts:44,08672,27630,412
– Long to Short Ratio:0.9 to 11.0 to 11.1 to 1
NET POSITION TREND:
– Strength Index Score (3 Year Range Pct):38.366.934.7
– Strength Index Reading (3 Year Range):BearishBullishBearish
NET POSITION MOVEMENT INDEX:
– 6-Week Change in Strength Index:-4.014.5-29.0


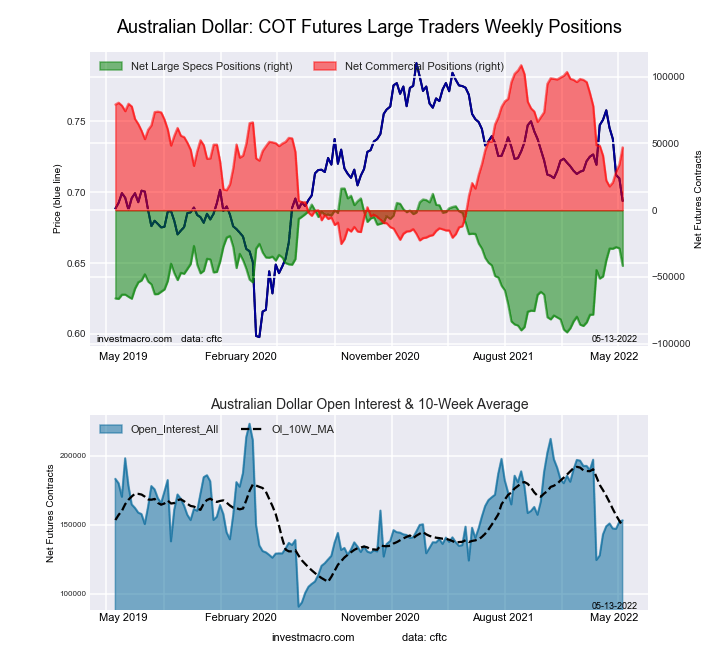
Australian Dollar Futures:

Australian Dollar Forex Futures COT ChartThe Australian Dollar large speculator standing this week came in at a net position of -41,714 contracts in the data reported through Tuesday. This was a weekly decrease of -13,198 contracts from the previous week which had a total of -28,516 net contracts.

This week’s current strength score (the trader positioning range over the past three years, measured from 0 to 100) shows the speculators are currently Bearish with a score of 46.2 percent. The commercials are Bullish with a score of 54.0 percent and the small traders (not shown in chart) are Bearish with a score of 39.2 percent.

AUSTRALIAN DOLLAR StatisticsSPECULATORSCOMMERCIALSSMALL TRADERS
– Percent of Open Interest Longs:24.159.913.1
– Percent of Open Interest Shorts:51.329.116.7
– Net Position:-41,71447,126-5,412
– Gross Longs:36,86991,73120,131
– Gross Shorts:78,58344,60525,543
– Long to Short Ratio:0.5 to 12.1 to 10.8 to 1
NET POSITION TREND:
– Strength Index Score (3 Year Range Pct):46.254.039.2
– Strength Index Reading (3 Year Range):BearishBullishBearish
NET POSITION MOVEMENT INDEX:
– 6-Week Change in Strength Index:7.34.7-34.4


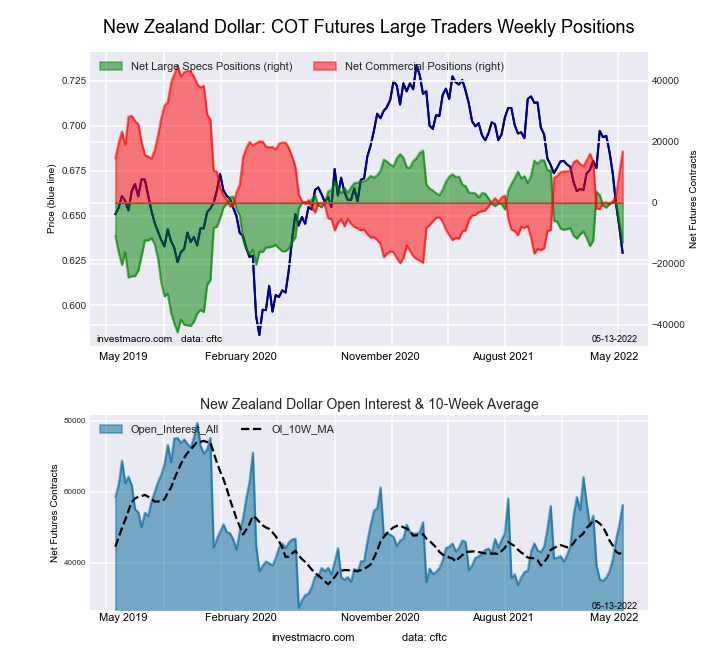
New Zealand Dollar Futures:

New Zealand Dollar Forex Futures COT ChartThe New Zealand Dollar large speculator standing this week came in at a net position of -12,996 contracts in the data reported through Tuesday. This was a weekly fall of -6,386 contracts from the previous week which had a total of -6,610 net contracts.

This week’s current strength score (the trader positioning range over the past three years, measured from 0 to 100) shows the speculators are currently Bearish with a score of 49.5 percent. The commercials are Bullish with a score of 56.4 percent and the small traders (not shown in chart) are Bearish-Extreme with a score of 7.4 percent.

NEW ZEALAND DOLLAR StatisticsSPECULATORSCOMMERCIALSSMALL TRADERS
– Percent of Open Interest Longs:27.068.53.9
– Percent of Open Interest Shorts:50.138.510.8
– Net Position:-12,99616,874-3,878
– Gross Longs:15,20338,5412,216
– Gross Shorts:28,19921,6676,094
– Long to Short Ratio:0.5 to 11.8 to 10.4 to 1
NET POSITION TREND:
– Strength Index Score (3 Year Range Pct):49.556.47.4
– Strength Index Reading (3 Year Range):BearishBullishBearish-Extreme
NET POSITION MOVEMENT INDEX:
– 6-Week Change in Strength Index:-20.426.0-54.4


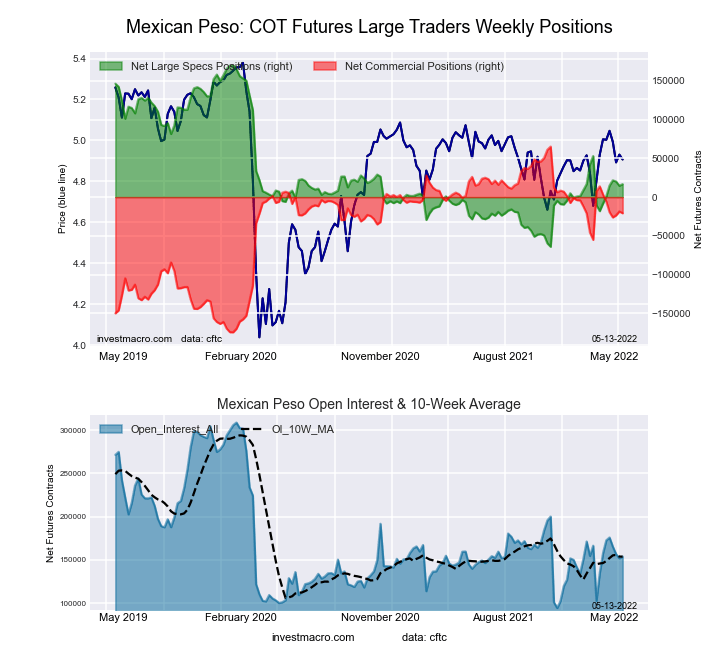
Mexican Peso Futures:

Mexican Peso Futures COT ChartThe Mexican Peso large speculator standing this week came in at a net position of 16,725 contracts in the data reported through Tuesday. This was a weekly advance of 2,102 contracts from the previous week which had a total of 14,623 net contracts.

This week’s current strength score (the trader positioning range over the past three years, measured from 0 to 100) shows the speculators are currently Bearish with a score of 34.5 percent. The commercials are Bullish with a score of 64.1 percent and the small traders (not shown in chart) are Bullish with a score of 60.6 percent.

MEXICAN PESO StatisticsSPECULATORSCOMMERCIALSSMALL TRADERS
– Percent of Open Interest Longs:41.553.14.2
– Percent of Open Interest Shorts:30.766.71.5
– Net Position:16,725-20,8664,141
– Gross Longs:63,92181,7356,467
– Gross Shorts:47,196102,6012,326
– Long to Short Ratio:1.4 to 10.8 to 12.8 to 1
NET POSITION TREND:
– Strength Index Score (3 Year Range Pct):34.564.160.6
– Strength Index Reading (3 Year Range):BearishBullishBullish
NET POSITION MOVEMENT INDEX:
– 6-Week Change in Strength Index:10.6-10.1-3.5


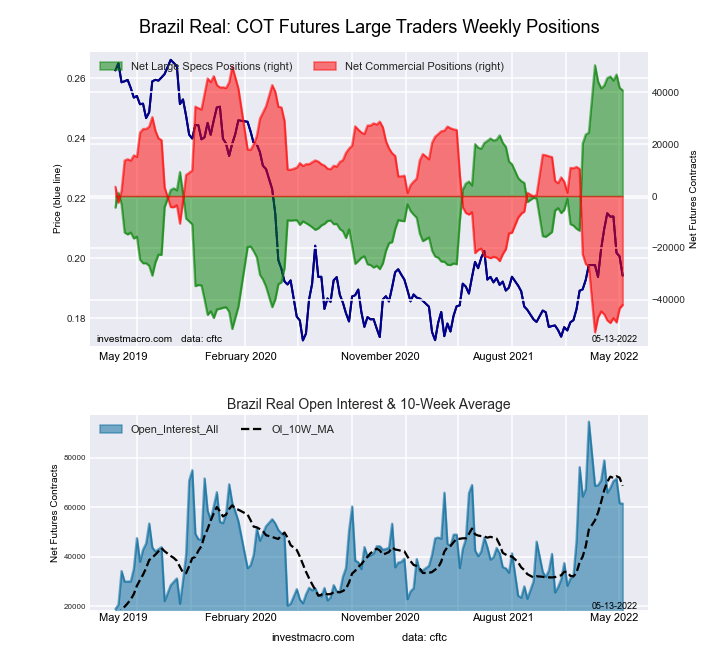
Brazilian Real Futures:

Brazil Real Futures COT ChartThe Brazilian Real large speculator standing this week came in at a net position of 40,778 contracts in the data reported through Tuesday. This was a weekly lowering of -1,010 contracts from the previous week which had a total of 41,788 net contracts.

This week’s current strength score (the trader positioning range over the past three years, measured from 0 to 100) shows the speculators are currently Bullish-Extreme with a score of 90.5 percent. The commercials are Bearish-Extreme with a score of 10.3 percent and the small traders (not shown in chart) are Bullish with a score of 79.4 percent.

BRAZIL REAL StatisticsSPECULATORSCOMMERCIALSSMALL TRADERS
– Percent of Open Interest Longs:79.515.45.0
– Percent of Open Interest Shorts:13.183.83.0
– Net Position:40,778-42,0311,253
– Gross Longs:48,8359,4543,070
– Gross Shorts:8,05751,4851,817
– Long to Short Ratio:6.1 to 10.2 to 11.7 to 1
NET POSITION TREND:
– Strength Index Score (3 Year Range Pct):90.510.379.4
– Strength Index Reading (3 Year Range):Bullish-ExtremeBearish-ExtremeBullish
NET POSITION MOVEMENT INDEX:
– 6-Week Change in Strength Index:-1.83.5-20.6


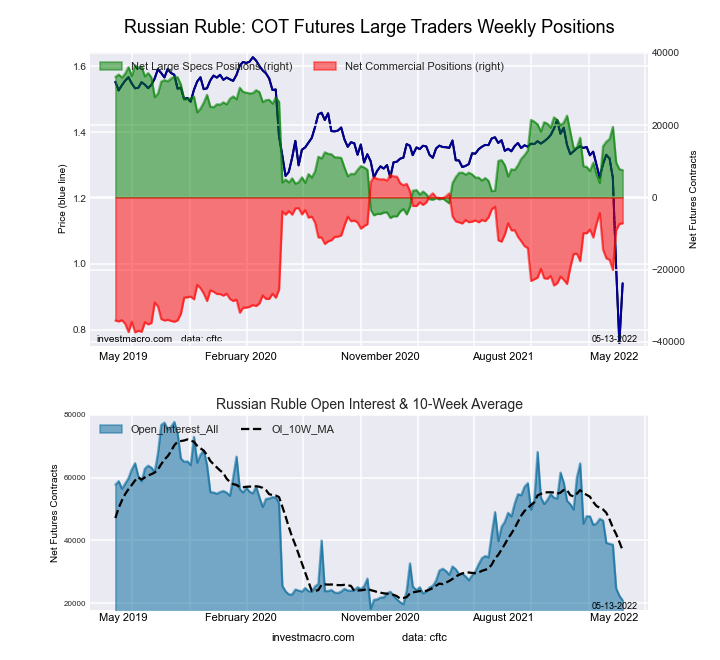
Russian Ruble Futures:

Russian Ruble Futures COT ChartThe Russian Ruble large speculator standing this week came in at a net position of 7,543 contracts in the data reported through Tuesday. This was a weekly fall of -263 contracts from the previous week which had a total of 7,806 net contracts.

This week’s current strength score (the trader positioning range over the past three years, measured from 0 to 100) shows the speculators are currently Bearish with a score of 31.2 percent. The commercials are Bullish with a score of 69.1 percent and the small traders (not shown in chart) are Bearish with a score of 23.9 percent.

RUSSIAN RUBLE StatisticsSPECULATORSCOMMERCIALSSMALL TRADERS
– Percent of Open Interest Longs:36.660.62.8
– Percent of Open Interest Shorts:0.594.74.7
– Net Position:7,543-7,150-393
– Gross Longs:7,65812,679593
– Gross Shorts:11519,829986
– Long to Short Ratio:66.6 to 10.6 to 10.6 to 1
NET POSITION TREND:
– Strength Index Score (3 Year Range Pct):31.269.123.9
– Strength Index Reading (3 Year Range):BearishBullishBearish
NET POSITION MOVEMENT INDEX:
– 6-Week Change in Strength Index:-15.616.7-18.8


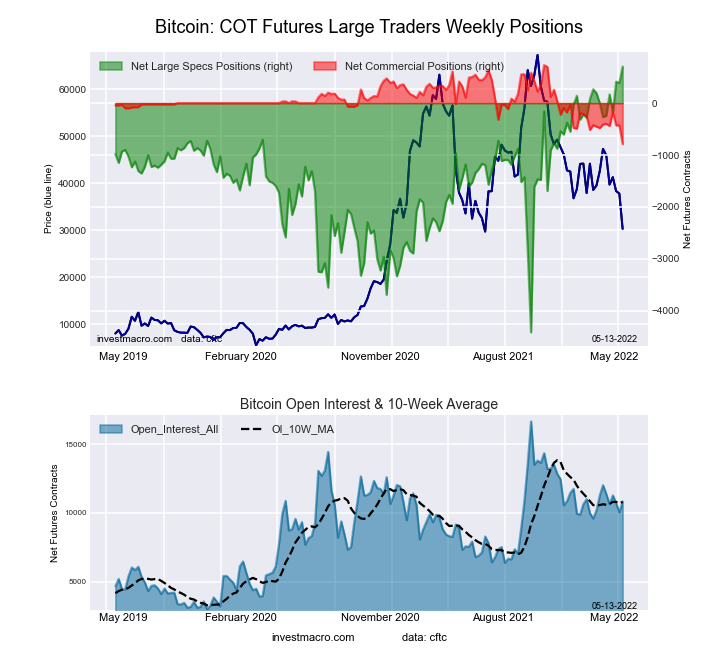
Bitcoin Futures:

Bitcoin Crypto Futures COT ChartThe Bitcoin large speculator standing this week came in at a net position of 703 contracts in the data reported through Tuesday. This was a weekly gain of 315 contracts from the previous week which had a total of 388 net contracts.

This week’s current strength score (the trader positioning range over the past three years, measured from 0 to 100) shows the speculators are currently Bullish-Extreme with a score of 100.0 percent. The commercials are Bearish-Extreme with a score of 0.0 percent and the small traders (not shown in chart) are Bearish-Extreme with a score of 14.9 percent.

BITCOIN StatisticsSPECULATORSCOMMERCIALSSMALL TRADERS
– Percent of Open Interest Longs:81.12.19.1
– Percent of Open Interest Shorts:74.69.48.3
– Net Position:703-78986
– Gross Longs:8,789227989
– Gross Shorts:8,0861,016903
– Long to Short Ratio:1.1 to 10.2 to 11.1 to 1
NET POSITION TREND:
– Strength Index Score (3 Year Range Pct):100.00.014.9
– Strength Index Reading (3 Year Range):Bullish-ExtremeBearish-ExtremeBearish-Extreme
NET POSITION MOVEMENT INDEX:
– 6-Week Change in Strength Index:19.0-24.9-13.6


Article By InvestMacroReceive our weekly COT Reports by Email

*COT Report: The COT data, released weekly to the public each Friday, is updated through the most recent Tuesday (data is 3 days old) and shows a quick view of how large speculators or non-commercials (for-profit traders) were positioned in the futures markets.

The CFTC categorizes trader positions according to commercial hedgers (traders who use futures contracts for hedging as part of the business), non-commercials (large traders who speculate to realize trading profits) and nonreportable traders (usually small traders/speculators) as well as their open interest (contracts open in the market at time of reporting).See CFTC criteria here.

COT Metals Charts: Speculator bets mostly lower this week

By InvestMacro | COT | Data Tables | COT Leaders | Downloads | COT Newsletter

Here are the latest charts and statistics for the Commitment of Traders (COT) data published by the Commodities Futures Trading Commission (CFTC).

The latest COT data is updated through Tuesday May 10th and shows a quick view of how large traders (for-profit speculators and commercial entities) were positioned in the futures markets.

Metals speculator bets overall were lower this week with four out of the five metals markets we cover seeing lower bets on the week. The metals markets are seeing a cool off in their speculative positions as well as their prices as most of these markets are down from a short-term peak in early March.

The only market with higher speculator bets this week was Platinum (2,904 contracts).

The markets with declining speculator bets this week were Silver (-8,986 contracts), Gold (-5,853 contracts), Copper (-7,003 contracts) and Palladium (-493 contracts).


Speculator strength standings for each Commodity where strength index is current net position compared to past three years, above 80 is bullish extreme, below 20 is bearish extreme OI Strength = Current Open Interest level compared to last 3 years range Spec Strength = Current Net Speculator level compared to last 3 years range Strength Move = Six week change of Spec Strength


Data Snapshot of Commodity Market Traders | Columns Legend
May-10-2022OIOI-IndexSpec-NetSpec-IndexCom-NetCOM-IndexSmalls-NetSmalls-Index
WTI Crude1,736,5940310,8032-354,4799843,67677
Gold571,44734193,31540-227,7565734,44157
Silver142,752919,08241-30,5196911,4379
Copper184,50215-22,6262619,249733,37745
Palladium8,83211-3,24533,43496-18933
Platinum66,064321,3635-5,373984,01018
Natural Gas1,108,4516-112,5294564,0065148,523100
Brent173,91119-31,2155930,5624465318
Heating Oil349,618316,45552-32,4343725,97988
Soybeans694,45420174,60872-147,69833-26,91026
Corn1,510,78323470,90890-415,34513-55,56311
Coffee212,659532,55569-33,559371,0040
Sugar797,4530187,18575-220,6112633,42649
Wheat308,326021,68648-17,77934-3,90792


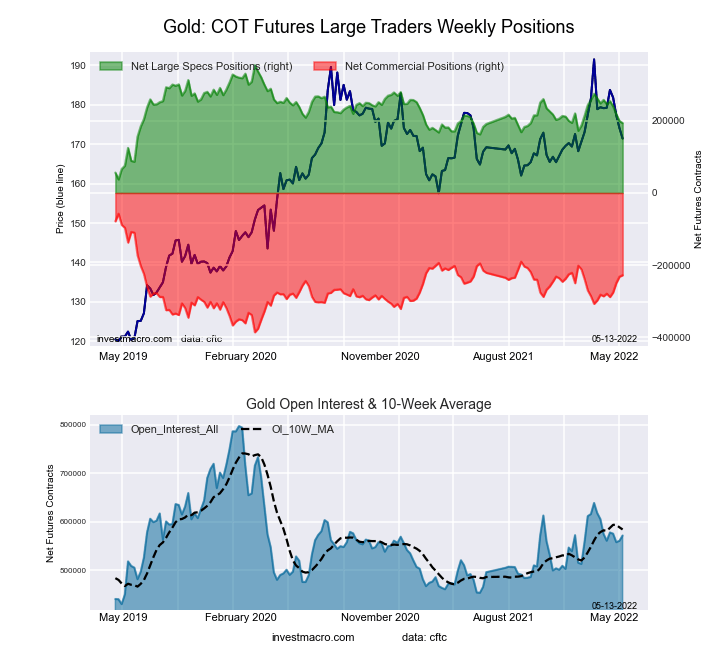
Gold Comex Futures:

Gold Futures COT ChartThe Gold Comex Futures large speculator standing this week reached a net position of 193,315 contracts in the data reported through Tuesday. This was a weekly lowering of -5,853 contracts from the previous week which had a total of 199,168 net contracts.

This week’s current strength score (the trader positioning range over the past three years, measured from 0 to 100) shows the speculators are currently Bearish with a score of 39.9 percent. The commercials are Bullish with a score of 56.8 percent and the small traders (not shown in chart) are Bullish with a score of 57.3 percent.

Gold Futures StatisticsSPECULATORSCOMMERCIALSSMALL TRADERS
– Percent of Open Interest Longs:50.623.19.1
– Percent of Open Interest Shorts:16.763.03.1
– Net Position:193,315-227,75634,441
– Gross Longs:288,947132,25152,098
– Gross Shorts:95,632360,00717,657
– Long to Short Ratio:3.0 to 10.4 to 13.0 to 1
NET POSITION TREND:
– Strength Index Score (3 Year Range Pct):39.956.857.3
– Strength Index Reading (3 Year Range):BearishBullishBullish
NET POSITION MOVEMENT INDEX:
– 6-Week Change in Strength Index:-24.121.019.4


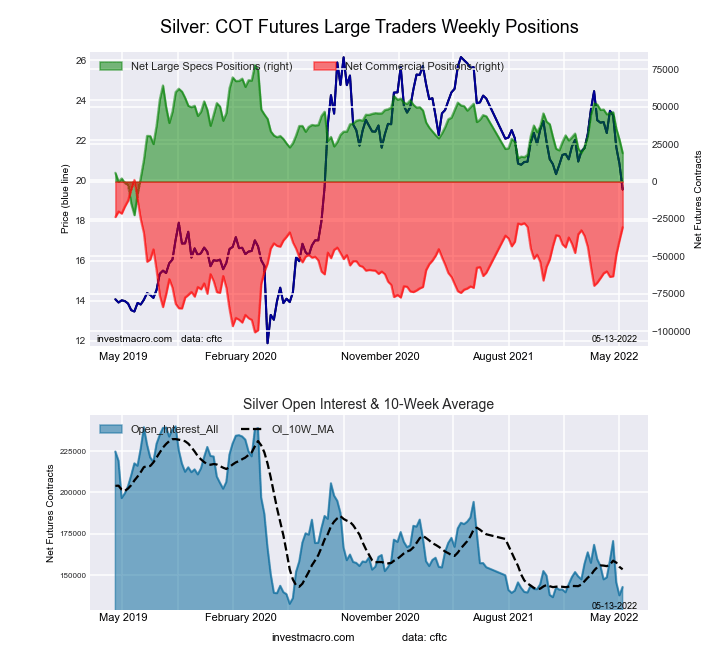
Silver Comex Futures:

Silver Futures COT ChartThe Silver Comex Futures large speculator standing this week reached a net position of 19,082 contracts in the data reported through Tuesday. This was a weekly fall of -8,986 contracts from the previous week which had a total of 28,068 net contracts.

This week’s current strength score (the trader positioning range over the past three years, measured from 0 to 100) shows the speculators are currently Bearish with a score of 41.4 percent. The commercials are Bullish with a score of 69.0 percent and the small traders (not shown in chart) are Bearish-Extreme with a score of 9.5 percent.

Silver Futures StatisticsSPECULATORSCOMMERCIALSSMALL TRADERS
– Percent of Open Interest Longs:41.936.917.4
– Percent of Open Interest Shorts:28.558.39.4
– Net Position:19,082-30,51911,437
– Gross Longs:59,82952,63724,862
– Gross Shorts:40,74783,15613,425
– Long to Short Ratio:1.5 to 10.6 to 11.9 to 1
NET POSITION TREND:
– Strength Index Score (3 Year Range Pct):41.469.09.5
– Strength Index Reading (3 Year Range):BearishBullishBearish-Extreme
NET POSITION MOVEMENT INDEX:
– 6-Week Change in Strength Index:-29.130.3-9.9


Copper Grade #1 Futures:

The Copper Grade #1 Futures large speculator standing this week reached a net position of -22,626 contracts in the data reported through Tuesday. This was a weekly lowering of -7,003 contracts from the previous week which had a total of -15,623 net contracts.

This week’s current strength score (the trader positioning range over the past three years, measured from 0 to 100) shows the speculators are currently Bearish with a score of 26.1 percent. The commercials are Bullish with a score of 72.7 percent and the small traders (not shown in chart) are Bearish with a score of 44.8 percent.

Copper Futures StatisticsSPECULATORSCOMMERCIALSSMALL TRADERS
– Percent of Open Interest Longs:31.250.69.3
– Percent of Open Interest Shorts:43.440.17.5
– Net Position:-22,62619,2493,377
– Gross Longs:57,51093,31817,183
– Gross Shorts:80,13674,06913,806
– Long to Short Ratio:0.7 to 11.3 to 11.2 to 1
NET POSITION TREND:
– Strength Index Score (3 Year Range Pct):26.172.744.8
– Strength Index Reading (3 Year Range):BearishBullishBearish
NET POSITION MOVEMENT INDEX:
– 6-Week Change in Strength Index:-38.338.9-19.5


Platinum Futures:

The Platinum Futures large speculator standing this week reached a net position of 1,363 contracts in the data reported through Tuesday. This was a weekly rise of 2,904 contracts from the previous week which had a total of -1,541 net contracts.

This week’s current strength score (the trader positioning range over the past three years, measured from 0 to 100) shows the speculators are currently Bearish-Extreme with a score of 5.3 percent. The commercials are Bullish-Extreme with a score of 97.6 percent and the small traders (not shown in chart) are Bearish-Extreme with a score of 17.9 percent.

Platinum Futures StatisticsSPECULATORSCOMMERCIALSSMALL TRADERS
– Percent of Open Interest Longs:43.639.812.2
– Percent of Open Interest Shorts:41.547.96.1
– Net Position:1,363-5,3734,010
– Gross Longs:28,77426,2938,029
– Gross Shorts:27,41131,6664,019
– Long to Short Ratio:1.0 to 10.8 to 12.0 to 1
NET POSITION TREND:
– Strength Index Score (3 Year Range Pct):5.397.617.9
– Strength Index Reading (3 Year Range):Bearish-ExtremeBullish-ExtremeBearish-Extreme
NET POSITION MOVEMENT INDEX:
– 6-Week Change in Strength Index:-18.121.2-38.4


Palladium Futures:

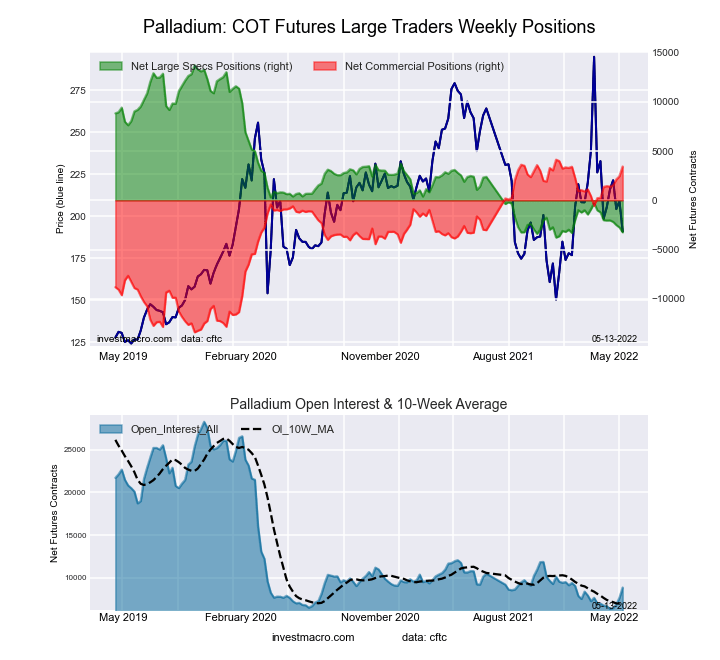
Palladium Futures COT ChartThe Palladium Futures large speculator standing this week reached a net position of -3,245 contracts in the data reported through Tuesday. This was a weekly decrease of -493 contracts from the previous week which had a total of -2,752 net contracts.

This week’s current strength score (the trader positioning range over the past three years, measured from 0 to 100) shows the speculators are currently Bearish-Extreme with a score of 3.0 percent. The commercials are Bullish-Extreme with a score of 96.1 percent and the small traders (not shown in chart) are Bearish with a score of 32.9 percent.

Palladium Futures StatisticsSPECULATORSCOMMERCIALSSMALL TRADERS
– Percent of Open Interest Longs:11.559.011.1
– Percent of Open Interest Shorts:48.220.113.3
– Net Position:-3,2453,434-189
– Gross Longs:1,0135,209982
– Gross Shorts:4,2581,7751,171
– Long to Short Ratio:0.2 to 12.9 to 10.8 to 1
NET POSITION TREND:
– Strength Index Score (3 Year Range Pct):3.096.132.9
– Strength Index Reading (3 Year Range):Bearish-ExtremeBullish-ExtremeBearish
NET POSITION MOVEMENT INDEX:
– 6-Week Change in Strength Index:-7.111.8-48.4


Article By InvestMacroReceive our weekly COT Reports by Email

*COT Report: The COT data, released weekly to the public each Friday, is updated through the most recent Tuesday (data is 3 days old) and shows a quick view of how large speculators or non-commercials (for-profit traders) were positioned in the futures markets.

The CFTC categorizes trader positions according to commercial hedgers (traders who use futures contracts for hedging as part of the business), non-commercials (large traders who speculate to realize trading profits) and nonreportable traders (usually small traders/speculators) as well as their open interest (contracts open in the market at time of reporting).See CFTC criteria here.

COT Bonds Futures Charts: Speculator bets higher this week

By InvestMacro | COT | Data Tables | COT Leaders | Downloads | COT Newsletter

Here are the latest charts and statistics for the Commitment of Traders (COT) data published by the Commodities Futures Trading Commission (CFTC).

The latest COT data is updated through Tuesday May 10th and shows a quick view of how large traders (for-profit speculators and commercial entities) were positioned in the futures markets.

Bonds market speculator bets mostly rose this week as seven out of the eight bond markets we cover saw higher positioning this week. Most of these markets are deeply bearish (speculator levels and price levels) as bond markets have been declining mightily in this higher interest rate environment this year. This week’s rise in bond speculator bets will likely be short-lived although there have been increasing calls that bond markets may have hit or are approaching a short term bottom.

Overall, the markets with higher speculator bets this week were 2-Year Bond (2,342 contracts), Eurodollar (87,521 contracts), 10-Year Bond (61,565 contracts), Ultra 10-Year (15,302 contracts), Long US Bond (1,942 contracts), Fed Funds (104,415 contracts) and the Ultra US Bond (7,666 contracts).

The only market with declining speculator bets this week was the 5-Year Bond (-6,738 contracts).


Speculator strength standings for each Commodity where strength index is current net position compared to past three years, above 80 is bullish extreme, below 20 is bearish extreme OI Strength = Current Open Interest level compared to last 3 years range Spec Strength = Current Net Speculator level compared to last 3 years range Strength Move = Six week change of Spec Strength


Data Snapshot of Bond Market Traders | Columns Legend
May-10-2022OIOI-IndexSpec-NetSpec-IndexCom-NetCOM-IndexSmalls-NetSmalls-Index
Eurodollar10,439,12433-2,600,58733,030,50497-429,91710
FedFunds1,750,4045549,16246-49,2665410460
2-Year2,264,77421-126,82957201,60964-74,78017
Long T-Bond1,207,5605015,45390-4,99119-10,46244
10-Year3,722,69745-85,97259268,37654-182,40436
5-Year3,813,67738-325,67426502,38375-176,70932


3-Month Eurodollars Futures:

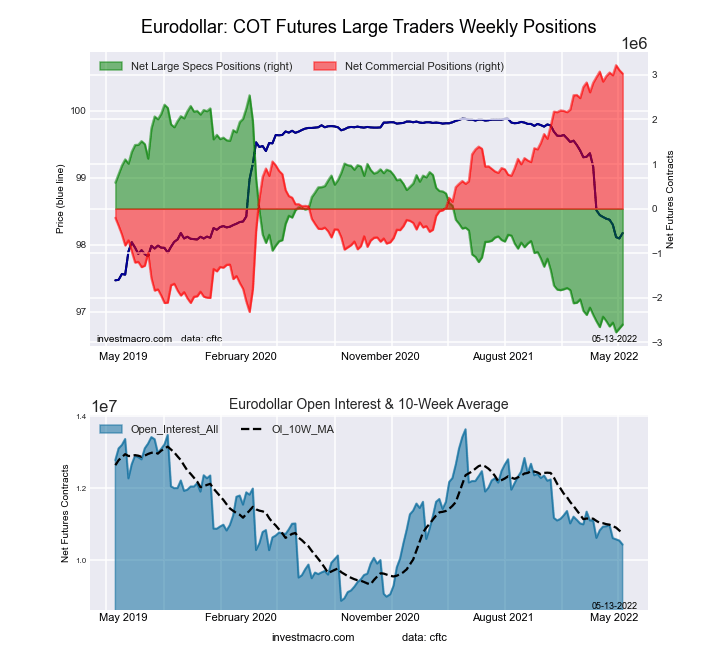
Eurodollar Bonds Futures COT ChartThe 3-Month Eurodollars large speculator standing this week reached a net position of -2,600,587 contracts in the data reported through Tuesday. This was a weekly boost of 87,521 contracts from the previous week which had a total of -2,688,108 net contracts.

This week’s current strength score (the trader positioning range over the past three years, measured from 0 to 100) shows the speculators are currently Bearish-Extreme with a score of 3.3 percent. The commercials are Bullish-Extreme with a score of 96.6 percent and the small traders (not shown in chart) are Bearish-Extreme with a score of 9.8 percent.

3-Month Eurodollars StatisticsSPECULATORSCOMMERCIALSSMALL TRADERS
– Percent of Open Interest Longs:3.475.34.1
– Percent of Open Interest Shorts:28.346.38.2
– Net Position:-2,600,5873,030,504-429,917
– Gross Longs:356,1017,861,403422,820
– Gross Shorts:2,956,6884,830,899852,737
– Long to Short Ratio:0.1 to 11.6 to 10.5 to 1
NET POSITION TREND:
– Strength Index Score (3 Year Range Pct):3.396.69.8
– Strength Index Reading (3 Year Range):Bearish-ExtremeBullish-ExtremeBearish-Extreme
NET POSITION MOVEMENT INDEX:
– 6-Week Change in Strength Index:-3.33.2-0.4


30-Day Federal Funds Futures:

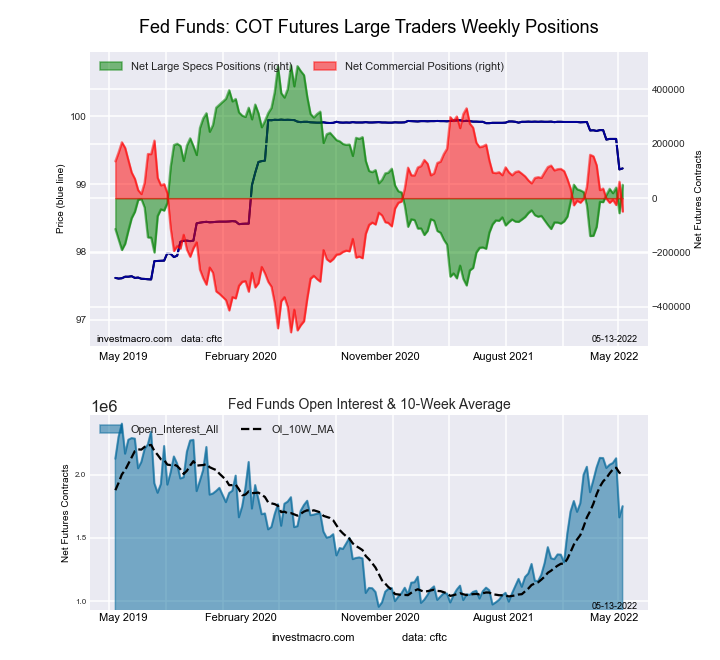
Federal Funds 30-Day Bonds Futures COT ChartThe 30-Day Federal Funds large speculator standing this week reached a net position of 49,162 contracts in the data reported through Tuesday. This was a weekly gain of 104,415 contracts from the previous week which had a total of -55,253 net contracts.

This week’s current strength score (the trader positioning range over the past three years, measured from 0 to 100) shows the speculators are currently Bearish with a score of 45.7 percent. The commercials are Bullish with a score of 53.9 percent and the small traders (not shown in chart) are Bullish with a score of 60.0 percent.

30-Day Federal Funds StatisticsSPECULATORSCOMMERCIALSSMALL TRADERS
– Percent of Open Interest Longs:5.975.22.3
– Percent of Open Interest Shorts:3.178.02.3
– Net Position:49,162-49,266104
– Gross Longs:103,2381,316,14739,627
– Gross Shorts:54,0761,365,41339,523
– Long to Short Ratio:1.9 to 11.0 to 11.0 to 1
NET POSITION TREND:
– Strength Index Score (3 Year Range Pct):45.753.960.0
– Strength Index Reading (3 Year Range):BearishBullishBullish
NET POSITION MOVEMENT INDEX:
– 6-Week Change in Strength Index:7.8-10.353.3


2-Year Treasury Note Futures:

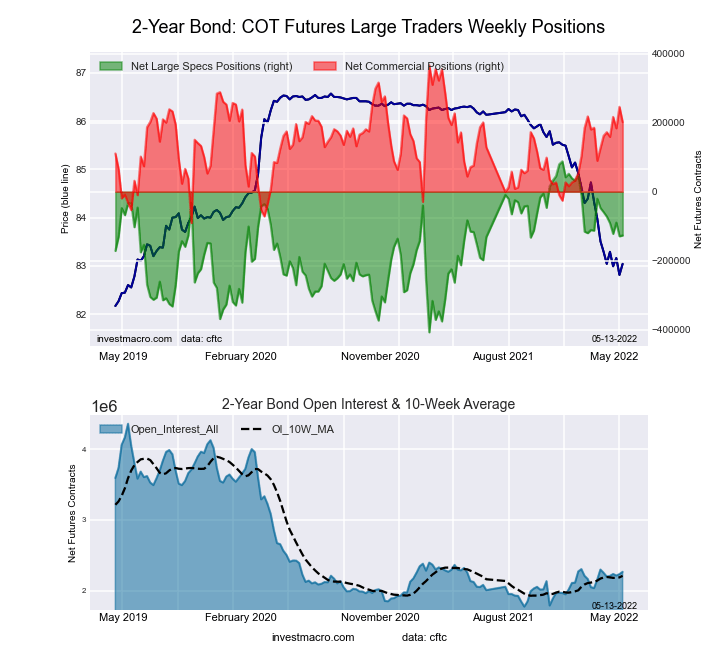
2-Year Treasury Bonds Futures COT ChartThe 2-Year Treasury Note large speculator standing this week reached a net position of -126,829 contracts in the data reported through Tuesday. This was a weekly rise of 2,342 contracts from the previous week which had a total of -129,171 net contracts.

This week’s current strength score (the trader positioning range over the past three years, measured from 0 to 100) shows the speculators are currently Bullish with a score of 56.7 percent. The commercials are Bullish with a score of 63.9 percent and the small traders (not shown in chart) are Bearish-Extreme with a score of 17.4 percent.

2-Year Treasury Note StatisticsSPECULATORSCOMMERCIALSSMALL TRADERS
– Percent of Open Interest Longs:12.177.36.2
– Percent of Open Interest Shorts:17.768.49.5
– Net Position:-126,829201,609-74,780
– Gross Longs:275,1531,751,572140,782
– Gross Shorts:401,9821,549,963215,562
– Long to Short Ratio:0.7 to 11.1 to 10.7 to 1
NET POSITION TREND:
– Strength Index Score (3 Year Range Pct):56.763.917.4
– Strength Index Reading (3 Year Range):BullishBullishBearish-Extreme
NET POSITION MOVEMENT INDEX:
– 6-Week Change in Strength Index:-13.78.711.6


5-Year Treasury Note Futures:

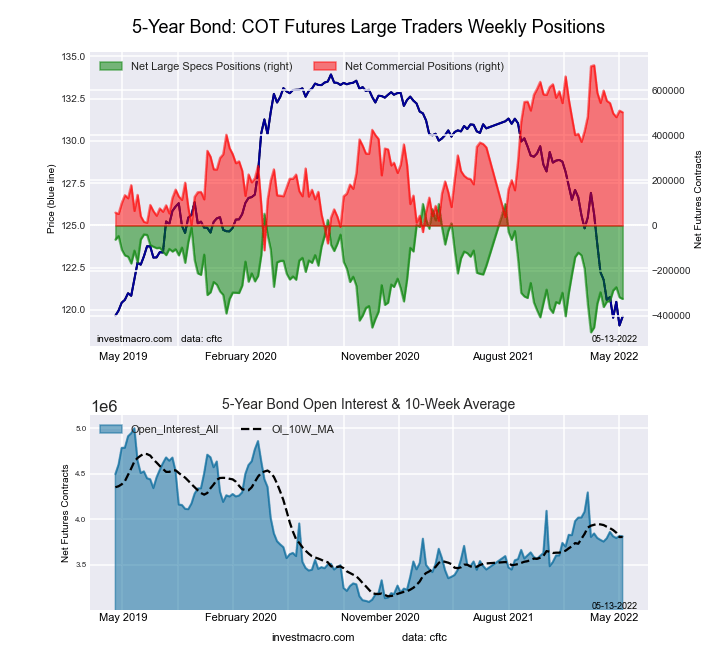
5-Year Treasury Bonds Futures COT ChartThe 5-Year Treasury Note large speculator standing this week reached a net position of -325,674 contracts in the data reported through Tuesday. This was a weekly decrease of -6,738 contracts from the previous week which had a total of -318,936 net contracts.

This week’s current strength score (the trader positioning range over the past three years, measured from 0 to 100) shows the speculators are currently Bearish with a score of 26.1 percent. The commercials are Bullish with a score of 74.5 percent and the small traders (not shown in chart) are Bearish with a score of 32.5 percent.

5-Year Treasury Note StatisticsSPECULATORSCOMMERCIALSSMALL TRADERS
– Percent of Open Interest Longs:7.683.07.1
– Percent of Open Interest Shorts:16.269.911.8
– Net Position:-325,674502,383-176,709
– Gross Longs:291,5273,167,247271,640
– Gross Shorts:617,2012,664,864448,349
– Long to Short Ratio:0.5 to 11.2 to 10.6 to 1
NET POSITION TREND:
– Strength Index Score (3 Year Range Pct):26.174.532.5
– Strength Index Reading (3 Year Range):BearishBullishBearish
NET POSITION MOVEMENT INDEX:
– 6-Week Change in Strength Index:6.3-11.716.6


10-Year Treasury Note Futures:

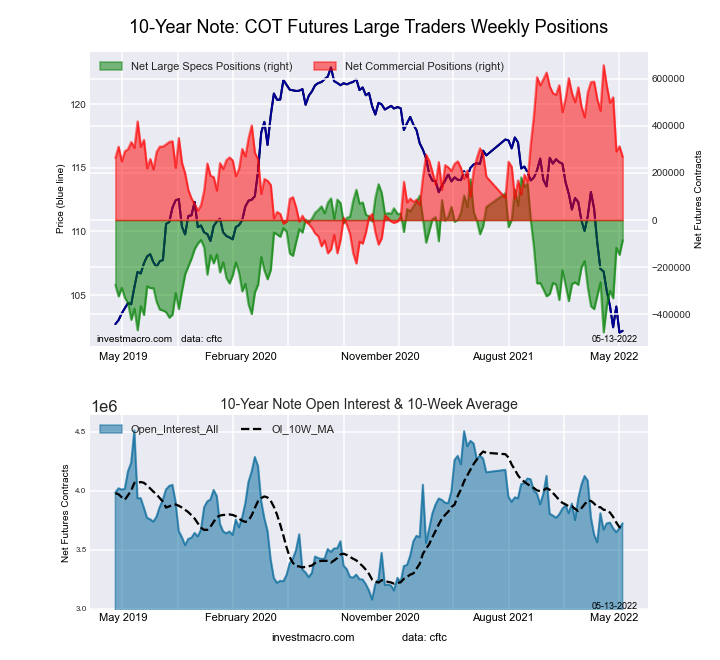
10-Year Treasury Notes Bonds Futures COT ChartThe 10-Year Treasury Note large speculator standing this week reached a net position of -85,972 contracts in the data reported through Tuesday. This was a weekly advance of 61,565 contracts from the previous week which had a total of -147,537 net contracts.

This week’s current strength score (the trader positioning range over the past three years, measured from 0 to 100) shows the speculators are currently Bullish with a score of 59.4 percent. The commercials are Bullish with a score of 53.8 percent and the small traders (not shown in chart) are Bearish with a score of 36.2 percent.

10-Year Treasury Note StatisticsSPECULATORSCOMMERCIALSSMALL TRADERS
– Percent of Open Interest Longs:10.976.58.4
– Percent of Open Interest Shorts:13.269.213.3
– Net Position:-85,972268,376-182,404
– Gross Longs:406,1232,846,309313,590
– Gross Shorts:492,0952,577,933495,994
– Long to Short Ratio:0.8 to 11.1 to 10.6 to 1
NET POSITION TREND:
– Strength Index Score (3 Year Range Pct):59.453.836.2
– Strength Index Reading (3 Year Range):BullishBullishBearish
NET POSITION MOVEMENT INDEX:
– 6-Week Change in Strength Index:59.4-46.2-0.3


Ultra 10-Year Notes Futures:

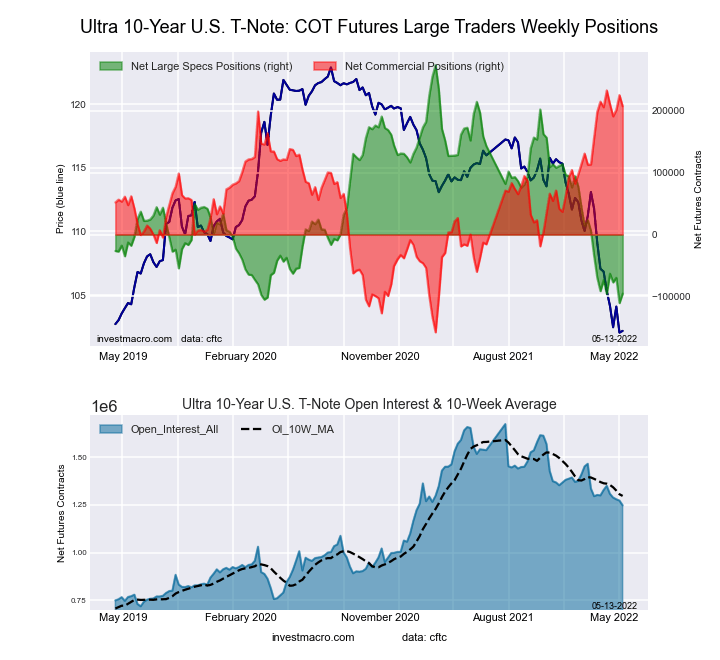
Ultra 10-Year Treasury Notes Bonds Futures COT ChartThe Ultra 10-Year Notes large speculator standing this week reached a net position of -95,416 contracts in the data reported through Tuesday. This was a weekly increase of 15,302 contracts from the previous week which had a total of -110,718 net contracts.

This week’s current strength score (the trader positioning range over the past three years, measured from 0 to 100) shows the speculators are currently Bearish-Extreme with a score of 4.0 percent. The commercials are Bullish-Extreme with a score of 93.4 percent and the small traders (not shown in chart) are Bearish with a score of 48.6 percent.

Ultra 10-Year Notes StatisticsSPECULATORSCOMMERCIALSSMALL TRADERS
– Percent of Open Interest Longs:4.582.911.3
– Percent of Open Interest Shorts:12.266.320.3
– Net Position:-95,416207,218-111,802
– Gross Longs:56,7831,034,536141,487
– Gross Shorts:152,199827,318253,289
– Long to Short Ratio:0.4 to 11.3 to 10.6 to 1
NET POSITION TREND:
– Strength Index Score (3 Year Range Pct):4.093.448.6
– Strength Index Reading (3 Year Range):Bearish-ExtremeBullish-ExtremeBearish
NET POSITION MOVEMENT INDEX:
– 6-Week Change in Strength Index:-5.70.412.4


US Treasury Bonds Futures:

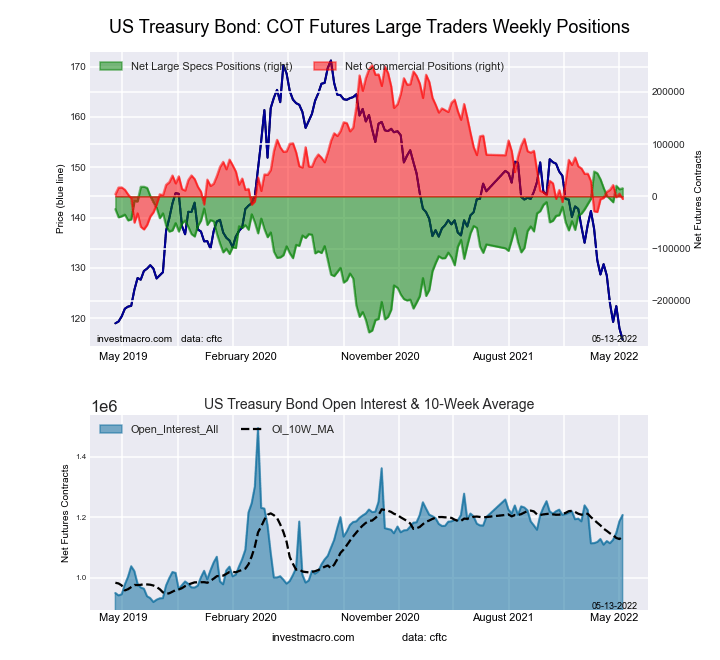
US Year Treasury Notes Long Bonds Futures COT ChartThe US Treasury Bonds large speculator standing this week reached a net position of 15,453 contracts in the data reported through Tuesday. This was a weekly increase of 1,942 contracts from the previous week which had a total of 13,511 net contracts.

This week’s current strength score (the trader positioning range over the past three years, measured from 0 to 100) shows the speculators are currently Bullish-Extreme with a score of 89.6 percent. The commercials are Bearish-Extreme with a score of 18.5 percent and the small traders (not shown in chart) are Bearish with a score of 44.3 percent.

US Treasury Bonds StatisticsSPECULATORSCOMMERCIALSSMALL TRADERS
– Percent of Open Interest Longs:10.972.113.0
– Percent of Open Interest Shorts:9.672.513.8
– Net Position:15,453-4,991-10,462
– Gross Longs:131,916870,932156,698
– Gross Shorts:116,463875,923167,160
– Long to Short Ratio:1.1 to 11.0 to 10.9 to 1
NET POSITION TREND:
– Strength Index Score (3 Year Range Pct):89.618.544.3
– Strength Index Reading (3 Year Range):Bullish-ExtremeBearish-ExtremeBearish
NET POSITION MOVEMENT INDEX:
– 6-Week Change in Strength Index:-0.2-0.61.9


Ultra US Treasury Bonds Futures:

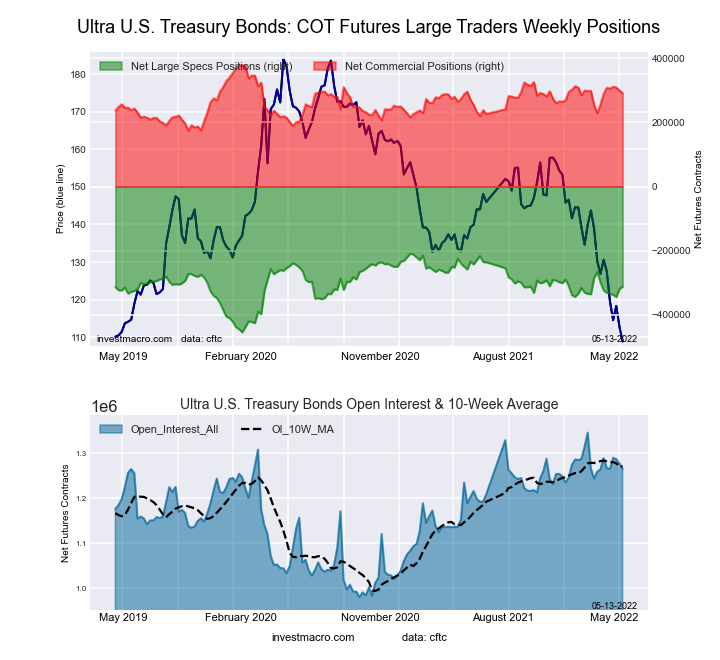
Ultra US Year Treasury Notes Long Bonds Futures COT ChartThe Ultra US Treasury Bonds large speculator standing this week reached a net position of -311,513 contracts in the data reported through Tuesday. This was a weekly advance of 7,666 contracts from the previous week which had a total of -319,179 net contracts.

This week’s current strength score (the trader positioning range over the past three years, measured from 0 to 100) shows the speculators are currently Bullish with a score of 58.1 percent. The commercials are Bullish with a score of 57.2 percent and the small traders (not shown in chart) are Bearish with a score of 43.2 percent.

Ultra US Treasury Bonds StatisticsSPECULATORSCOMMERCIALSSMALL TRADERS
– Percent of Open Interest Longs:3.684.611.4
– Percent of Open Interest Shorts:28.261.69.8
– Net Position:-311,513290,65520,858
– Gross Longs:45,0841,069,894144,208
– Gross Shorts:356,597779,239123,350
– Long to Short Ratio:0.1 to 11.4 to 11.2 to 1
NET POSITION TREND:
– Strength Index Score (3 Year Range Pct):58.157.243.2
– Strength Index Reading (3 Year Range):BullishBullishBearish
NET POSITION MOVEMENT INDEX:
– 6-Week Change in Strength Index:4.90.8-9.9


Article By InvestMacroReceive our weekly COT Reports by Email

*COT Report: The COT data, released weekly to the public each Friday, is updated through the most recent Tuesday (data is 3 days old) and shows a quick view of how large speculators or non-commercials (for-profit traders) were positioned in the futures markets.

The CFTC categorizes trader positions according to commercial hedgers (traders who use futures contracts for hedging as part of the business), non-commercials (large traders who speculate to realize trading profits) and nonreportable traders (usually small traders/speculators) as well as their open interest (contracts open in the market at time of reporting).See CFTC criteria here.

COT Futures: This Week’s Energy Charts

By InvestMacro | COT | Data Tables | COT Leaders | Downloads | COT Newsletter

Here are the latest charts and statistics for the Commitment of Traders (COT) data published by the Commodities Futures Trading Commission (CFTC).

The latest COT data is updated through Tuesday May 10th and shows a quick view of how large traders (for-profit speculators and commercial entities) were positioned in the futures markets.

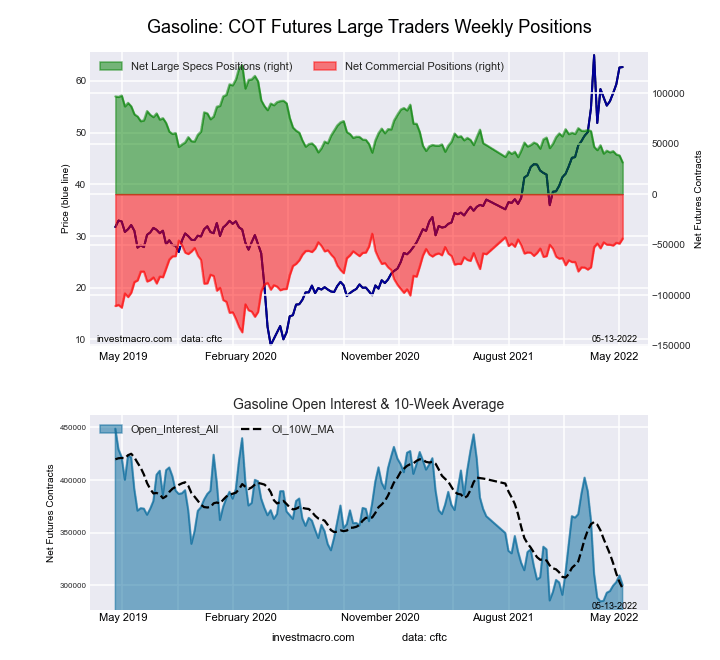
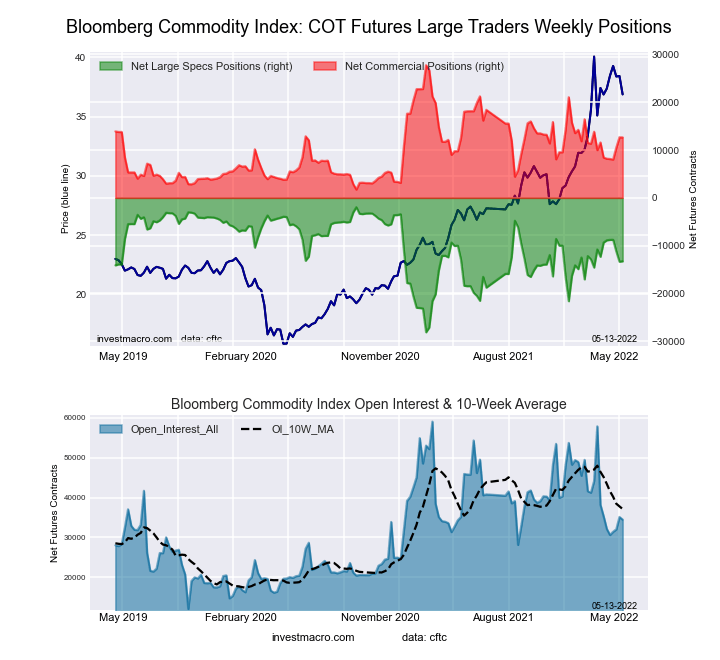
The energy markets with higher speculator bets this week were Natural Gas (5,177 contracts) and the Bloomberg Commodity Index (91 contracts).

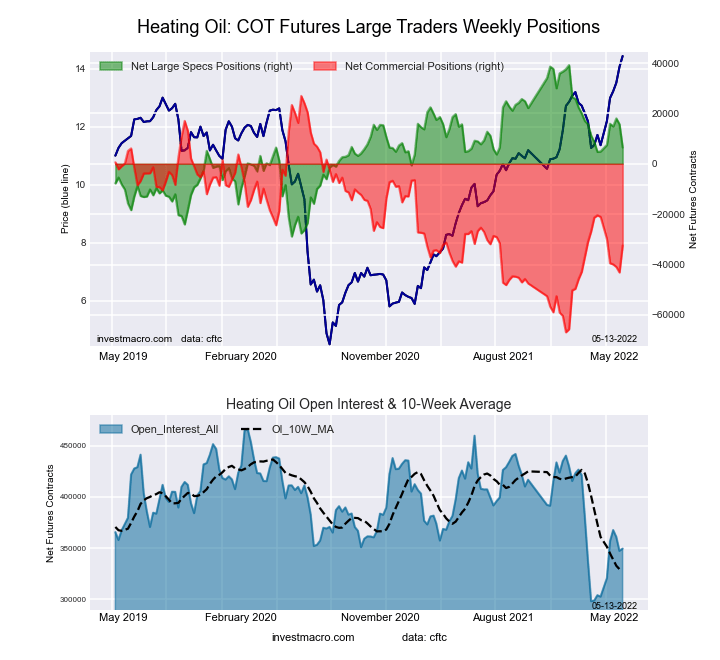
The markets with declining speculator bets this week were WTI Crude Oil (-10,898 contracts), Brent Crude Oil (-3,897 contracts), Heating Oil (-9,228 contracts) and Gasoline (-7,003 contracts).


Data Snapshot of Commodity Market Traders | Columns Legend
May-10-2022OIOI-IndexSpec-NetSpec-IndexCom-NetCOM-IndexSmalls-NetSmalls-Index
WTI Crude1,736,5940310,8032-354,4799843,67677
Gold571,44734193,31540-227,7565734,44157
Silver142,752919,08241-30,5196911,4379
Copper184,50215-22,6262619,249733,37745
Palladium8,83211-3,24533,43496-18933
Platinum66,064321,3635-5,373984,01018
Natural Gas1,108,4516-112,5294564,0065148,523100
Brent173,91119-31,2155930,5624465318
Heating Oil349,618316,45552-32,4343725,97988
Soybeans694,45420174,60872-147,69833-26,91026
Corn1,510,78323470,90890-415,34513-55,56311
Coffee212,659532,55569-33,559371,0040
Sugar797,4530187,18575-220,6112633,42649
Wheat308,326021,68648-17,77934-3,90792


WTI Crude Oil Futures:

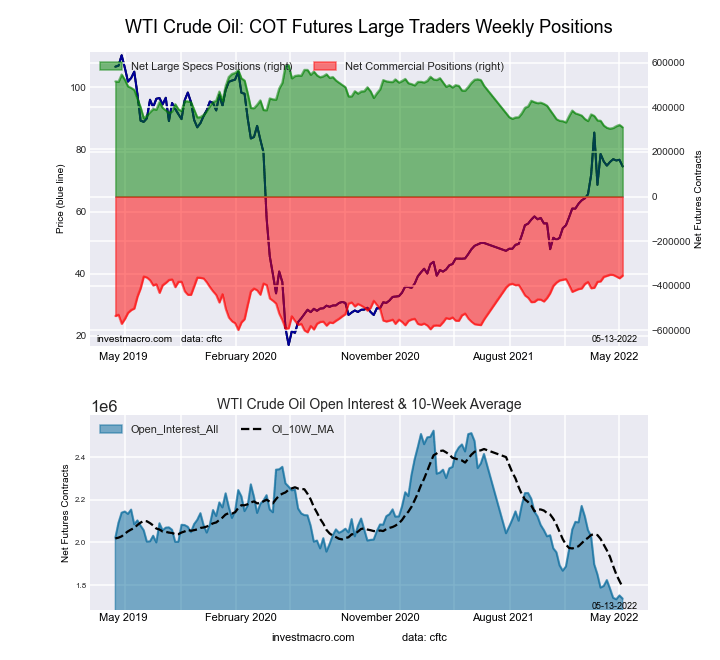
WTI Crude Oil Futures COT ChartThe WTI Crude Oil Futures large speculator standing this week equaled a net position of 310,803 contracts in the data reported through Tuesday. This was a weekly fall of -10,898 contracts from the previous week which had a total of 321,701 net contracts.

This week’s current strength score (the trader positioning range over the past three years, measured from 0 to 100) shows the speculators are currently Bearish-Extreme with a score of 2.1 percent. The commercials are Bullish-Extreme with a score of 98.5 percent and the small traders (not shown in chart) are Bullish with a score of 76.6 percent.

WTI Crude Oil Futures StatisticsSPECULATORSCOMMERCIALSSMALL TRADERS
– Percent of Open Interest Longs:23.935.45.2
– Percent of Open Interest Shorts:6.055.82.7
– Net Position:310,803-354,47943,676
– Gross Longs:415,170614,71690,689
– Gross Shorts:104,367969,19547,013
– Long to Short Ratio:4.0 to 10.6 to 11.9 to 1
NET POSITION TREND:
– Strength Index Score (3 Year Range Pct):2.198.576.6
– Strength Index Reading (3 Year Range):Bearish-ExtremeBullish-ExtremeBullish
NET POSITION MOVEMENT INDEX:
– 6-Week Change in Strength Index:-2.82.23.2


Brent Crude Oil Futures:

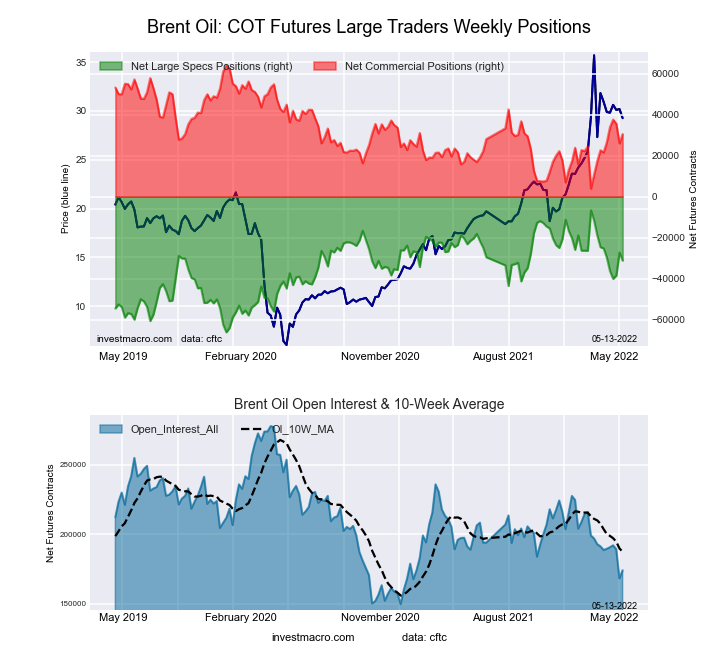
Brent Last Day Crude Oil Futures COT ChartThe Brent Crude Oil Futures large speculator standing this week equaled a net position of -31,215 contracts in the data reported through Tuesday. This was a weekly fall of -3,897 contracts from the previous week which had a total of -27,318 net contracts.

This week’s current strength score (the trader positioning range over the past three years, measured from 0 to 100) shows the speculators are currently Bullish with a score of 58.8 percent. The commercials are Bearish with a score of 44.1 percent and the small traders (not shown in chart) are Bearish-Extreme with a score of 18.0 percent.

Brent Crude Oil Futures StatisticsSPECULATORSCOMMERCIALSSMALL TRADERS
– Percent of Open Interest Longs:19.248.15.0
– Percent of Open Interest Shorts:37.230.54.6
– Net Position:-31,21530,562653
– Gross Longs:33,42383,6398,698
– Gross Shorts:64,63853,0778,045
– Long to Short Ratio:0.5 to 11.6 to 11.1 to 1
NET POSITION TREND:
– Strength Index Score (3 Year Range Pct):58.844.118.0
– Strength Index Reading (3 Year Range):BullishBearishBearish-Extreme
NET POSITION MOVEMENT INDEX:
– 6-Week Change in Strength Index:-10.114.9-40.0


Natural Gas Futures:

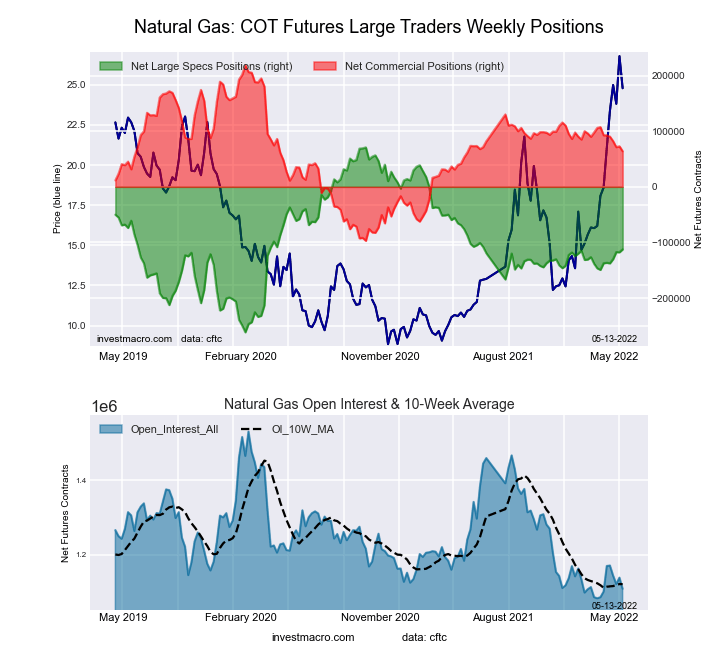
Natural Gas Futures COT ChartThe Natural Gas Futures large speculator standing this week equaled a net position of -112,529 contracts in the data reported through Tuesday. This was a weekly boost of 5,177 contracts from the previous week which had a total of -117,706 net contracts.

This week’s current strength score (the trader positioning range over the past three years, measured from 0 to 100) shows the speculators are currently Bearish with a score of 44.8 percent. The commercials are Bullish with a score of 51.0 percent and the small traders (not shown in chart) are Bullish-Extreme with a score of 100.0 percent.

Natural Gas Futures StatisticsSPECULATORSCOMMERCIALSSMALL TRADERS
– Percent of Open Interest Longs:21.137.96.6
– Percent of Open Interest Shorts:31.332.22.2
– Net Position:-112,52964,00648,523
– Gross Longs:234,306420,58273,144
– Gross Shorts:346,835356,57624,621
– Long to Short Ratio:0.7 to 11.2 to 13.0 to 1
NET POSITION TREND:
– Strength Index Score (3 Year Range Pct):44.851.0100.0
– Strength Index Reading (3 Year Range):BearishBullishBullish-Extreme
NET POSITION MOVEMENT INDEX:
– 6-Week Change in Strength Index:7.5-9.19.6


Gasoline Blendstock Futures:

RBOB Gasoline Energy Futures COT ChartThe Gasoline Blendstock Futures large speculator standing this week equaled a net position of 31,378 contracts in the data reported through Tuesday. This was a weekly decline of -7,003 contracts from the previous week which had a total of 38,381 net contracts.

This week’s current strength score (the trader positioning range over the past three years, measured from 0 to 100) shows the speculators are currently Bearish-Extreme with a score of 2.1 percent. The commercials are Bullish-Extreme with a score of 93.0 percent and the small traders (not shown in chart) are Bullish-Extreme with a score of 97.3 percent.

Nasdaq Mini Futures StatisticsSPECULATORSCOMMERCIALSSMALL TRADERS
– Percent of Open Interest Longs:24.650.98.3
– Percent of Open Interest Shorts:14.265.64.0
– Net Position:31,378-44,07212,694
– Gross Longs:73,929152,80924,799
– Gross Shorts:42,551196,88112,105
– Long to Short Ratio:1.7 to 10.8 to 12.0 to 1
NET POSITION TREND:
– Strength Index Score (3 Year Range Pct):2.193.097.3
– Strength Index Reading (3 Year Range):Bearish-ExtremeBullish-ExtremeBullish-Extreme
NET POSITION MOVEMENT INDEX:
– 6-Week Change in Strength Index:-9.03.734.1


#2 Heating Oil NY-Harbor Futures:

NY Harbor Heating Oil Energy Futures COT ChartThe #2 Heating Oil NY-Harbor Futures large speculator standing this week equaled a net position of 6,455 contracts in the data reported through Tuesday. This was a weekly lowering of -9,228 contracts from the previous week which had a total of 15,683 net contracts.

This week’s current strength score (the trader positioning range over the past three years, measured from 0 to 100) shows the speculators are currently Bullish with a score of 51.9 percent. The commercials are Bearish with a score of 36.7 percent and the small traders (not shown in chart) are Bullish-Extreme with a score of 88.4 percent.

Heating Oil Futures StatisticsSPECULATORSCOMMERCIALSSMALL TRADERS
– Percent of Open Interest Longs:17.050.814.4
– Percent of Open Interest Shorts:15.160.16.9
– Net Position:6,455-32,43425,979
– Gross Longs:59,340177,62650,210
– Gross Shorts:52,885210,06024,231
– Long to Short Ratio:1.1 to 10.8 to 12.1 to 1
NET POSITION TREND:
– Strength Index Score (3 Year Range Pct):51.936.788.4
– Strength Index Reading (3 Year Range):BullishBearishBullish-Extreme
NET POSITION MOVEMENT INDEX:
– 6-Week Change in Strength Index:4.2-10.323.6


Bloomberg Commodity Index Futures:

Bloomberg Commodity Index Futures COT ChartThe Bloomberg Commodity Index Futures large speculator standing this week equaled a net position of -13,263 contracts in the data reported through Tuesday. This was a weekly lift of 91 contracts from the previous week which had a total of -13,354 net contracts.

This week’s current strength score (the trader positioning range over the past three years, measured from 0 to 100) shows the speculators are currently Bullish with a score of 56.8 percent. The commercials are Bearish with a score of 41.9 percent and the small traders (not shown in chart) are Bearish with a score of 41.5 percent.

Bloomberg Index Futures StatisticsSPECULATORSCOMMERCIALSSMALL TRADERS
– Percent of Open Interest Longs:57.736.72.0
– Percent of Open Interest Shorts:96.20.00.2
– Net Position:-13,26312,644619
– Gross Longs:19,88812,644703
– Gross Shorts:33,151084
– Long to Short Ratio:0.6 to 1inf to 18.4 to 1
NET POSITION TREND:
– Strength Index Score (3 Year Range Pct):56.841.941.5
– Strength Index Reading (3 Year Range):BullishBearishBearish
NET POSITION MOVEMENT INDEX:
– 6-Week Change in Strength Index:-15.016.3-11.1


Article By InvestMacroReceive our weekly COT Reports by Email

*COT Report: The COT data, released weekly to the public each Friday, is updated through the most recent Tuesday (data is 3 days old) and shows a quick view of how large speculators or non-commercials (for-profit traders) were positioned in the futures markets.

The CFTC categorizes trader positions according to commercial hedgers (traders who use futures contracts for hedging as part of the business), non-commercials (large traders who speculate to realize trading profits) and nonreportable traders (usually small traders/speculators) as well as their open interest (contracts open in the market at time of reporting).See CFTC criteria here.

COT Soft Commodities Charts: Speculator bets mostly cool off this week

By InvestMacro | COT | Data Tables | COT Leaders | Downloads | COT Newsletter

Here are the latest charts and statistics for the Commitment of Traders (COT) data published by the Commodities Futures Trading Commission (CFTC).

The latest COT data is updated through Tuesday May 10th and shows a quick view of how large traders (for-profit speculators and commercial entities) were positioned in the futures markets.

Soft commodities speculator bets cooled off this week with nine out of the eleven markets we cover showing a decrease in their positioning. Soft commodities markets have been red hot this year with the war in Ukraine causing food disruptions, general production problems, food protectionism and, of course, with inflation rising throughout the world.

Overall, the soft commodities that saw higher bets this week were just Soybean Oil (3,305 contracts) and Wheat (1,674 contracts).

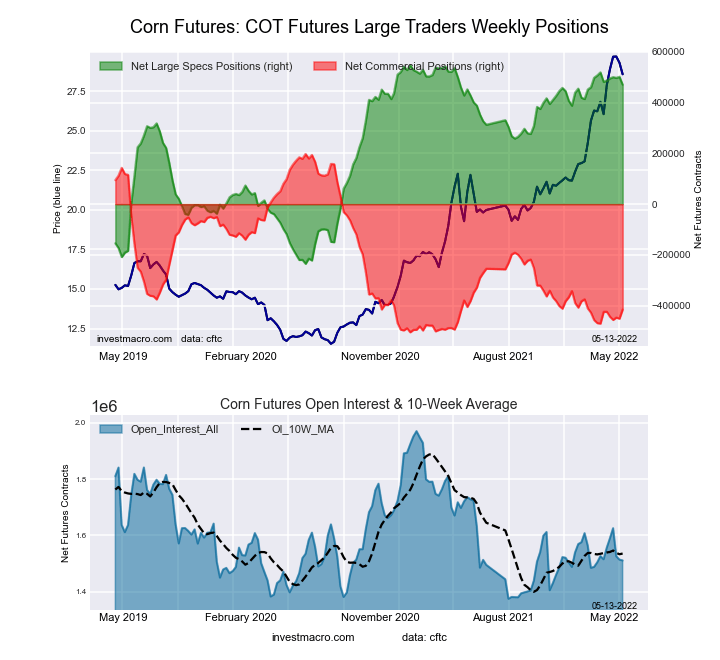
Meanwhile, the soft commodities that saw lower speculator bets on the week were Corn (-30,957 contracts), Sugar (-14,407 contracts), Coffee (-8,142 contracts), Soybeans (-15,794 contracts), Soybean Meal (-15,429 contracts), Live Cattle (-7,233 contracts), Lean Hogs (-5,671 contracts), Cotton (-1,674 contracts) and Cocoa (-15,513 contracts).


Data Snapshot of Commodity Market Traders | Columns Legend
May-10-2022OIOI-IndexSpec-NetSpec-IndexCom-NetCOM-IndexSmalls-NetSmalls-Index
WTI Crude1,736,5940310,8032-354,4799843,67677
Gold571,44734193,31540-227,7565734,44157
Silver142,752919,08241-30,5196911,4379
Copper184,50215-22,6262619,249733,37745
Palladium8,83211-3,24533,43496-18933
Platinum66,064321,3635-5,373984,01018
Natural Gas1,108,4516-112,5294564,0065148,523100
Brent173,91119-31,2155930,5624465318
Heating Oil349,618316,45552-32,4343725,97988
Soybeans694,45420174,60872-147,69833-26,91026
Corn1,510,78323470,90890-415,34513-55,56311
Coffee212,659532,55569-33,559371,0040
Sugar797,4530187,18575-220,6112633,42649
Wheat308,326021,68648-17,77934-3,90792


CORN Futures:

CORN Futures COT ChartThe CORN large speculator standing this week totaled a net position of 470,908 contracts in the data reported through Tuesday. This was a weekly reduction of -30,957 contracts from the previous week which had a total of 501,865 net contracts.

This week’s current strength score (the trader positioning range over the past three years, measured from 0 to 100) shows the speculators are currently Bullish-Extreme with a score of 90.2 percent. The commercials are Bearish-Extreme with a score of 12.8 percent and the small traders (not shown in chart) are Bearish-Extreme with a score of 11.1 percent.

CORN Futures StatisticsSPECULATORSCOMMERCIALSSMALL TRADERS
– Percent of Open Interest Longs:37.942.78.9
– Percent of Open Interest Shorts:6.870.212.6
– Net Position:470,908-415,345-55,563
– Gross Longs:573,327644,830134,903
– Gross Shorts:102,4191,060,175190,466
– Long to Short Ratio:5.6 to 10.6 to 10.7 to 1
NET POSITION TREND:
– Strength Index Score (3 Year Range Pct):90.212.811.1
– Strength Index Reading (3 Year Range):Bullish-ExtremeBearish-ExtremeBearish-Extreme
NET POSITION MOVEMENT INDEX:
– 6-Week Change in Strength Index:-1.41.31.1


SUGAR Futures:

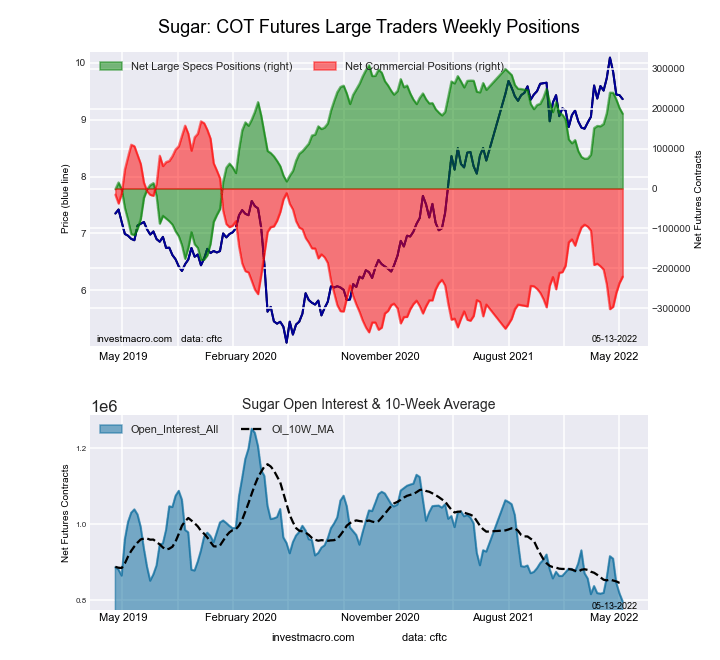
SUGAR Futures COT ChartThe SUGAR large speculator standing this week totaled a net position of 187,185 contracts in the data reported through Tuesday. This was a weekly lowering of -14,407 contracts from the previous week which had a total of 201,592 net contracts.

This week’s current strength score (the trader positioning range over the past three years, measured from 0 to 100) shows the speculators are currently Bullish with a score of 75.1 percent. The commercials are Bearish with a score of 26.3 percent and the small traders (not shown in chart) are Bearish with a score of 49.2 percent.

SUGAR Futures StatisticsSPECULATORSCOMMERCIALSSMALL TRADERS
– Percent of Open Interest Longs:31.545.810.8
– Percent of Open Interest Shorts:8.073.56.6
– Net Position:187,185-220,61133,426
– Gross Longs:251,330365,26386,129
– Gross Shorts:64,145585,87452,703
– Long to Short Ratio:3.9 to 10.6 to 11.6 to 1
NET POSITION TREND:
– Strength Index Score (3 Year Range Pct):75.126.349.2
– Strength Index Reading (3 Year Range):BullishBearishBearish
NET POSITION MOVEMENT INDEX:
– 6-Week Change in Strength Index:5.3-3.4-9.6


COFFEE Futures:

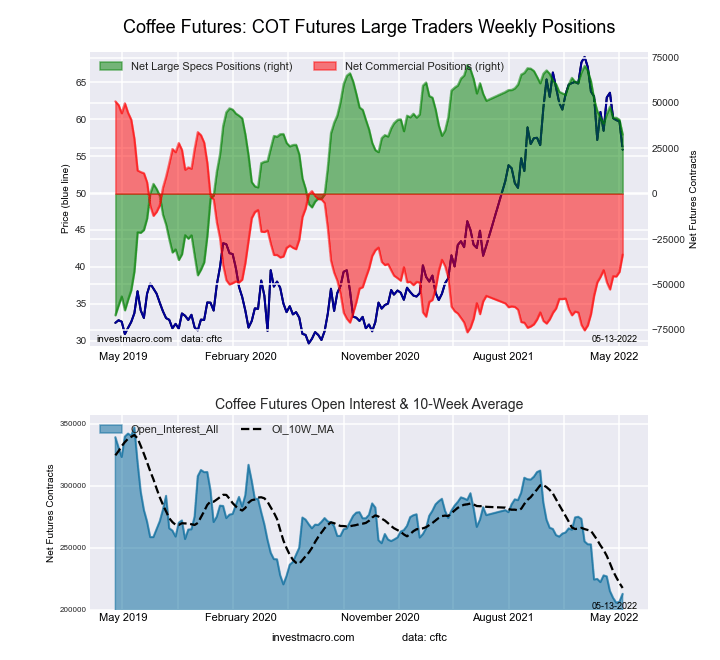
COFFEE Futures COT ChartThe COFFEE large speculator standing this week totaled a net position of 32,555 contracts in the data reported through Tuesday. This was a weekly decrease of -8,142 contracts from the previous week which had a total of 40,697 net contracts.

This week’s current strength score (the trader positioning range over the past three years, measured from 0 to 100) shows the speculators are currently Bullish with a score of 69.2 percent. The commercials are Bearish with a score of 36.5 percent and the small traders (not shown in chart) are Bearish-Extreme with a score of 0.0 percent.

COFFEE Futures StatisticsSPECULATORSCOMMERCIALSSMALL TRADERS
– Percent of Open Interest Longs:23.856.13.6
– Percent of Open Interest Shorts:8.571.93.1
– Net Position:32,555-33,5591,004
– Gross Longs:50,564119,3997,690
– Gross Shorts:18,009152,9586,686
– Long to Short Ratio:2.8 to 10.8 to 11.2 to 1
NET POSITION TREND:
– Strength Index Score (3 Year Range Pct):69.236.50.0
– Strength Index Reading (3 Year Range):BullishBearishBearish-Extreme
NET POSITION MOVEMENT INDEX:
– 6-Week Change in Strength Index:-4.97.3-20.9


SOYBEANS Futures:

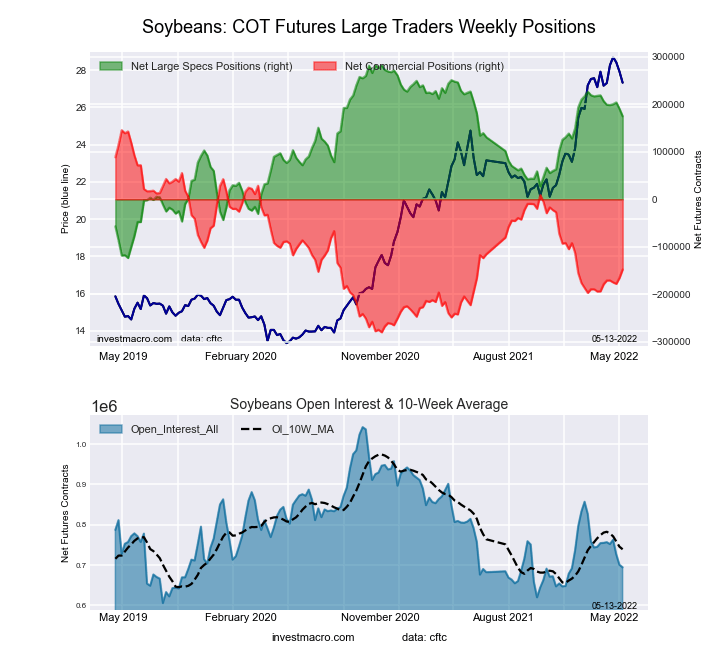
SOYBEANS Futures COT ChartThe SOYBEANS large speculator standing this week totaled a net position of 174,608 contracts in the data reported through Tuesday. This was a weekly fall of -15,794 contracts from the previous week which had a total of 190,402 net contracts.

This week’s current strength score (the trader positioning range over the past three years, measured from 0 to 100) shows the speculators are currently Bullish with a score of 71.9 percent. The commercials are Bearish with a score of 33.1 percent and the small traders (not shown in chart) are Bearish with a score of 25.6 percent.

SOYBEANS Futures StatisticsSPECULATORSCOMMERCIALSSMALL TRADERS
– Percent of Open Interest Longs:32.448.27.1
– Percent of Open Interest Shorts:7.369.511.0
– Net Position:174,608-147,698-26,910
– Gross Longs:225,260334,79249,376
– Gross Shorts:50,652482,49076,286
– Long to Short Ratio:4.4 to 10.7 to 10.6 to 1
NET POSITION TREND:
– Strength Index Score (3 Year Range Pct):71.933.125.6
– Strength Index Reading (3 Year Range):BullishBearishBearish
NET POSITION MOVEMENT INDEX:
– 6-Week Change in Strength Index:-8.37.81.3


SOYBEAN OIL Futures:

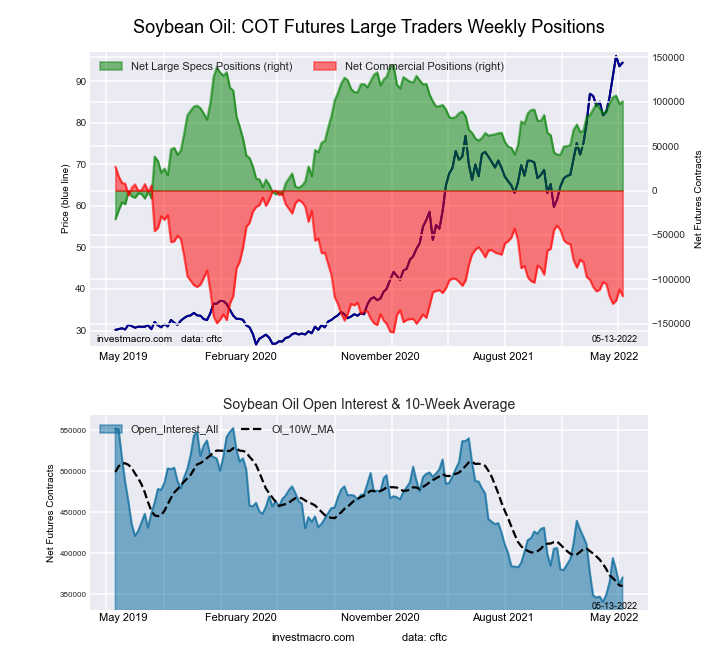
SOYBEAN OIL Futures COT ChartThe SOYBEAN OIL large speculator standing this week totaled a net position of 100,596 contracts in the data reported through Tuesday. This was a weekly lift of 3,305 contracts from the previous week which had a total of 97,291 net contracts.

This week’s current strength score (the trader positioning range over the past three years, measured from 0 to 100) shows the speculators are currently Bullish with a score of 76.6 percent. The commercials are Bearish with a score of 21.8 percent and the small traders (not shown in chart) are Bullish-Extreme with a score of 81.5 percent.

SOYBEAN OIL Futures StatisticsSPECULATORSCOMMERCIALSSMALL TRADERS
– Percent of Open Interest Longs:32.045.89.9
– Percent of Open Interest Shorts:4.877.95.0
– Net Position:100,596-118,83118,235
– Gross Longs:118,463169,76136,820
– Gross Shorts:17,867288,59218,585
– Long to Short Ratio:6.6 to 10.6 to 12.0 to 1
NET POSITION TREND:
– Strength Index Score (3 Year Range Pct):76.621.881.5
– Strength Index Reading (3 Year Range):BullishBearishBullish-Extreme
NET POSITION MOVEMENT INDEX:
– 6-Week Change in Strength Index:7.7-8.610.0


SOYBEAN MEAL Futures:

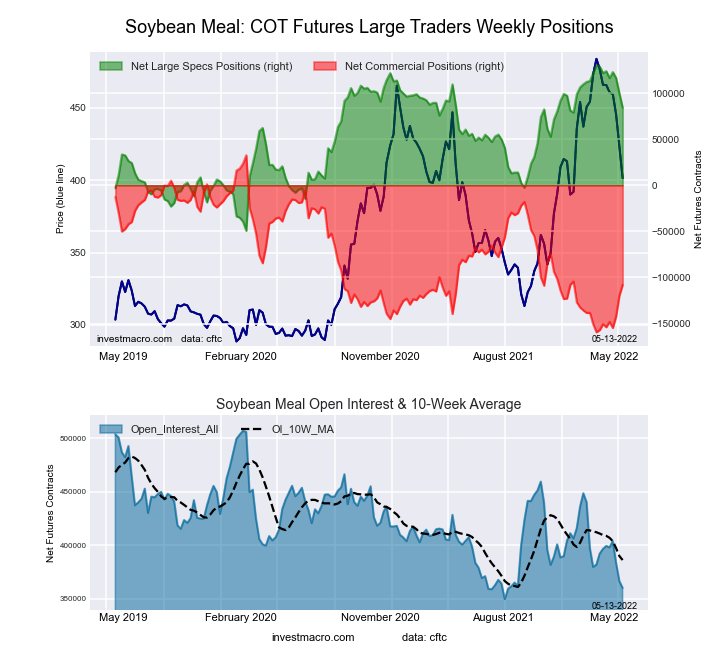
SOYBEAN MEAL Futures COT ChartThe SOYBEAN MEAL large speculator standing this week totaled a net position of 84,132 contracts in the data reported through Tuesday. This was a weekly reduction of -15,429 contracts from the previous week which had a total of 99,561 net contracts.

This week’s current strength score (the trader positioning range over the past three years, measured from 0 to 100) shows the speculators are currently Bullish with a score of 74.3 percent. The commercials are Bearish with a score of 26.8 percent and the small traders (not shown in chart) are Bullish with a score of 57.5 percent.

SOYBEAN MEAL Futures StatisticsSPECULATORSCOMMERCIALSSMALL TRADERS
– Percent of Open Interest Longs:30.747.112.5
– Percent of Open Interest Shorts:7.477.15.9
– Net Position:84,132-108,05923,927
– Gross Longs:110,648169,58345,065
– Gross Shorts:26,516277,64221,138
– Long to Short Ratio:4.2 to 10.6 to 12.1 to 1
NET POSITION TREND:
– Strength Index Score (3 Year Range Pct):74.326.857.5
– Strength Index Reading (3 Year Range):BullishBearishBullish
NET POSITION MOVEMENT INDEX:
– 6-Week Change in Strength Index:-21.022.2-25.5


LIVE CATTLE Futures:

The LIVE CATTLE large speculator standing this week totaled a net position of 39,803 contracts in the data reported through Tuesday. This was a weekly fall of -7,233 contracts from the previous week which had a total of 47,036 net contracts.

This week’s current strength score (the trader positioning range over the past three years, measured from 0 to 100) shows the speculators are currently Bearish with a score of 26.5 percent. The commercials are Bullish with a score of 66.7 percent and the small traders (not shown in chart) are Bullish with a score of 67.9 percent.

LIVE CATTLE Futures StatisticsSPECULATORSCOMMERCIALSSMALL TRADERS
– Percent of Open Interest Longs:36.038.110.8
– Percent of Open Interest Shorts:23.149.712.1
– Net Position:39,803-35,783-4,020
– Gross Longs:111,188117,50933,291
– Gross Shorts:71,385153,29237,311
– Long to Short Ratio:1.6 to 10.8 to 10.9 to 1
NET POSITION TREND:
– Strength Index Score (3 Year Range Pct):26.566.767.9
– Strength Index Reading (3 Year Range):BearishBullishBullish
NET POSITION MOVEMENT INDEX:
– 6-Week Change in Strength Index:-14.78.422.1


LEAN HOGS Futures:

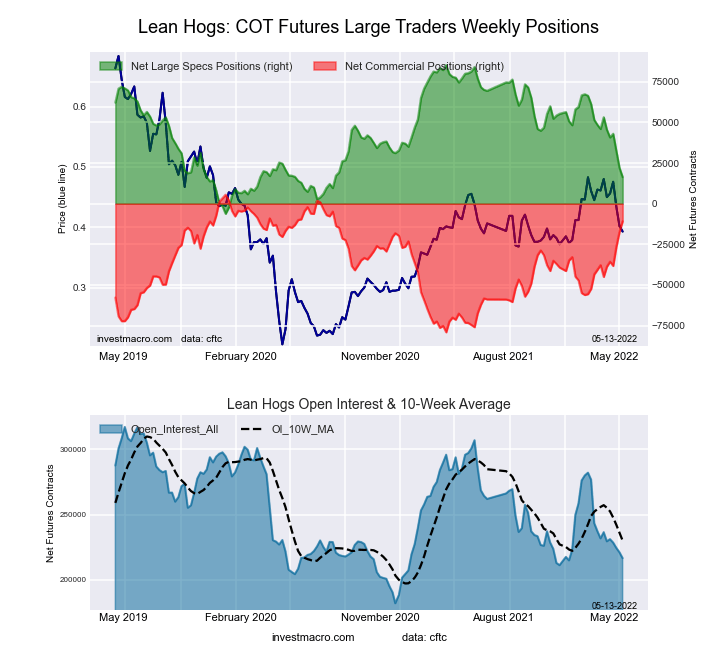
LEAN HOGS Futures COT ChartThe LEAN HOGS large speculator standing this week totaled a net position of 16,360 contracts in the data reported through Tuesday. This was a weekly reduction of -5,671 contracts from the previous week which had a total of 22,031 net contracts.

This week’s current strength score (the trader positioning range over the past three years, measured from 0 to 100) shows the speculators are currently Bearish with a score of 24.6 percent. The commercials are Bullish-Extreme with a score of 80.7 percent and the small traders (not shown in chart) are Bullish with a score of 67.8 percent.

LEAN HOGS Futures StatisticsSPECULATORSCOMMERCIALSSMALL TRADERS
– Percent of Open Interest Longs:30.738.010.2
– Percent of Open Interest Shorts:23.143.012.8
– Net Position:16,360-10,817-5,543
– Gross Longs:66,48382,35322,102
– Gross Shorts:50,12393,17027,645
– Long to Short Ratio:1.3 to 10.9 to 10.8 to 1
NET POSITION TREND:
– Strength Index Score (3 Year Range Pct):24.680.767.8
– Strength Index Reading (3 Year Range):BearishBullish-ExtremeBullish
NET POSITION MOVEMENT INDEX:
– 6-Week Change in Strength Index:-40.140.413.7


COTTON Futures:

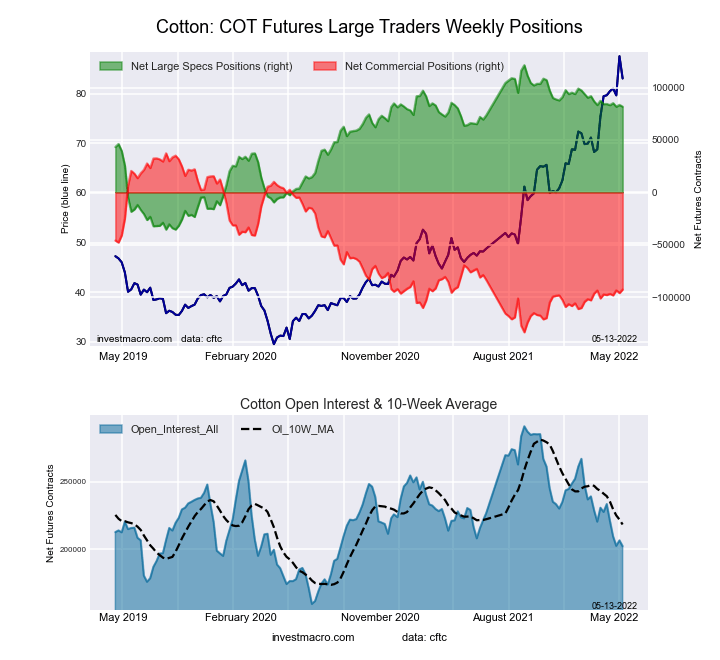
COTTON Futures COT ChartThe COTTON large speculator standing this week totaled a net position of 81,759 contracts in the data reported through Tuesday. This was a weekly decline of -1,674 contracts from the previous week which had a total of 83,433 net contracts.

This week’s current strength score (the trader positioning range over the past three years, measured from 0 to 100) shows the speculators are currently Bullish with a score of 74.8 percent. The commercials are Bearish with a score of 23.9 percent and the small traders (not shown in chart) are Bullish-Extreme with a score of 81.2 percent.

COTTON Futures StatisticsSPECULATORSCOMMERCIALSSMALL TRADERS
– Percent of Open Interest Longs:46.833.88.5
– Percent of Open Interest Shorts:6.379.63.1
– Net Position:81,759-92,60310,844
– Gross Longs:94,57968,25117,191
– Gross Shorts:12,820160,8546,347
– Long to Short Ratio:7.4 to 10.4 to 12.7 to 1
NET POSITION TREND:
– Strength Index Score (3 Year Range Pct):74.823.981.2
– Strength Index Reading (3 Year Range):BullishBearishBullish-Extreme
NET POSITION MOVEMENT INDEX:
– 6-Week Change in Strength Index:-1.52.7-14.1


COCOA Futures:

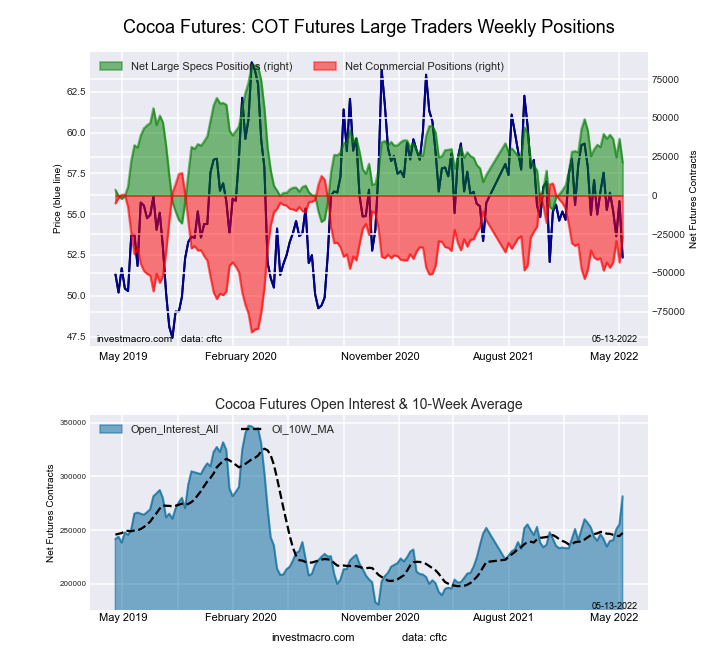
COCOA Futures COT ChartThe COCOA large speculator standing this week totaled a net position of 21,046 contracts in the data reported through Tuesday. This was a weekly decline of -15,513 contracts from the previous week which had a total of 36,559 net contracts.

This week’s current strength score (the trader positioning range over the past three years, measured from 0 to 100) shows the speculators are currently Bearish with a score of 38.3 percent. The commercials are Bullish with a score of 59.9 percent and the small traders (not shown in chart) are Bullish with a score of 53.8 percent.

COCOA Futures StatisticsSPECULATORSCOMMERCIALSSMALL TRADERS
– Percent of Open Interest Longs:31.044.16.1
– Percent of Open Interest Shorts:23.553.64.0
– Net Position:21,046-26,7705,724
– Gross Longs:87,140124,21617,042
– Gross Shorts:66,094150,98611,318
– Long to Short Ratio:1.3 to 10.8 to 11.5 to 1
NET POSITION TREND:
– Strength Index Score (3 Year Range Pct):38.359.953.8
– Strength Index Reading (3 Year Range):BearishBullishBullish
NET POSITION MOVEMENT INDEX:
– 6-Week Change in Strength Index:-18.321.1-30.6


WHEAT Futures:

The WHEAT large speculator standing this week totaled a net position of 21,686 contracts in the data reported through Tuesday. This was a weekly gain of 1,674 contracts from the previous week which had a total of 20,012 net contracts.

This week’s current strength score (the trader positioning range over the past three years, measured from 0 to 100) shows the speculators are currently Bearish with a score of 48.3 percent. The commercials are Bearish with a score of 34.4 percent and the small traders (not shown in chart) are Bullish-Extreme with a score of 92.3 percent.

WHEAT Futures StatisticsSPECULATORSCOMMERCIALSSMALL TRADERS
– Percent of Open Interest Longs:36.239.19.7
– Percent of Open Interest Shorts:29.144.910.9
– Net Position:21,686-17,779-3,907
– Gross Longs:111,546120,63129,835
– Gross Shorts:89,860138,41033,742
– Long to Short Ratio:1.2 to 10.9 to 10.9 to 1
NET POSITION TREND:
– Strength Index Score (3 Year Range Pct):48.334.492.3
– Strength Index Reading (3 Year Range):BearishBearishBullish-Extreme
NET POSITION MOVEMENT INDEX:
– 6-Week Change in Strength Index:10.4-11.91.2


Article By InvestMacroReceive our weekly COT Reports by Email

*COT Report: The COT data, released weekly to the public each Friday, is updated through the most recent Tuesday (data is 3 days old) and shows a quick view of how large speculators or non-commercials (for-profit traders) were positioned in the futures markets.

The CFTC categorizes trader positions according to commercial hedgers (traders who use futures contracts for hedging as part of the business), non-commercials (large traders who speculate to realize trading profits) and nonreportable traders (usually small traders/speculators) as well as their open interest (contracts open in the market at time of reporting).See CFTC criteria here.

Gold Suffers Its Fourth Straight Week Of Declines

By Ino.com

Editor’s Note: I will be speaking at an upcoming conference The Vancouver Resource Investment Conference in British Columbia on May 17 and 18. For more information please click the link above.

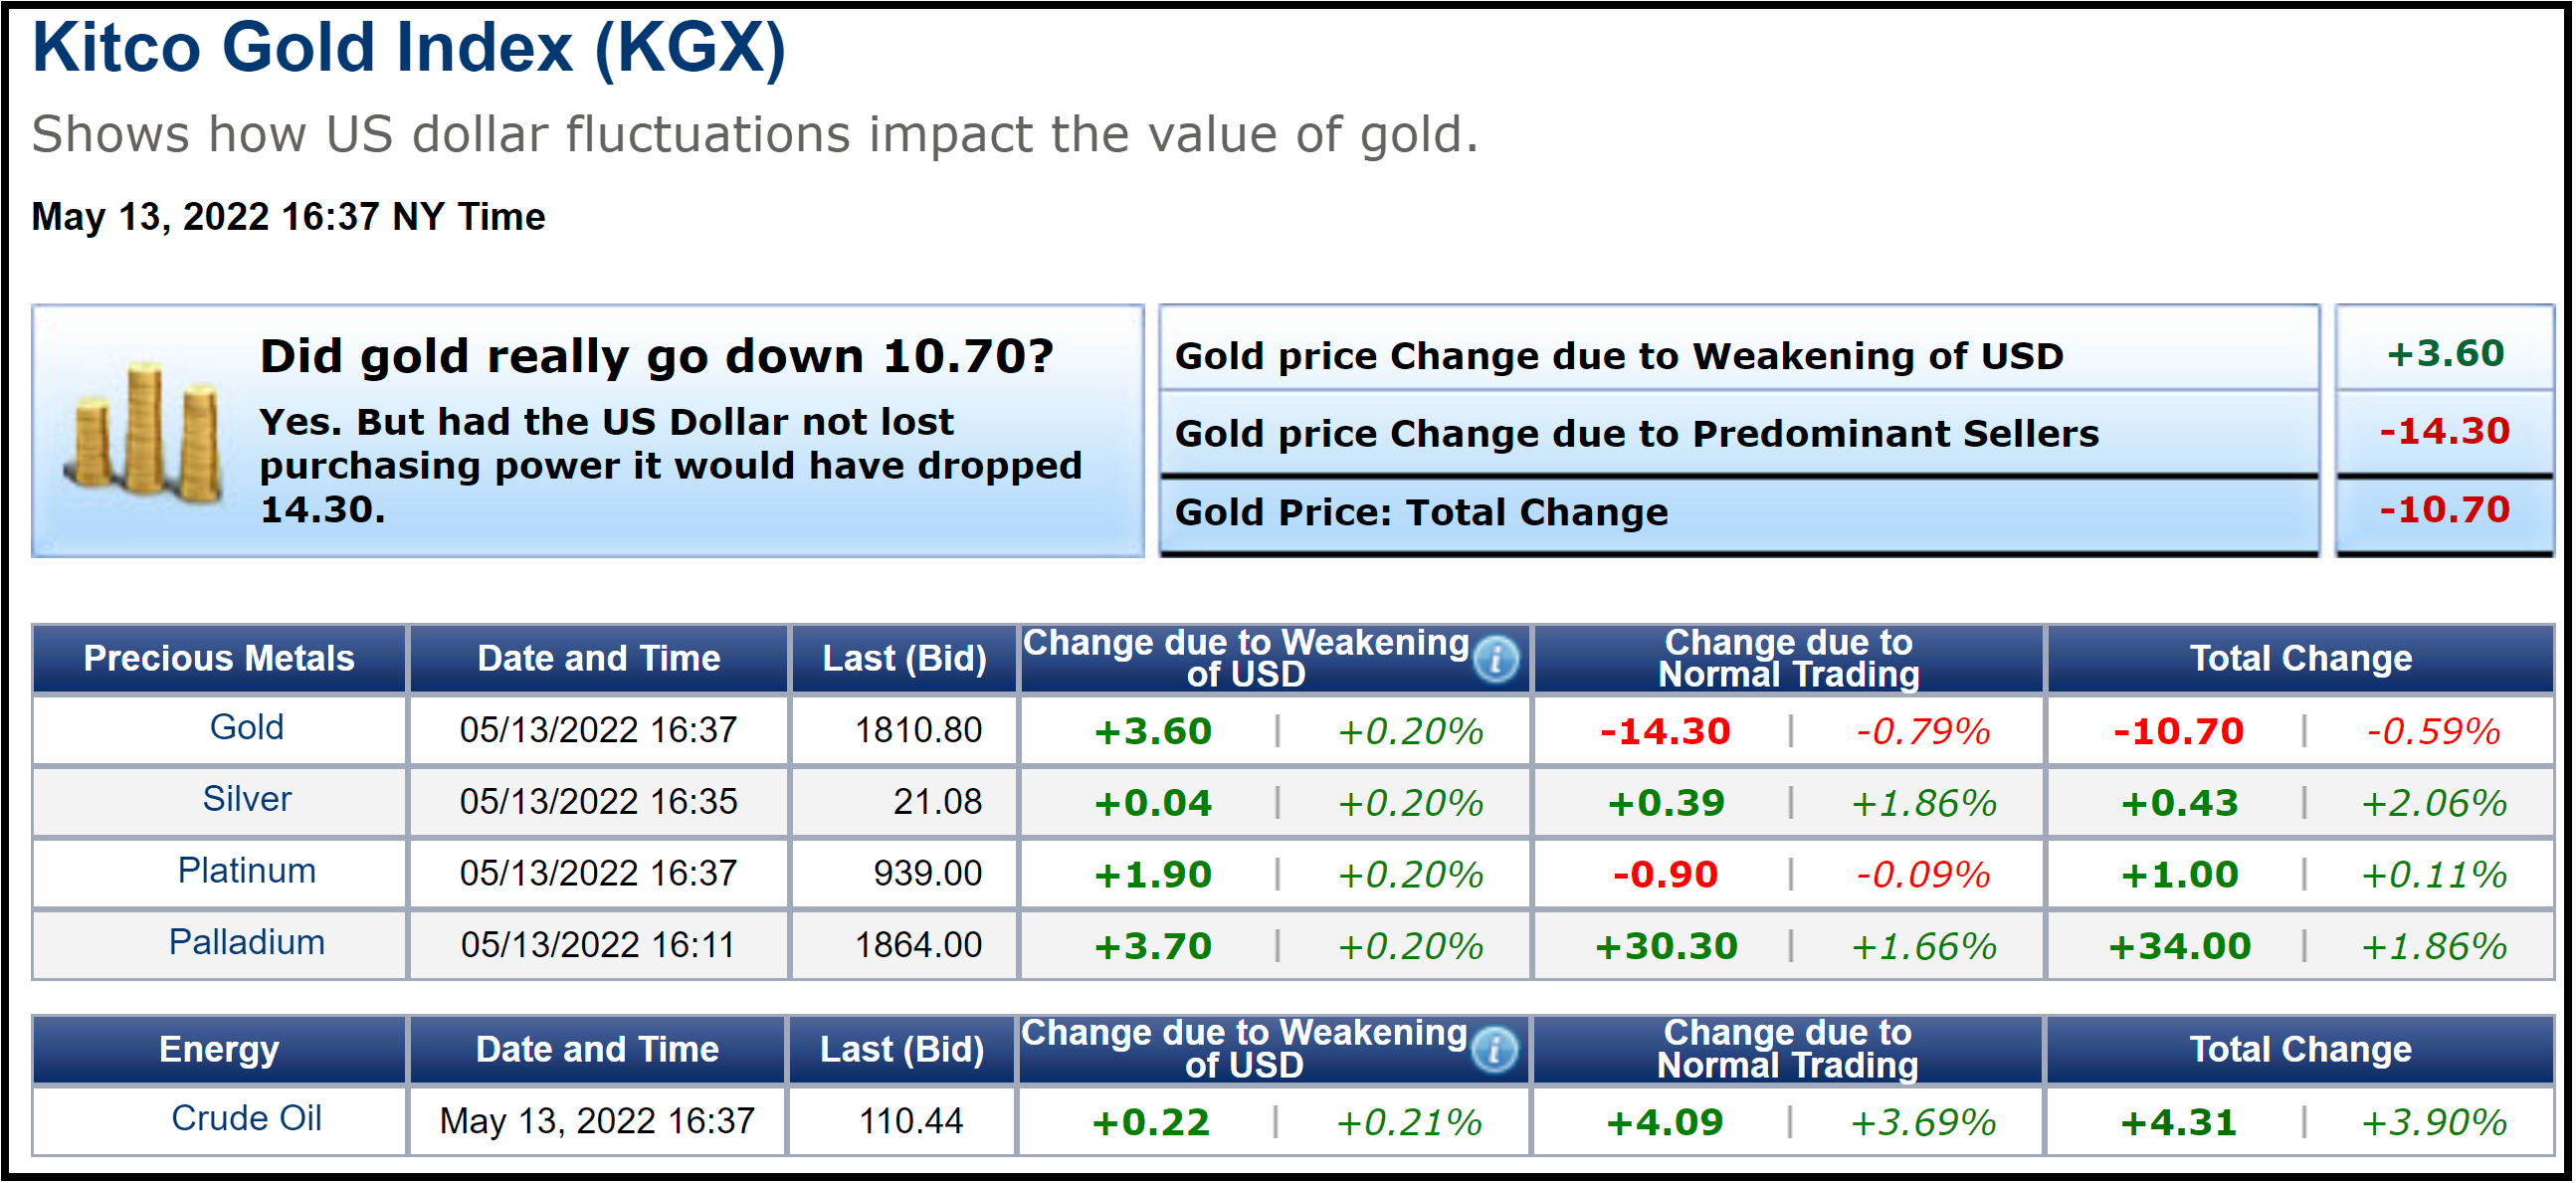
Gold opened at $1977 on Monday, April 18, and this would mark the beginning of four consecutive weekly declines. As of 5:10 PM EDT gold futures basis, the most active June 2022 Comex contract is fixed at $1810.30 after factoring in today’s decline of $14.30 or 0.78%. Today’s decline in gold occurred without the benefit of dollar strength. The dollar index declined by 0.36% and is currently fixed at 104.515

Kitco Gold Index (KGX)

The image above is a screen-print of the KGX (Kitco Gold Index) which was taken at 4:37 PM EDT. At that time spot gold was fixed at $1810.80 after factoring in a decline of $10.70. Market participants were active sellers resulting in a $14.30 price decline. Dollar weakness provided mild tailwinds adding $3.60 (+0.20%) in value.

The decline this week was the strongest percentage drawdown of the four weeks losing 3.87%. Considering that over the last four weeks gold’s value has decreased by 8.44%, almost half of that decline occurred this week. This correction devalued the price of gold by $167 per ounce, with $73 of that decline occurring this week.

Gold Update - DX Weekly Chart

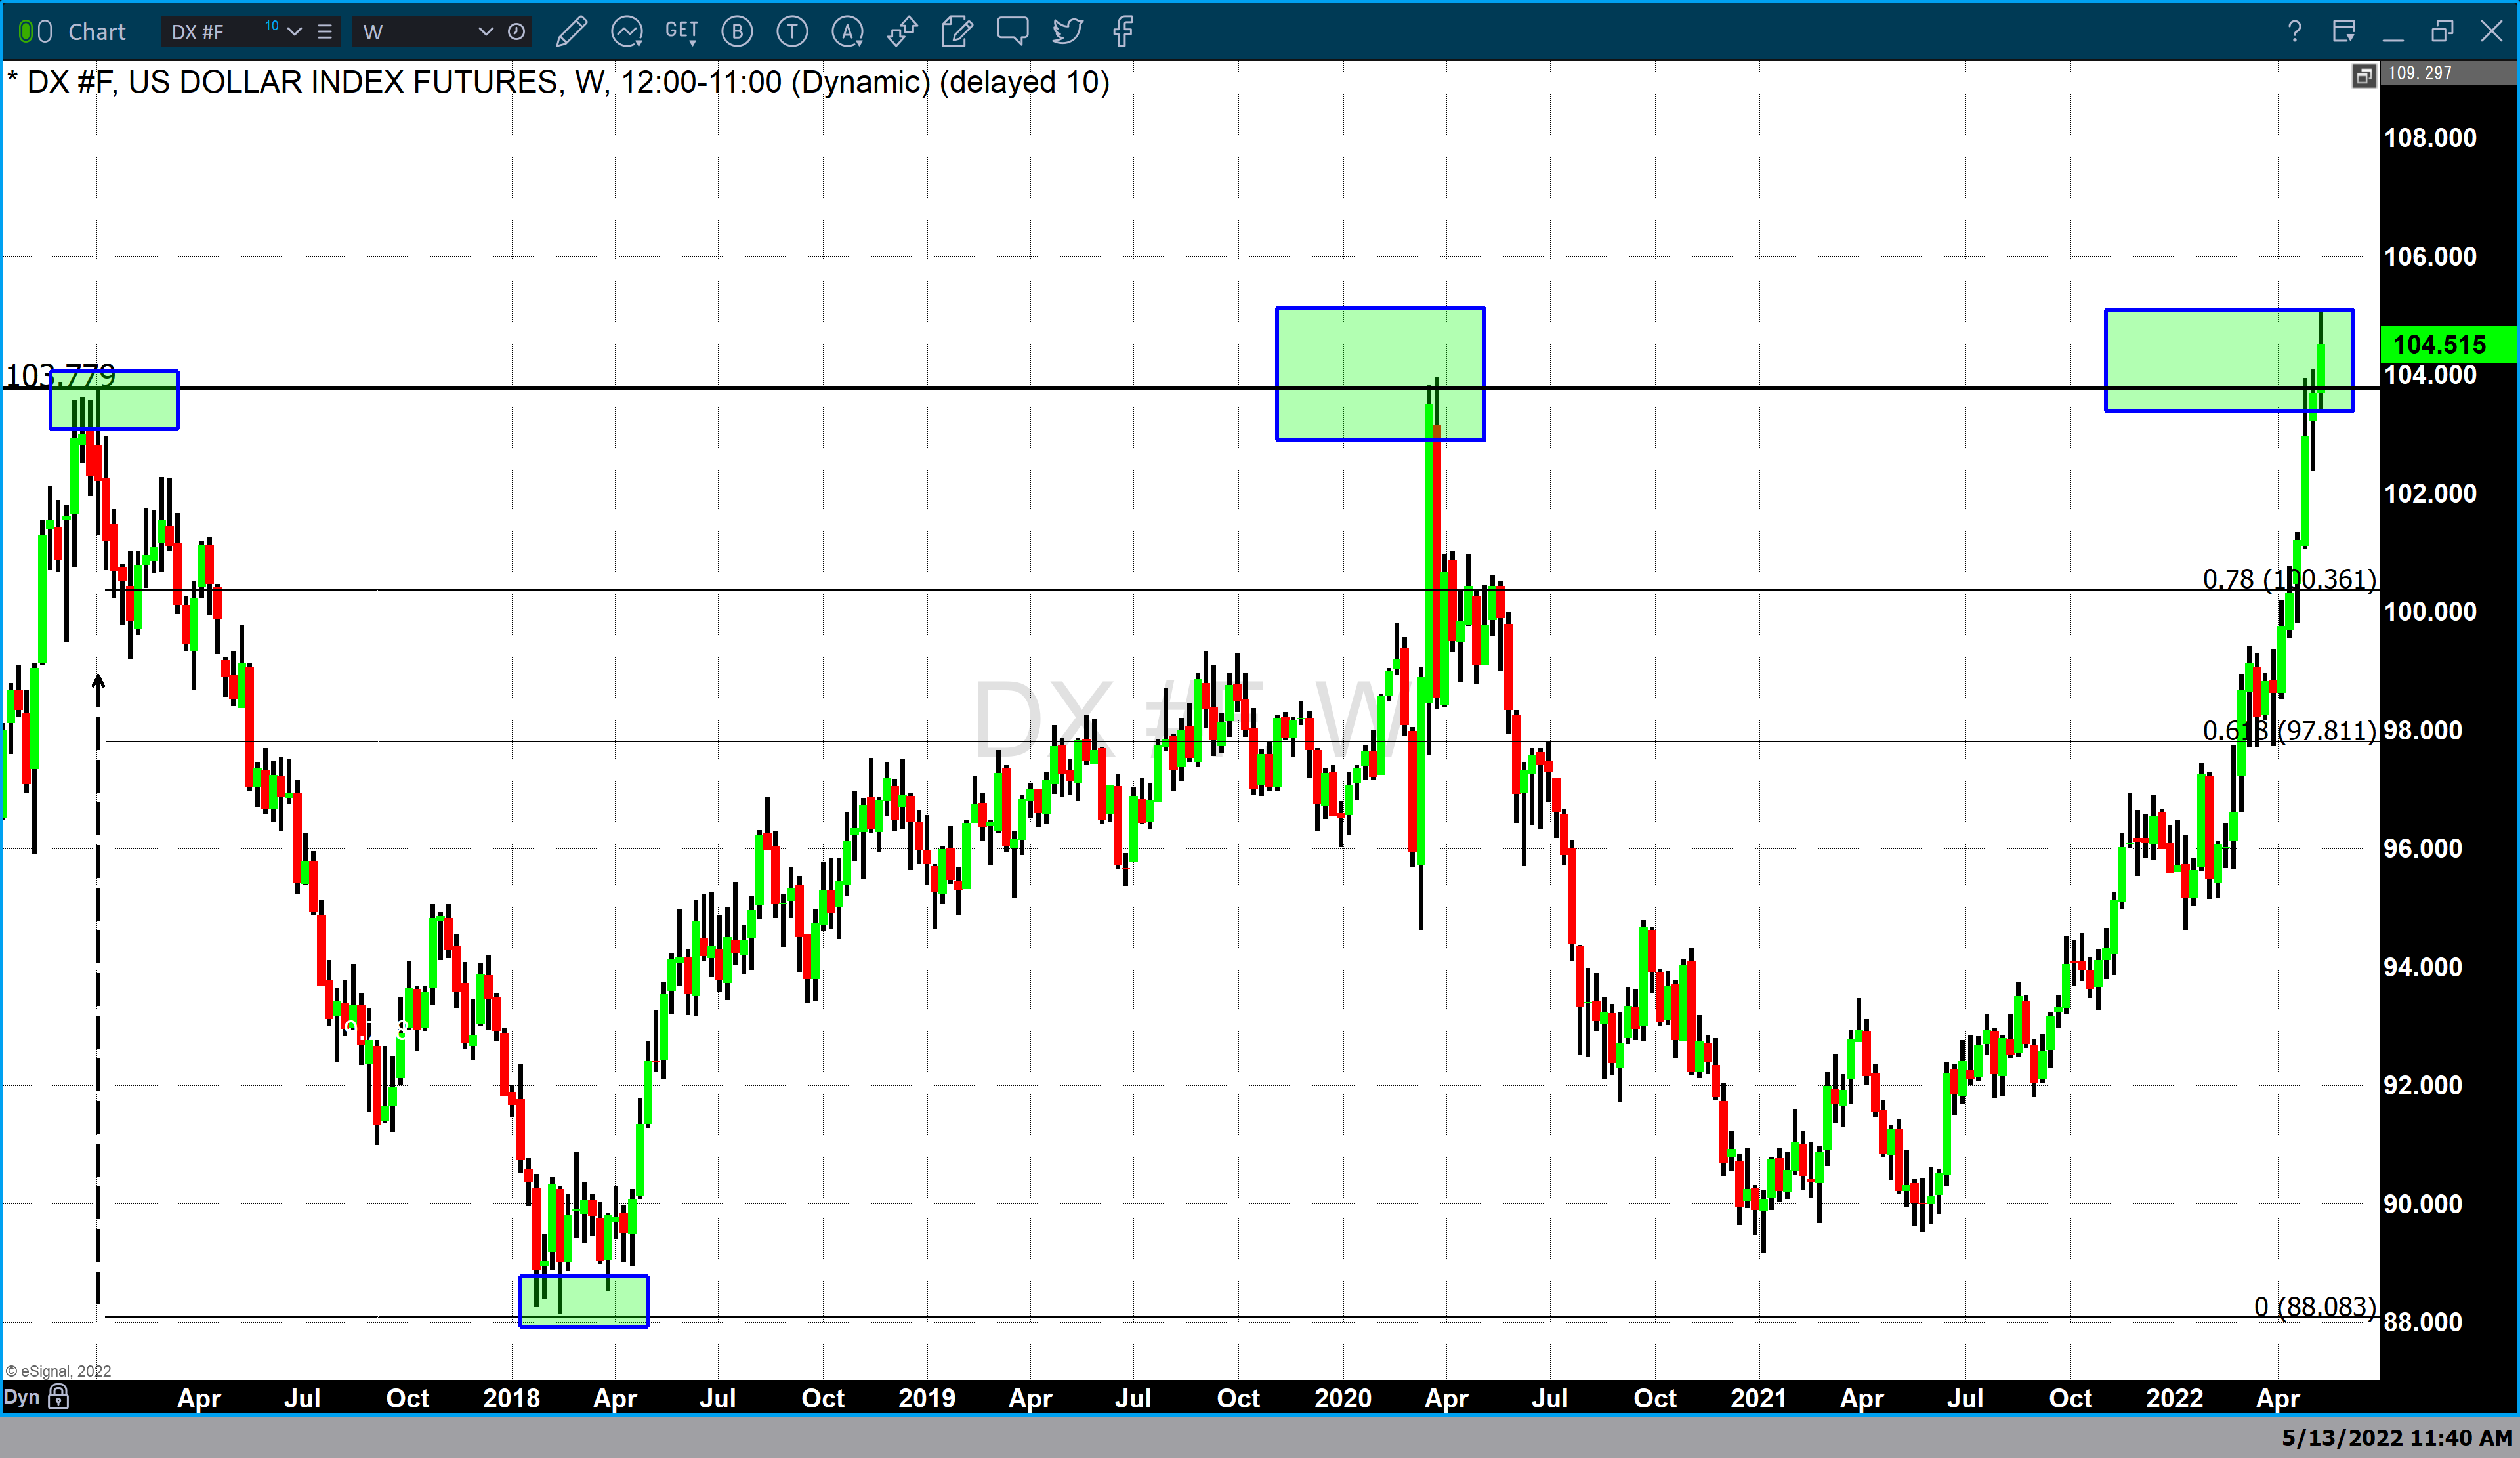
Over the last four weeks, a major factor pressuring gold prices lower has been dollar strength. The dollar has gained value for the last six consecutive weeks. Over the last four trading weeks, the U.S. dollar has gained 4.15% in value. This means that dollar strength accounted for just under one-half of gold’s price decline.

Gold Update - DX Bi-Monthly Chart

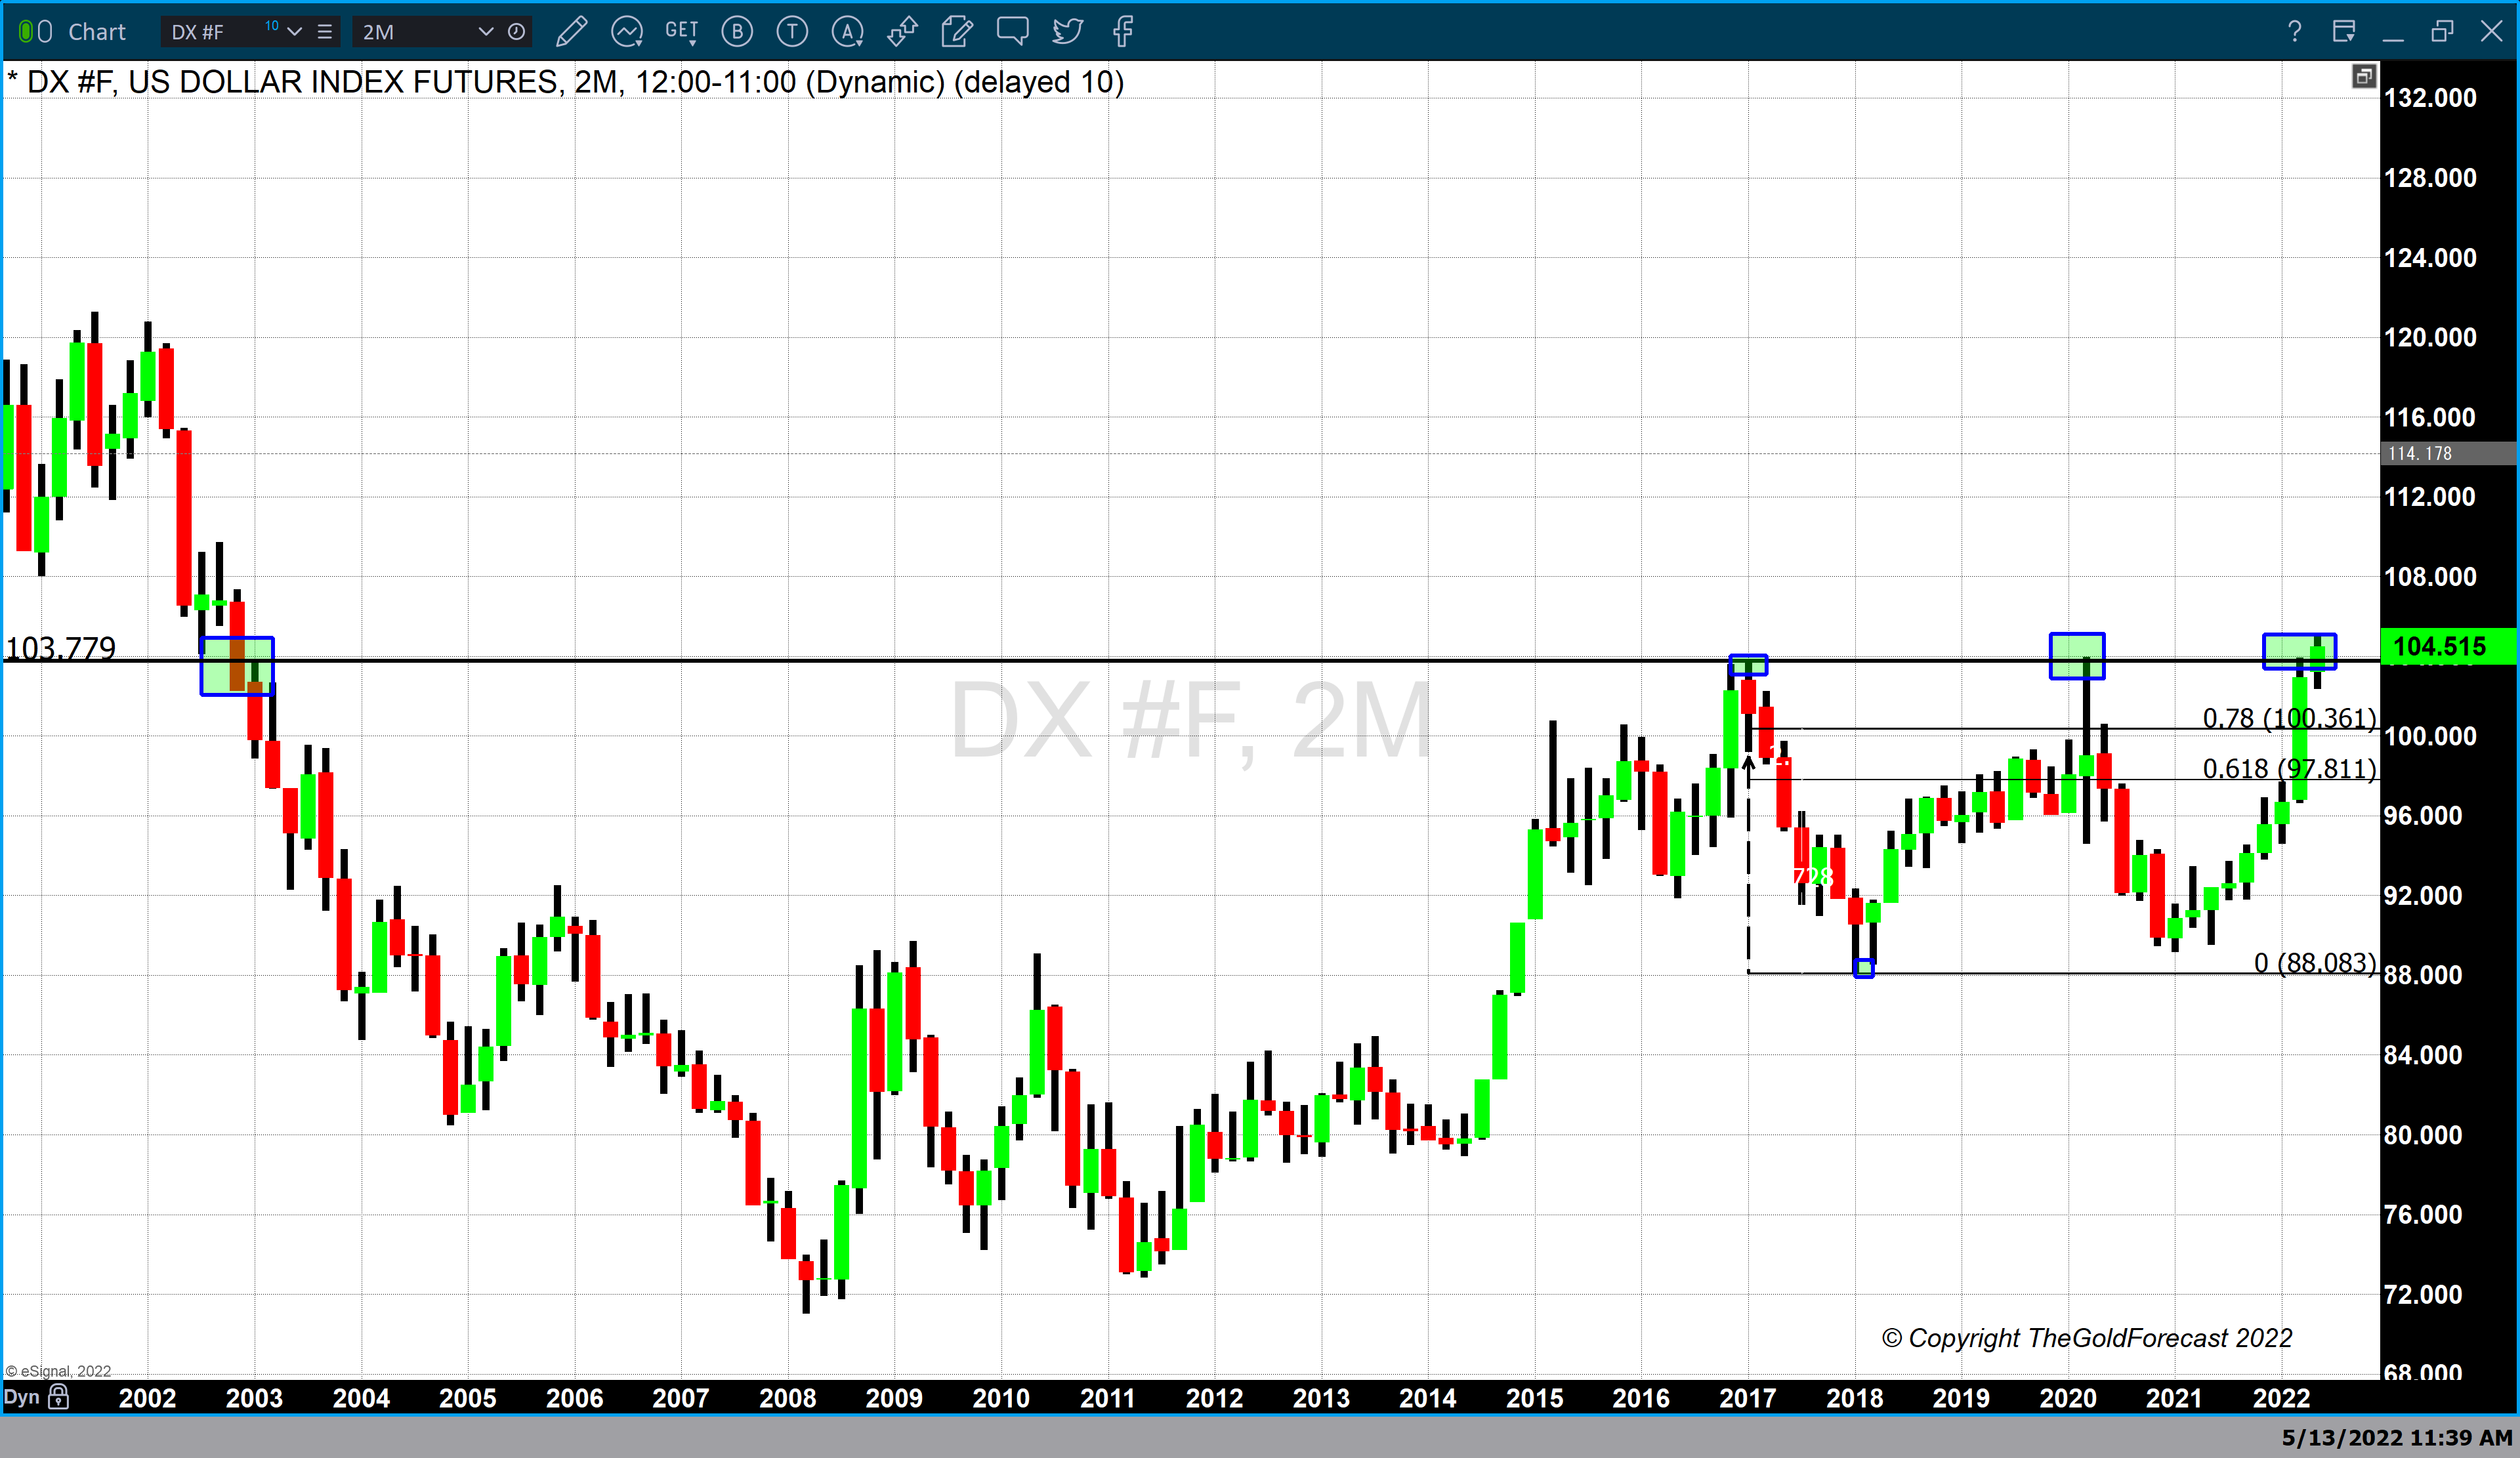
The dollar has been trading in a defined range since the beginning of 2017. In January 2017 the dollar index opened at 102.80 and traded to a high of 103. 78 becoming the first instance of dollar strength at this level since 2003. Since 2017 the dollar index has traded to this level on three occasions.

Both the 2017 top as well as the second instance which occurred in March 2020 created a double top. In both instances, dollar strength peaked at these levels resulting in a price correction that followed these tops. This month the dollar not only challenged the highs created during the double top but effectively closed above them on a daily, weekly, and monthly chart.

The dollar index declined today by – 0.36%. However, the dollar had a strong weekly gain. Currently, the dollar index is fixed at 104.515 and the last time the dollar was this strong was the fourth quarter of 2002.

Yesterday I addressed that recent price changes in the dollar and gold have been headlined driven based upon fundamental events. Because technical studies by nature are lagging indicators there is an inherent disconnect. I was blessed to be mentored by two great market technicians one being Larry Williams. He told me a story that illustrated the shortcoming of only using technical indicators.

To paraphrase: A market technician is analogous to someone standing at the stern of a boat and using the wake from the propeller to indicate the direction the ship was headed. While it indicated where the boat had been, only the captain knows when he will turn the wheel.

In this instance, the Federal Reserve is at the helm attempting to steer the ship through a storm brought on by rampant inflation

For those who would like more information simply use this link.

Wishing you, as always good trading,
Gary S. Wagner
The Gold Forecast

By Ino.com – See our Trader Blog, INO TV Free & Market Analysis Alerts

Source: Gold Suffers Its Fourth Straight Week Of Declines


Stock Markets: “What Happens When the Dip Keeps Dipping?”

These can “work tirelessly to keep investors trapped on the wrong side of a bearish trend”

By Elliott Wave International

It’s been a rocky road for the Dow and the S&P 500 index since the start of the year. And, even longer for the NASDAQ, which topped back in November.

Indeed, speaking of technology stocks, some of the most popular names took a big beating in April alone. As the Wall Street Journal noted (April 29):

The FAANG stocks, consisting of the popular quintet of Facebook parent Meta Platforms, Apple, Amazon.com, Netflix and Google parent Alphabet, have collectively lost more than $1 trillion in market value [in April], the most since Facebook started trading in May 2012.

So, you might think that this bumpy ride in the stock market would have many investors at least considering moving to the sidelines, especially those with a sizeable nest egg to protect.

Well, according to a UBS Investor Sentiment survey of millionaire investors — conducted between April 5 and April 18 — most of those surveyed plan to stick with stocks.

Here’s a May 4 CNBC headline:

More wealthy investors would rather hold or add stocks than sell if markets keep sliding, survey says

Granted, this survey was taken before some of the roughest trading days in April. Still, it shows a recent willingness by even the “cream of the crop” in society to “buy the dip.”

No doubt, that same lingering bullishness has persisted in other nations too.

With that in mind, the April Global Market Perspective, a monthly Elliott Wave International publication which provides analysis of 50-plus worldwide financial markets, provided an object lesson in buying the dip, using past bear markets in Germany’s DAX as examples:

[These two graphs illustrate] the multi-week and multi-month rallies that work tirelessly to keep investors trapped on the wrong side of a bearish trend. The left graph depicts every plus-10% rally from March 2000 to March 2003, a three-year span that saw the DAX drop by 74%. The right graph illustrates the bear market from July 2007 to March 2009, which saw seven rallies of 10% or more.

So, “buying the dip” can be a financially dangerous strategy.

In our view, it’s best to consult a financial market’s Elliott wave structure before making a decision about your portfolio.

If you’d like to learn how the Elliott wave model can help you analyze financial markets, you are encouraged to read Frost & Prechter’s Wall Street classic, Elliott Wave Principle: Key to Market Behavior. Here’s a quote from the book:

“When you have eliminated the impossible, whatever remains, however improbable, must be the truth.” Thus eloquently spoke Sherlock Holmes to his constant companion, Dr. Watson, in Arthur Conan Doyle’s The Sign of Four. This advice is a capsule summary of what you need to know to be successful with Elliott. The best approach is deductive reasoning. By knowing what Elliott rules will not allow, you can deduce that whatever remains is the proper perspective, no matter how improbable it may seem otherwise. By applying all the rules of extensions, alternation, overlapping, channeling, volume and the rest, you have a much more formidable arsenal than you might imagine at first glance. Unfortunately for many, the approach requires thought and work and rarely provides a mechanical signal. However, this kind of thinking, basically an elimination process, squeezes the best out of what Elliott has to offer and besides, it’s fun! We sincerely urge you to give it a try.

You can read the entire online version of Elliott Wave Principle: Key to Market Behavior for free once you become a Club EWI member!

Club EWI is the world’s largest Elliott wave educational community and is free to join. Members enjoy free access to a wealth of Elliott wave resources on investing and trading.

Get started by following this link: Elliott Wave Principle: Key to Market Behavior — free, unlimited and instant access now.

This article was syndicated by Elliott Wave International and was originally published under the headline Stock Markets: “What Happens When the Dip Keeps Dipping?”. EWI is the world’s largest market forecasting firm. Its staff of full-time analysts led by Chartered Market Technician Robert Prechter provides 24-hour-a-day market analysis to institutional and private investors around the world.

What are stablecoins? A blockchain expert explains

By Stephen McKeon, University of Oregon 

Stablecoins are a type of cryptocurrency linked to an asset like the U.S. dollar that doesn’t change much in value.

The majority of the dozens of stablecoins that currently exist use the dollar as their benchmark asset, but many are also pegged to other fiat currencies issued by governments like the euro and yen. As a result, the price of stablecoins is meant to fluctuate very little, unlike high-profile cryptocurrencies like bitcoin and ethereum that are prone to sudden ups and downs.

The first stablecoin, created in 2014, was Tether, which many other stablecoins are modeled after. Users receive one token for every dollar they deposit. In theory, the tokens can then be converted back into the original currency at any time, also at a one-for-one exchange rate.

As of May 11, 2022, there were about US$83 billion in Tether outstanding, or a bit less than half of the $172 billion market capitalization of all stablecoins worldwide. The next-largest is known as USD Coin, which has a market cap of about $49 billion.

Why stablecoins matter

Originally, stablecoins were primarily used to buy other cryptocurrencies, like bitcoin, because many cryptocurrency exchanges didn’t have access to traditional banking. They are more useful than country-issued currencies because you can use them 24 hours a day, seven days a week, anywhere in the world – without relying on banks. Money transfers take seconds to complete.

Another useful feature of stablecoins is that they can work with so-called smart contracts on blockchains, which, unlike conventional contracts, require no legal authority to be executed. The code in the software automatically dictates the terms of the agreement and how and when money will be transferred. This makes stablecoins programmable in ways that dollars can’t be.

Smart contracts have given rise to the use of stablecoins not only in seamless trading but also lending, payments, insurance, prediction markets and decentralized autonomous organizations – businesses that operate with limited human intervention.

Collectively, these software-based financial services are known as decentralized finance, or DeFi.

Proponents hold that moving money via stablecoins is faster, cheaper and easier to integrate into software compared with fiat currency.

Others say the lack of regulation creates big risks for the financial system. In a recent paper, economists Gary B. Gorton and Jeffery Zhang draw an analogy to the middle of the 19th century era when banks issued their own private currencies. They say stablecoins could lead to the same problems observed in that era, when there were frequent runs because people couldn’t agree on the value of privately issued currencies.

A reminder of those risks came in May 2022 as a so-called algorithmic stablecoin known as TerraUSD, or UST, plunged in value. Algorithmic stablecoins use a complex system of burning, or creating tokens for profit, to maintain their peg.

As a result of these issues, regulators have taken greater interest in them recently.

About the Author:

The Conversation U.S. publishes short, accessible explanations of newsworthy subjects by academics in their areas of expertise.

This article was updated to add reference to UST and algorithmic stablecoins on May 11, 2022.The Conversation

Stephen McKeon, Associate Professor of Finance, University of Oregon

This article is republished from The Conversation under a Creative Commons license. Read the original article.