
By Orbex
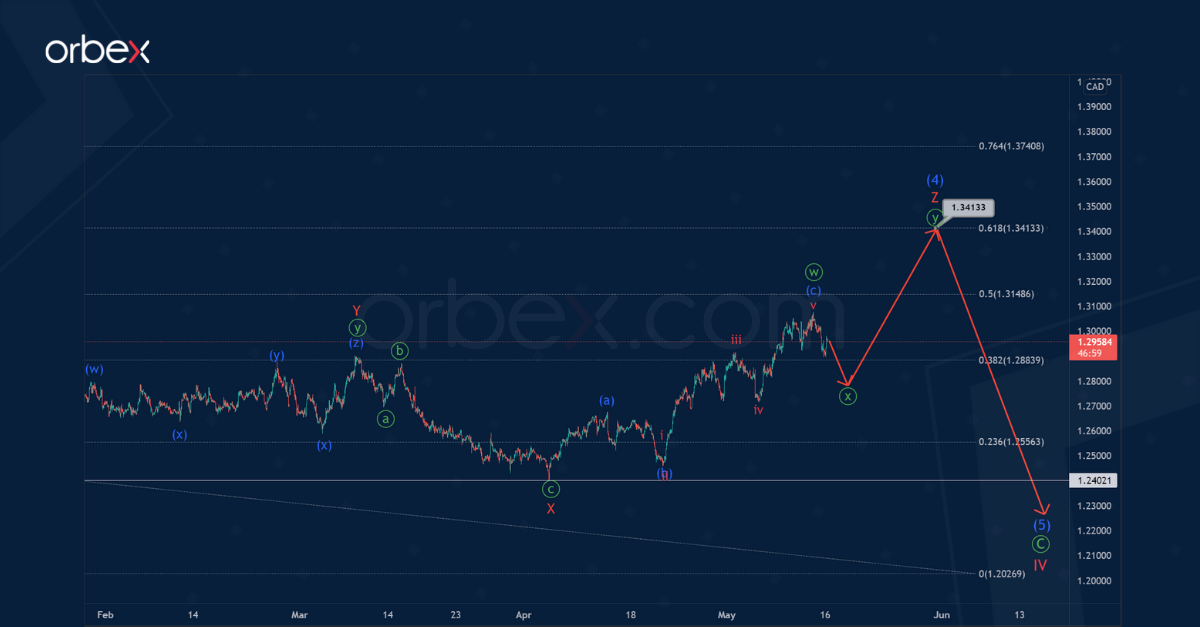
The USDCAD structure indicates the construction of a large correction wave IV. This is part of a global cycle impulse and consists of sub-waves Ⓐ-Ⓑ-Ⓒ.
On the current chart, we see the final part of the primary impulse wave Ⓒ. Wave Ⓒ consists of intermediate sub-waves (1)-(2)-(3)-(4)-(5). A deep intermediate correction (4) is currently under development. This could take the form of a minor triple zigzag W-X-Y-X-Z.
In the near future, prices should rise in the last minor sub-wave Z. It is most likely to be a minute double zigzag, and will end its pattern near 1.341.
At that price level, correction (4) will be at 61.8% of previous impulse wave (3).
Free Reports:
 Get our Weekly Commitment of Traders Reports - See where the biggest traders (Hedge Funds and Commercial Hedgers) are positioned in the futures markets on a weekly basis.
 Download Our Metatrader 4 Indicators – Put Our Free MetaTrader 4 Custom Indicators on your charts when you join our Weekly Newsletter

According to the second option, the formation of the intermediate correction (4) has already been fully completed. In this scenario, it has the form not of a triple, but of a double zigzag W-X-Y.
Thus, in the last section of the chart, we see the development of the initial part of the intermediate wave (5). This can take the form of a minor impulse 1-2-3-4-5.
A price decline in the sub-waves 1-2-3-4-5 is then likely, and the entire intermediate wave (5) is likely to end near 1.195.
At the level of 1.195, impulse (5) will be at the 50% Fibonacci extension of intermediate impulse (3).
 Article by Orbex
Orbex is a fully licensed broker that was established in 2011. Founded with a mission to serve its traders responsibly and provides traders with access to the world’s largest and most liquid financial markets. www.orbex.com

- GBP/USD Starts the Week on a Strong Footing Aug 10, 2026
- The US stock indices finished the session with solid gains following the release of weak labor‑market data Aug 10, 2026
- COT Metals Charts: Speculator Bets led by Gold, Copper & Platinum Aug 9, 2026
- COT Bonds Charts: Speculator Bets led by 2-Year Bonds & US Treasury Bonds Aug 9, 2026
- COT Energy Charts: Speculator Bets led by Heating Oil & Bloomberg Index Aug 9, 2026
- COT Soft Commodities Charts: Speculator Bets led by Sugar & Cotton Aug 9, 2026
- The Central Bank of Mexico kept its interest rate unchanged. Iran plans to introduce strict bans for US and Israeli vessels in the Strait of Hormuz Aug 7, 2026
- USD/JPY Holds Firm: Yen Loses Some Support Aug 7, 2026
- Australian trade balance returned to positive territory Aug 6, 2026
- Results in Line for Most Reporting Companies Aug 5, 2026
