Week Ahead: Sterling to sink to greater depths?

By ForexTime

The market adage “Sell in May and go away” has certainly rung true in 2022.

The selloff across bonds, stocks, and even cryptos has taken a steeper dive so far this month, amid worries that central bank rate hikes could choke the global economy.

Investors and traders worldwide will be scouring the following economic data and events in the coming week, looking for reasons as to whether the selloff should be extended or perhaps take a breather:

Monday, May 16

  • JPY: Japan April PPI
  • CNH: China April industrial production, retail sales, property sales, and unemployment rate
  • EUR: EU Commission releases Spring economic forecasts
  • USD: New York Fed President John Williams speech

Tuesday, May 17

  • AUD: RBA releases May policy meeting minutes
  • GBP: UK March unemployment and April jobless claims
  • EUR: Eurozone 1Q GDP and employment
  • USD: US April retail sales and industrial production
  • USD: Fed speak
    • Fed Chair Jerome Powell
    • Chicago Fed President Charles Evans
    • Cleveland Fed President Loretta Mester
    • Philadelphia Fed President Patrick Harker
    • St. Louis Fed President James Bullard
  • Q1 earnings: Walmart, Home Depot, Vodafone, JD.com

Wednesday, May 18

  • JPY: Japan 1Q GDP
  • GBP: UK April CPI and PPI, BOE MPC member Catherine Mann speech
  • US crude: EIA weekly US crude inventories
  • CAD: Canada April CPI
  • USD: Philadelphia Fed President Patrick Harker speech
  • Q1 earnings: Tencent, Target

Thursday, May 19

  • JPY: Japan April external trade
  • AUD: Australia April unemployment
  • ZAR: South Africa Reserve Bank rate decision
  • EUR: ECB publishes April meeting accounts
  • USD: US weekly initial jobless claims
  • Xiaomi Q1 earnings

Friday, May 20

  • JPY: Japan April CPI
  • GBP: UK April retail sales, May consumer confidence
  • EUR: Eurozone May consumer confidence

The GBP index, which measures Sterling’s performance against six of its G10 peers in equal weights, is trading around its lowest levels since December 2020.

This index could return to recent lows if the coming week’s data on jobs, inflation, retail sales, and consumer confidence point to more economic woes.

After all, the Bank of England recently highlighted the risk of a recession by year-end.

Darker clouds over the UK economic outlook should keep the GBP index firmly entrenched in the downtrend that has persisted since February, potentially sending this index back towards the 1.47 mark.


The growing downside risks to the UK economy, which are expected to narrow the window of opportunity for further BOE rate hikes, have allowed most of Sterling’s G10 peers to maintain a year-to-date advance against the Pound.


Even the beleaguered euro has seized the opportunity to break out of its downtrend against GBP that had been in place since September 2020.

Last week, EURGBP secured a weekly close above its 50-week simple moving average for the first time since January 2021.


And with King Dollar reigning supreme across the FX universe, GBPUSD has been sent to its weakest levels since November 2020.


We may see even more US dollar strength in the coming week if the scheduled Fed speak does little to douse the prospects of a 75-basis point US rate hike over the summer months.

Such perceived signals for an ultra-hawkish Fed, coupled with dismal data out of the other side of the Atlantic, should heap more downward pressure on GBPUSD and potentially drag ‘cable’ closer to the psychologically-important 1.20 line.

Although GBPUSD’s 14-day relative strength index has broken below the 30 threshold that denotes oversold conditions, any recovery should prove fleeting, as long as the UK economic data suggests that a recession is inevitable and binds the BOE’s hawkish hands, all while the Fed presses ahead with rate hikes galore.


READ MORE: Dovish BOE sends GBPUSD to lowest since mid-2020


Forex-Time-LogoArticle by ForexTime

ForexTime Ltd (FXTM) is an award winning international online forex broker regulated by CySEC 185/12 www.forextime.com

Ichimoku Cloud Analysis 13.05.2022 (GBPUSD, XAUUSD, NZDUSD)

Article By RoboForex.com

GBPUSD, “Great Britain Pound vs US Dollar”

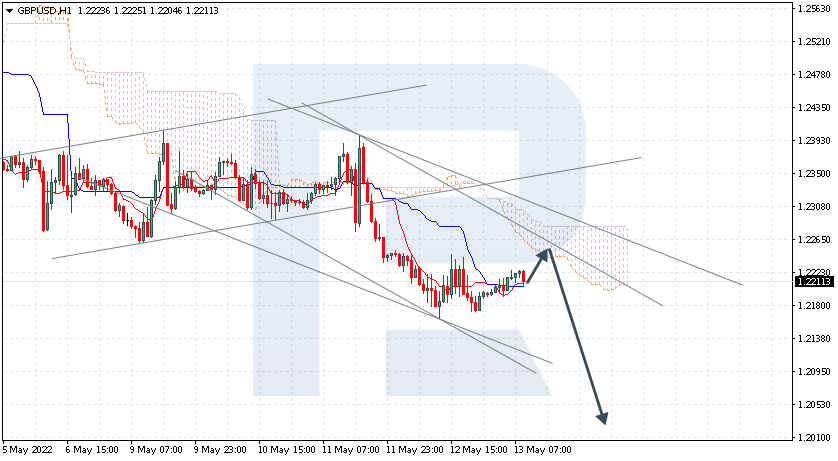
GBPUSD is testing Tenkan-Sen and Kijun-Sen. The instrument is currently moving below Ichimoku Cloud, thus indicating a descending tendency. The markets could indicate that the price may test the cloud’s downside border at 1.2245 and then resume moving downwards to reach 1.2035 Another signal in favour of a further downtrend will be a rebound from the descending channel’s upside border. However, the bearish scenario may no longer be valid if the price breaks the cloud’s upside border and fixes above 1.2315. In this case, the pair may continue growing towards 1.2405.

GBPUSD
Risk Warning: the result of previous trading operations do not guarantee the same results in the future

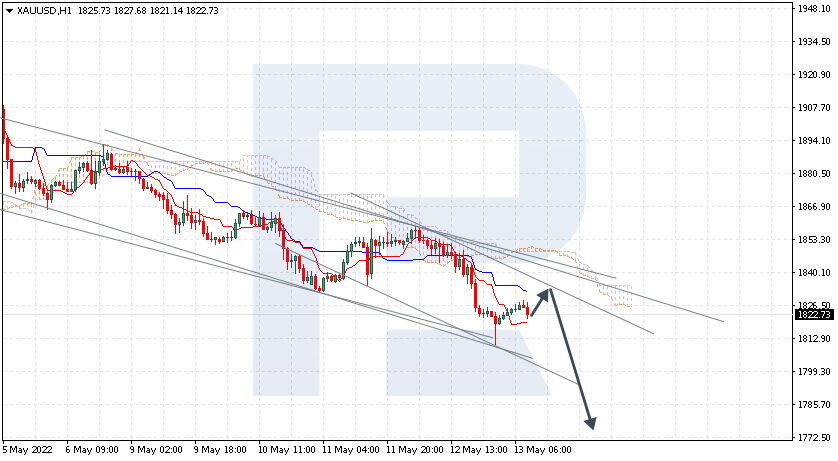
XAUUSD, “Gold vs US Dollar”

XAUUSD is rebounding from the resistance level. The instrument is currently moving below Ichimoku Cloud, thus indicating a descending tendency. The markets could indicate that the price may test Kijun-Sen at 1825.00 and then resume moving downwards to reach 1775.00. Another signal in favour of a further downtrend will be a rebound from the descending channel’s upside border. However, the bearish scenario may no longer be valid if the price breaks the cloud’s upside border and fixes above 1855.00. In this case, the pair may continue growing towards 1905.00.

XAUUSD
Risk Warning: the result of previous trading operations do not guarantee the same results in the future

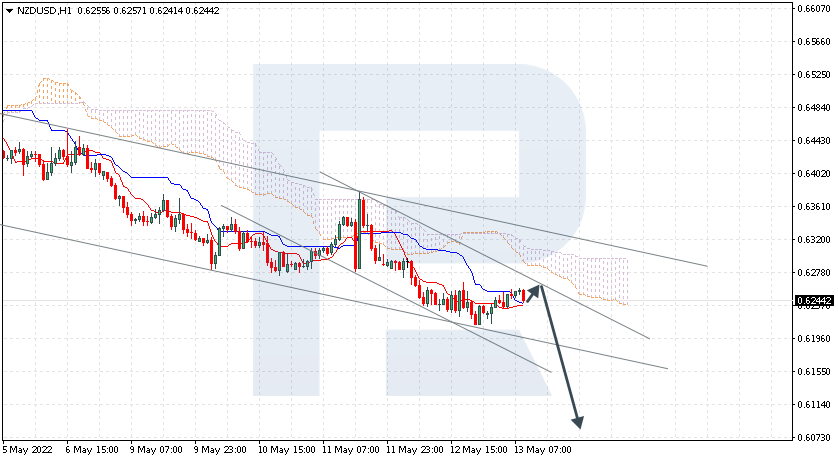
NZDUSD, “New Zealand Dollar vs US Dollar”

NZDUSD has fixed above Kijun-Sen. The instrument is currently moving below Ichimoku Cloud, thus indicating a descending tendency. The markets could indicate that the price may test the cloud’s downside border at 0.6250 and then resume moving downwards to reach 0.6085. Another signal in favour of a further downtrend will be a rebound from the resistance level. However, the bearish scenario may no longer be valid if the price breaks the cloud’s upside border and fixes above 0.6335. In this case, the pair may continue growing towards 0.6435.

NZDUSD

Article By RoboForex.com

Attention!
Forecasts presented in this section only reflect the author’s private opinion and should not be considered as guidance for trading. RoboForex LP bears no responsibility for trading results based on trading recommendations described in these analytical reviews.

The cryptocurrency market digest (BTC, LUNA). Overview for 13.05.2022

Article By RoboForex.com

It seems like the worst expectations for the BTC are coming true. Yesterday, the major crypto asset dropped to $25,401. Right now, it is trading around $30,629.

The technical picture remains the same: the asset may plummet to $20,000 unless it is able to fix between $29,000 and $30,000. The next bearish target is at $8,700 and then $5,000. In this light, there is no sense to draw comparisons between the crypto sector and the US stock market. Both are plunging.

Coinbase: a common area of responsibility

Coinbase attracted a lot of attention this week. The company released its quarterly report and announced amendments to the User agreement. According to the new draft, all users of the crypto exchange are now its loaners. So, if the company goes bankrupt – this is a possibility – then the token owned by users may be used to clear debts of Coinbase. Of course, no one is talking about bankruptcy, but these nuances in the User agreement didn’t make investors happy – the stock plunged over 27%.

UST: too much volatility

Some days ago, the United States secretary of the treasury Janet Yellen called for passing a stable coin related law. There are too many activities and emotions around TerraUSD – the token suffered from a massive withdrawal of assets, plummeted, and then tried to regain its positions. It all started when one of the investors requested to sell UST worth $300 million. It caused a panic in the market and a decline in the rate.

We remind you that the cost of LUNA, which is a part of the Terra ecosystem, plunged. Last week, it was $80 and now it’s $0.06. early in May, LUNA was in the Top 10 of the cryptos with the biggest capitalisation.

Article By RoboForex.com

Attention!
Forecasts presented in this section only reflect the author’s private opinion and should not be considered as guidance for trading. RoboForex LP bears no responsibility for trading results based on trading recommendations described in these analytical reviews.

The Analytical Overview of the Main Currency Pairs on 2022.05.13

by JustForex

The EUR/USD currency pair

Technical indicators of the currency pair:
  • Prev Open: 1.0514
  • Prev Close: 1.0379
  • % chg. over the last day: -1.30%

The US producer price index also called factory inflation or wholesale inflation, has jumped to 11% year on year. Last month’s increase was 0.5%. According to many analysts, the producer price index is a more accurate indicator of the inflation faced by businesses and retailers who suffer the most from supply chain disruptions. The initial jobless claims increased to 203,000 (+1,000 for the last week). A strong labor market amid rising inflation is the first sign of an impending recession.

Trading recommendations
  • Support levels: 1.0342
  • Resistance levels: 1.0484, 1.0588, 1.0646, 1.0723, 1.0766, 1.0799, 1.0869, 1.0955

From the technical point of view, the trend on the EUR/USD currency pair on the hourly time frame is still bearish. The MACD indicator became negative, but the sellers’ pressure increased. Under such market conditions, traders can look for sell deals from the resistance level of 1.0484, but only after the additional confirmation. Buy trades can be considered on intraday timeframes from the support level of 1.0342, but only with short targets and confirmation.

Alternative scenario: if the price breaks out through the 1.0588 resistance level and fixes above, the uptrend will likely resume.

EUR/USD
News feed for 2022.05.13:
  • – Eurozone French Consumer Price Index (m/m) at 09:45 (GMT+3);
  • – Eurozone Spanish Consumer Price Index (m/m) at 10:00 (GMT+3);
  • – Eurozone Industrial Production (m/m) at 12:00 (GMT+3);
  • – US Michigan Consumer Sentiment (m/m) at 17:00 (GMT+3);
  • – US FOMC Member Mester Speaks at 19:00 (GMT+3).

The GBP/USD currency pair

Technical indicators of the currency pair:
  • Prev Open: 1.2247
  • Prev Close: 1.2194
  • % chg. over the last day: -0.44%

According to analysts, the UK is already showing signs of stagflation (slowing economic growth with rising consumer prices). The Bank of England will likely have to raise interest rates further to curb inflation, warns Bloomberg manager Dave Ramsden.

Trading recommendations
  • Support levels: 1.2127
  • Resistance levels: 1.2265, 1.2265, 1.2450, 1.2519, 1.2602, 1.2695, 1.2792, 1.2981

On the hourly time frame, the GBP/USD currency pair trend is still bearish. The price continues to decline, but the MACD indicator shows signs of divergence. Under such market conditions, sell trades should be looked for from the resistance level of 1.2265 intraday. For buy deals, traders may consider the level of 1.2127, but only with additional confirmation in the form of a buyers’ initiative.

Alternative scenario: if the price breaks down through the 1.2450 resistance level and fixes above, the mid-term uptrend will likely be resumed.

GBP/USD
There is no news feed for today.

The USD/JPY currency pair

Technical indicators of the currency pair:
  • Prev Open: 129.95
  • Prev Close: 128.31
  • % chg. over the last day: -1.27%

The Japanese yen unexpectedly strengthened yesterday. Concerns about continued stagflation amid slow growth and high prices have led many investors to buy safe-haven currencies. With the dollar index at 20-year highs, the Japanese yen is now a better asset to buy than the dollar. But yesterday, the Bank of Japan Governor Kuroda said that Japan has not yet reached the conditions under which inflation will be stable and sustainable at 2%. This means that the strengthening of the JPY might be temporary speculation, as Japan is still pursuing a soft monetary policy.

Trading recommendations
  • Support levels: 128.63, 127.29, 126.91, 126.00, 125.57
  • Resistance levels: 129.66, 130.12, 130.99

The medium-term trend on the USD/JPY currency pair has changed to bearish. The price has confidently broken through the priority change level and has consolidated below the moving averages. Despite the change in the trend on the hour timeframe, it is better to look for buy deals with the expectation of an uptrend continuation since the Japanese yen has no fundamental support. But as long as the price is below the moving averages, it is worth buying with short targets. First of all, it is worth considering the support level of 128.63, but with confirmation. A resistance level of 129.66 or 130.12 may be considered for sell deals, but only with additional confirmation.

Alternative scenario: If the price fixes above 130.99, the uptrend will likely be resumed.

USD/JPY
There is no news feed for today.

The USD/CAD currency pair

Technical indicators of the currency pair:
  • Prev Open: 1.2985
  • Prev Close: 1.3044
  • % chg. over the last day: +0.45%

The Canadian dollar is a commodity currency and is highly dependent not only on the monetary policy of the Bank of Canada but also on the dynamics of the dollar index and oil prices. Oil prices continue to grow despite declining demand. The International Energy Agency (IEA) said yesterday it does not expect sharp shortages amid worsening supply disruptions from Russia. This situation favors the Canadian dollar, which is showing stability against the US dollar.

Trading recommendations
  • Support levels: 1.2954, 1.2838, 1.2908, 1.2774, 1.2692, 1.2644, 1.2607, 1.2521
  • Resistance levels: 1.3052

The USD/CAD currency pair is bullish in terms of technical analysis. The price has reached the daily resistance level. The MACD indicator has become inactive, but a divergence appeared. Trade is worth it only with short targets because, fundamentally, both the dollar index and the Canadian dollar are inclined to grow. Under such market conditions, it is better to look for buy trades on the lower timeframes from the support level of 1.2954, but only with additional confirmation. For sell deals, it is better to consider the resistance level of 1.3052, but it is also better with confirmation and short targets.

Alternative scenario: if the price breaks through and consolidates below 1.2838, the downtrend will likely be resumed.

USD/CAD
There is no news feed for today.

by JustForex


This article reflects a personal opinion and should not be interpreted as an investment advice, and/or offer, and/or a persistent request for carrying out financial transactions, and/or a guarantee, and/or a forecast of future events.

DXY Triple Zigzag Hints At Major Correction

By Orbex

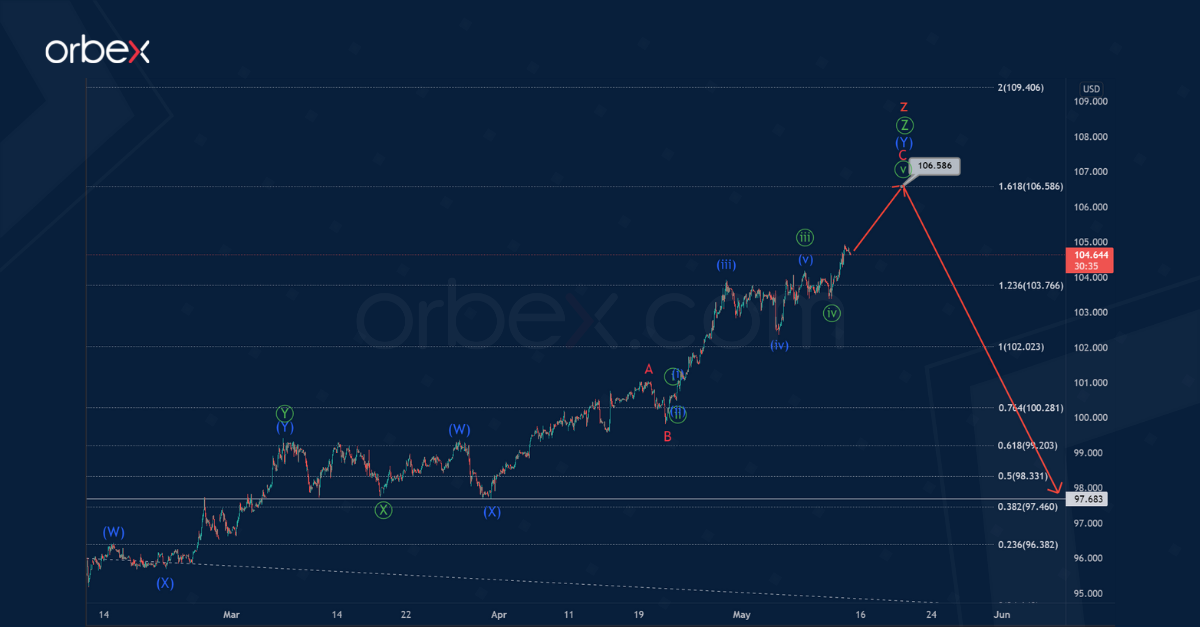
The structure of the DXY index hints at the development of a large triple zigzag w-x-y-x-z of the cycle degree.

At the time of writing, a cyclic actionary wave z is under construction. The internal structure of the wave z suggests a triple zigzag Ⓦ-Ⓧ-Ⓨ-Ⓧ-Ⓩ. The primary wave Ⓩ is still in the process of development. It seems to take the form of a double zigzag (W)-(X)-(Y) of the intermediate degree.

Prices can continue to push to 106.58. At that level, wave z will be at 161.8% of previous actionary wave y.

Now let’s look at an alternative scenario. In the second variant, it is assumed that the cycle actionary wave y was a primary triple zigzag.

If this option is confirmed, then the market will move lower, building a cycle intervening wave x. It will most likely take the form of a primary zigzag Ⓐ-Ⓑ-Ⓒ.

The price could fall to 99.07, as indicated on the chart. At that level, wave x will be at 38.2% of wave y.


Orbex-LogoArticle by Orbex

Orbex is a fully licensed broker that was established in 2011. Founded with a mission to serve its traders responsibly and provides traders with access to the world’s largest and most liquid financial markets. www.orbex.com

Investors fear a new economic crisis in the United States

by JustForex

More and more economic experts believe that the Federal Reserve’s plan to curb inflation may lead to a recession in the economy. To fight inflation, the Fed has launched its most aggressive monetary tightening campaign in decades, planning multiple rate hikes of half a percent in a row and $9 trillion in cuts to its balance sheet. But this tightening campaign is causing cracks in financial markets and steep increases in mortgage rates and other forms of borrowing. This could lead to an economic crisis in the coming months and put pressure on the Fed, both because of inflation and the negative side effects of higher rates. The Economic data is also not encouraging. The US producer price index, also called “factory” inflation or wholesale inflation, increased to 11% in annual terms. Last month’s growth was 0.5%. According to many analysts, the producer price index is a more accurate indicator of the inflation faced by businesses and retailers that suffers the most from supply chain disruptions. The initial jobless claims increased to 203,000 (+1,000 for the last week). A strong labor market amid rising inflation is the first sign of an impending recession. Such signals scare investors enough to sell off their portfolios, which leads to a decrease in stock indices. At the close of the stock market yesterday, the Dow Jones Index (US30) decreased by 0.33%, the S&P 500 (US500) lost 0.13%, and the NASDAQ Technology Index (US100) fell by 0.06%.

Federal Reserve Chairman Jerome Powell was re-elected for a second term yesterday. Powell made an interesting point yesterday: “I have said, and I will say again, that, you know, if you had perfect hindsight, you’d go back, and it probably would have been better for us to have raised rates a little sooner,” Powell said, in an interview with Marketplace that will air this evening.

Major European indices closed in the red zone yesterday. The German DAX (DE30) decreased by 0.64%, the French CAC 40 (FR40) fell by 1.01%, the Spanish IBEX 35 (ES35) lost 1.35%, and the British FTSE 100 (UK100) fell by 1.56%. Gabriel Makhlouf, head of the Central Bank of Ireland, has joined many European Central Bank policymakers in urging the ECB to be more decisive and take action on inflation.

According to analysts, the UK is already showing signs of stagflation (slowing economic growth while consumer prices are rising). It is likely that the Bank of England will have to raise interest rates even more to curb inflation, warns Bloomberg manager Dave Ramsden.

Sanctions imposed on “EuRoPol” GAZ by Moscow prohibit gas deliveries through the Polish section of the Yamal-Europe pipeline.

The International Energy Agency (IEA) said yesterday that it does not expect acute shortages amid the worsening disruption of oil supplies from Russia. According to the IEA, a new embargo against Russia may accelerate the reorientation of trade flows of Russian oil toward Asia. This is the reason why oil continues to rise despite lower demand. On the other hand, more and more European countries want to eliminate oil and gas dependence on Russia following its invasion of Ukraine. Sooner or later, this will cause serious economic damage to Russia as most of Russia’s profits come from the sale of oil and gas.

Asian markets closed yesterday with a decline. Japan’s Nikkei 225 (JP225) fell by 1.77%, Hong Kong’s Hang Seng (HK50) lost 2.24%, and Australia’s S&P/ASX 200 (AU200) was down by 1.75%. On Thursday, Japanese Foreign Minister Yoshimasa Hayashi agreed with his counterparts in Britain, Canada, and France on the importance of G7 unity in countering Russia’s invasion of Ukraine.

Chinese developer Zhongliang Holdings struggles to extend a $729 million bond maturity before next week’s deadline to avoid defaulting on offshore debt. Zhongliang’s bond default could heighten investor fears about China’s real estate sector.

Main market quotes:

S&P 500 (F) (US500) 3,930.08 -5.10 (-0.13%)

Dow Jones (US30) 31,730.30 -103.81 (-0.33%)

DAX (DE40) 13,739.64 -89.00 (-0.64%)

FTSE 100 (UK100) 7,233.34 -114.32 (-1.56%)

USD Index 104.77 +0.92 (+0.98%)

Important events for today:
  • – Eurozone French Consumer Price Index (m/m) at 09:45 (GMT+3);
  • – Eurozone Spanish Consumer Price Index (m/m) at 10:00 (GMT+3);
  • – Eurozone Industrial Production (m/m) at 12:00 (GMT+3);
  • – US Michigan Consumer Sentiment (m/m) at 17:00 (GMT+3);
  • – US FOMC Member Mester Speaks at 19:00 (GMT+3).

by JustForex


This article reflects a personal opinion and should not be interpreted as an investment advice, and/or offer, and/or a persistent request for carrying out financial transactions, and/or a guarantee, and/or a forecast of future events.

Intraday Market Analysis – USD Retains Upper Hand

By Orbex

GBPUSD to reach 2-year lows

The pound remained under pressure after a slowdown in the UK’s GDP growth in Q1. A break below the lower range (1.2260) of a brief consolidation signalled a bearish continuation. Sterling is heading towards its two-year low at 1.2100. Short-covering could be expected and in conjunction with dip-buying could drive the price up momentarily. 1.2400 is the first resistance and the bulls need to lift the recent high at 1.2640 before they could regain control. Otherwise, the psychological level of 1.2000 would be the next stop.

NZDUSD grinds lower

The New Zealand dollar tumbles as traders continue to pile into safe haven assets. The sell-off accelerated after the pair sank below June 2020’s lows near 0.6400. Downbeat sentiment may attract more trend followers after a faded rebound. 0.6100 near a two-year low would be the next target. 0.6370 is a fresh resistance and the bears may sell into strength at the next bounce. The support-turned-resistance at 0.6450 sits next to the 20-day moving average and is a major level to clear before a reversal could materialise.

US 100 may see limited bounce

The Nasdaq 100 struggles to find bottom as investors continue to flee risk assets. The index sees no sign of stabilisation yet as it approaches 11500. The price action has been capped by a falling trend line from last April. An oversold RSI may prompt sellers to take profit and possibly trigger a mean reversion trade to the upper band (13000) of the line. A break above 12400 may attract enough buying interest to make this happen, but the rebound could be limited unless the bulls succeed in pushing higher.

Test your strategy on how the GBP will fare! Open your Orbex Account and start trading now. 


Orbex-LogoArticle by Orbex

Orbex is a fully licensed broker that was established in 2011. Founded with a mission to serve its traders responsibly and provides traders with access to the world’s largest and most liquid financial markets. www.orbex.com

The Inflation-Yield Connection and Its Impact on Forex Markets

By Orbex

This week we had a bit of a worrying sign in the markets that has gone largely unnoticed in the major financial news outlets. The yield on the ten-year US Treasury blipped above 3.0% and came back down. It might seem a bit arcane or not particularly relevant, but that bond in particular is the “benchmark” for US interest rates. It has only been above 3.0% twice in the last decade, and each time was followed by turmoil in the markets.

Of course, the past doesn’t always repeat itself in the markets. And we kind of already have enough turmoil. The bond yield rose initially because the Fed hiked rates, but then fell back after the CPI data came in hotter than expected. Basically, investors reassessed their expectations of whether the Fed will manage to complete its hiking cycle before the economy faces a major downturn.

What’s going on?

The key here is that inflation and bond yields are intimately connected, because of how the banking system works. Remember, a bond yield basically represents the annual “profit” a bondholder can expect on the asset considering its price and interest rate. So, bond yields go up when people expect interest rates to rise, and go down when people expect interest rates to be lower.

The thing is that the benchmark is used as a reference when determining the price that banks loan money. And this loaning of money is what “creates” the money in circulation. In the current monetary system, banks are the ones who “print” money by loaning it out and backing it up with debt.

How it works

Basically, when you borrow money from the bank, the bank just creates the money in your account. Separately, the bank creates a “security” that represents the value of the loan. Banks can then negotiate those securities on the market for a lower interest rate than what you are paying. That’s how banks make money.

But it also means that as bond yields rise, the interest rate charged by banks also increases. The higher cost of loans means less people can afford to borrow money. And if banks are issuing less loans, then the amount of money in circulation stops increasing and eventually starts to shrink.

Is it 2018 again?

This was the problem about four years ago when the Fed was raising rates the last time. Interest rates rose above 3.0%, and the cost of credit increased enough that loan issuance started to fall off. The Fed had to quickly reverse course to get interest rates down and prevent the economy from sputtering.

Of course, inflation is much higher now, meaning that there is a lot more money in circulation. It might take a significantly higher interest rate to slow down loan creation enough to get inflation back under control. Meaning that the dollar could be set to strengthen quite a bit, as bond yields are key drivers of the value of a currency.

The downside is that if interest rates go too high and too much money is pulled from the economy, well, that’s what we call a recession.

Trading the news requires access to extensive market research – and that’s what we do best. Open your Orbex account now.


Orbex-LogoArticle by Orbex

Orbex is a fully licensed broker that was established in 2011. Founded with a mission to serve its traders responsibly and provides traders with access to the world’s largest and most liquid financial markets. www.orbex.com

Can A Recovery In US Consumption Be Expected?

By Orbex

The latest data from the US has been giving some mixed signals about the underlying conditions. That has increased the uncertainty about what the Fed might do at its next meeting. The practical result for us traders is that there is more volatility in the currency markets. Generally, the dollar sets a relatively steady course, but contradicting data could make it hard to figure out where things are going.

Tomorrow’s release of University of Michigan consumer sentiment could stir up the mix a little more. Consumers are the drivers of the American economy, and they are being buffeted around by choppy economic waters. All through last year, consumer optimism had been declining. Which isn’t surprising, since inflation had been increasing faster than wages, sapping at consumer purchasing power. But since March a little optimism has returned. Now the question is whether that’s just a little “hump” before turning to the downside, or the sign of a new trend.

The conflicting data

First, we had the report of negative Q1 GDP growth. Following that, investors took a more cautious outlook in terms of what the Fed will do in the next meeting. Speculation coalesced around the idea that the Fed would raise rates by 50 basis points, and 75 bps was out of the question.

But yesterday, CPI figures came in above expectations. Sure, they were lower than the prior four-decade record high. But they showed that inflation is still far from betting firmly under control. Inflation, particularly if not coupled with real wage growth, eventually leads to economic stagnation. With already one quarter of negative growth, getting prices under control has increased urgency. Following the data release, the number of analysts expecting a 75 bps hike at the next meeting increased to 15%, nearly doubling the 8% from a week ago.

Can we get a resolution?

Falling consumer sentiment would be an indication that a recession might be imminent, and likely would be interpreted as the possibility of looser monetary policy than currently expected. That could contribute to a weaker dollar. But if consumers are regaining confidence, that would help give the Fed the motivation needed to keep raising rates. So, it could support the dollar.

The current consensus is that the Michigan May Consumer Sentiment indicator will fall a bit. The estimation is for it to move back to 64.0 from 65.2 in April. Not necessarily a bad sign, but if it doesn’t rise, that wouldn’t be a good sign, either. So, we’d have to see a significant beat or miss to potentially solve the issue of conflicting data.

The key levels

If Michigan Consumer Sentiment drops below the 60 level, it could be an indication that the recent positivity was an aberration of the trend. On the other hand, a move close to the 70 level could be seen as confirmation that consumers are finally feeling better about spending.


Orbex-LogoArticle by Orbex

Orbex is a fully licensed broker that was established in 2011. Founded with a mission to serve its traders responsibly and provides traders with access to the world’s largest and most liquid financial markets. www.orbex.com

Japanese Candlesticks Analysis 12.05.2022 (USDCAD, AUDUSD, USDCHF)

Article By RoboForex.com

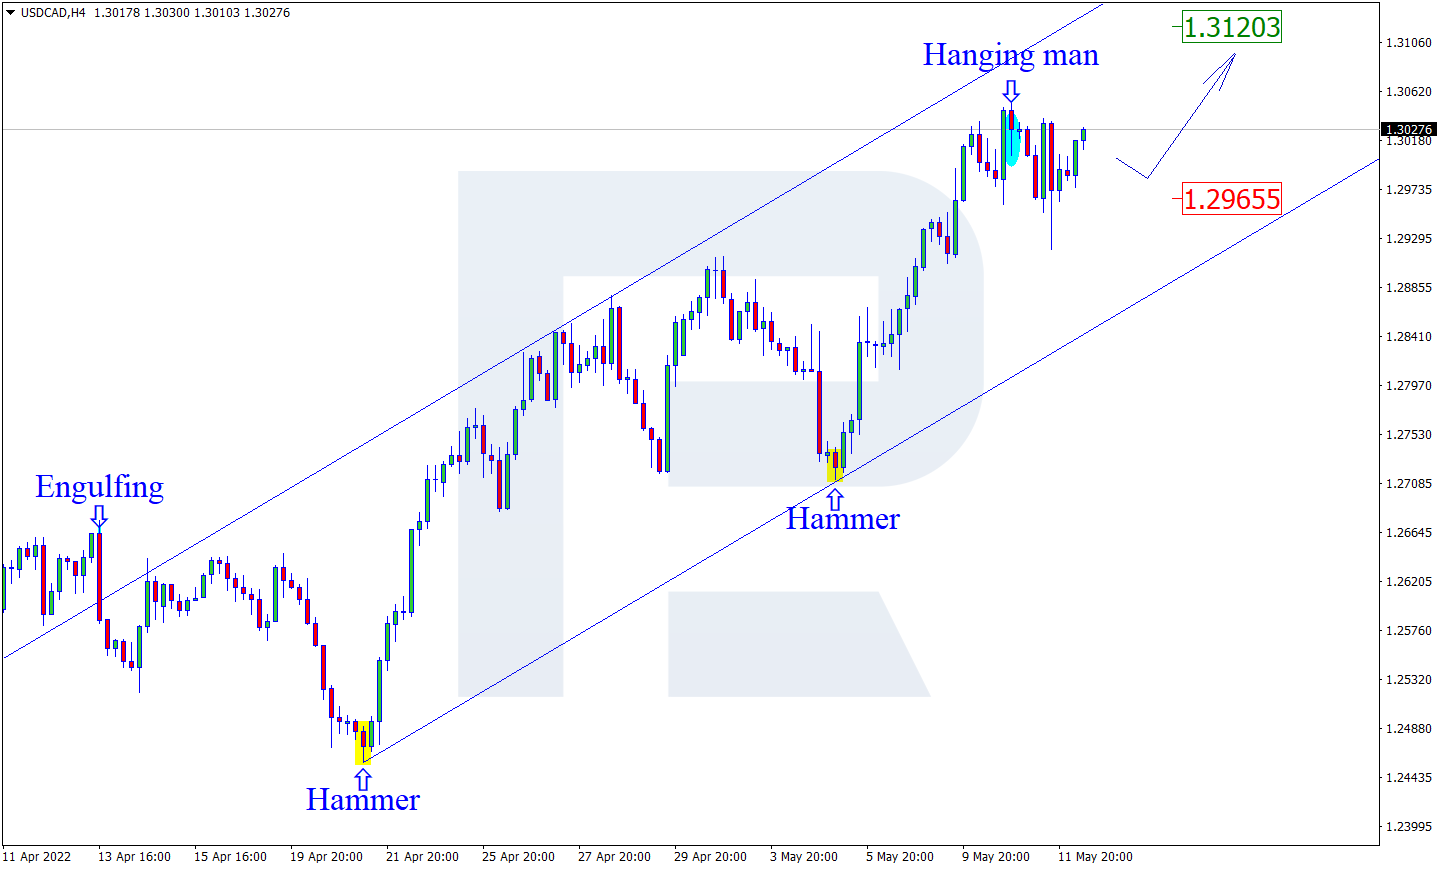
USDCAD, “US Dollar vs Canadian Dollar”

As we can see in the H4 chart, after forming a Hanging Man reversal pattern close to the resistance level, USDCAD is reversing in the form of a new descending impulse. In this case, the downside target may be at 1.2965. However, an alternative scenario implies that the asset may grow to break the resistance level at 1.3120 and continue the ascending tendency without any corrections.

USDCAD
Risk Warning: the result of previous trading operations do not guarantee the same results in the future

AUDUSD, “Australian Dollar vs US Dollar”

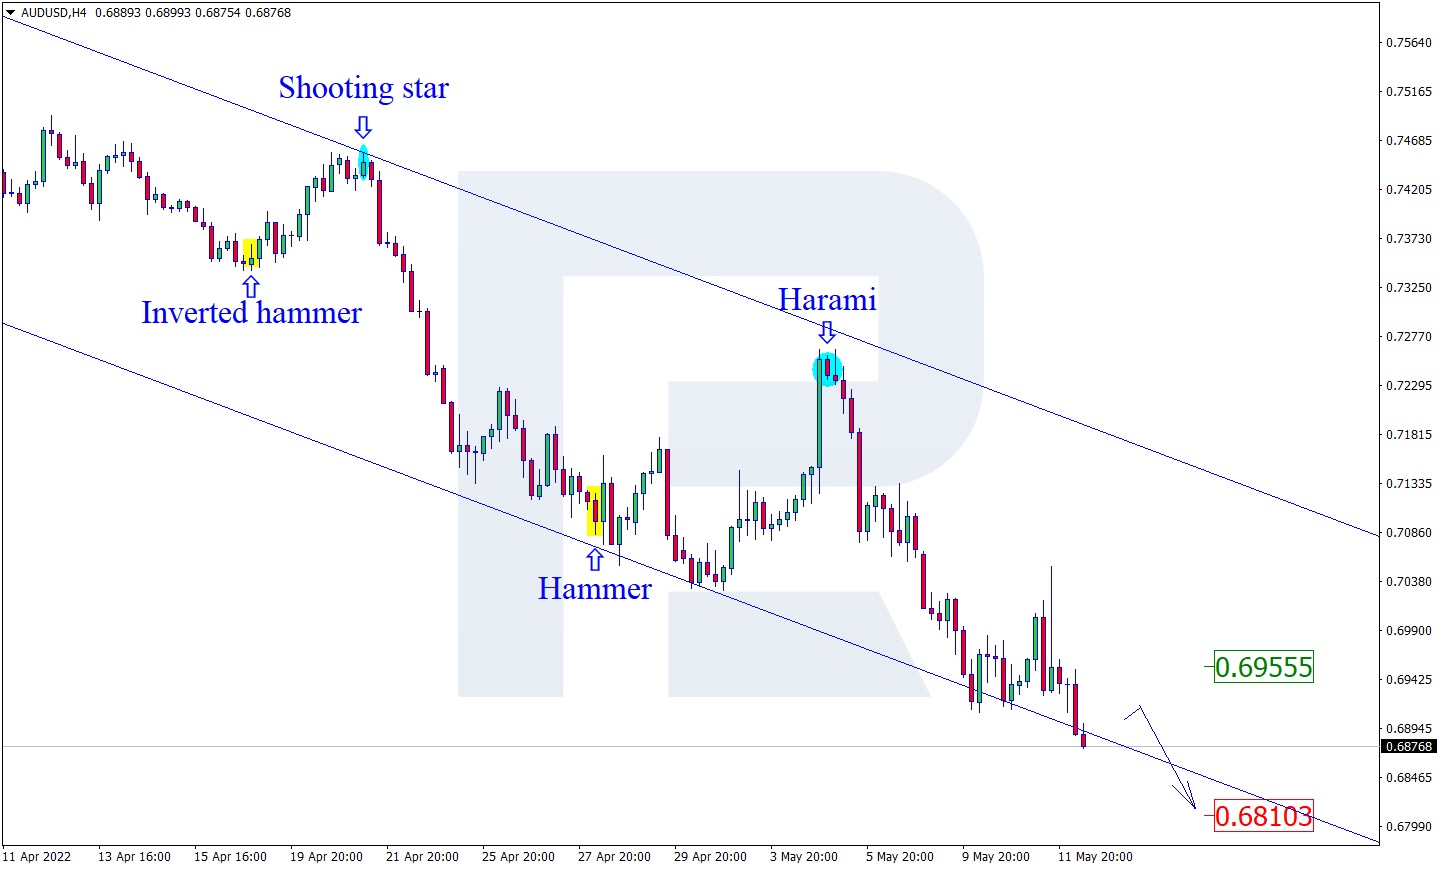
As we can see in the H4 chart, AUDUSD has formed a Harami reversal pattern near the resistance area. At the moment, the asset is reversing and starting a new descending impulse. In this case, the downside target may be the support level at 0.6810. After testing the level, the price may break it and continue the descending tendency. At the same time, an opposite scenario implies that the price may correct to reach 0.6955 before resuming the downtrend.

AUDUSD
Risk Warning: the result of previous trading operations do not guarantee the same results in the future

USDCHF, “US Dollar vs Swiss Franc”

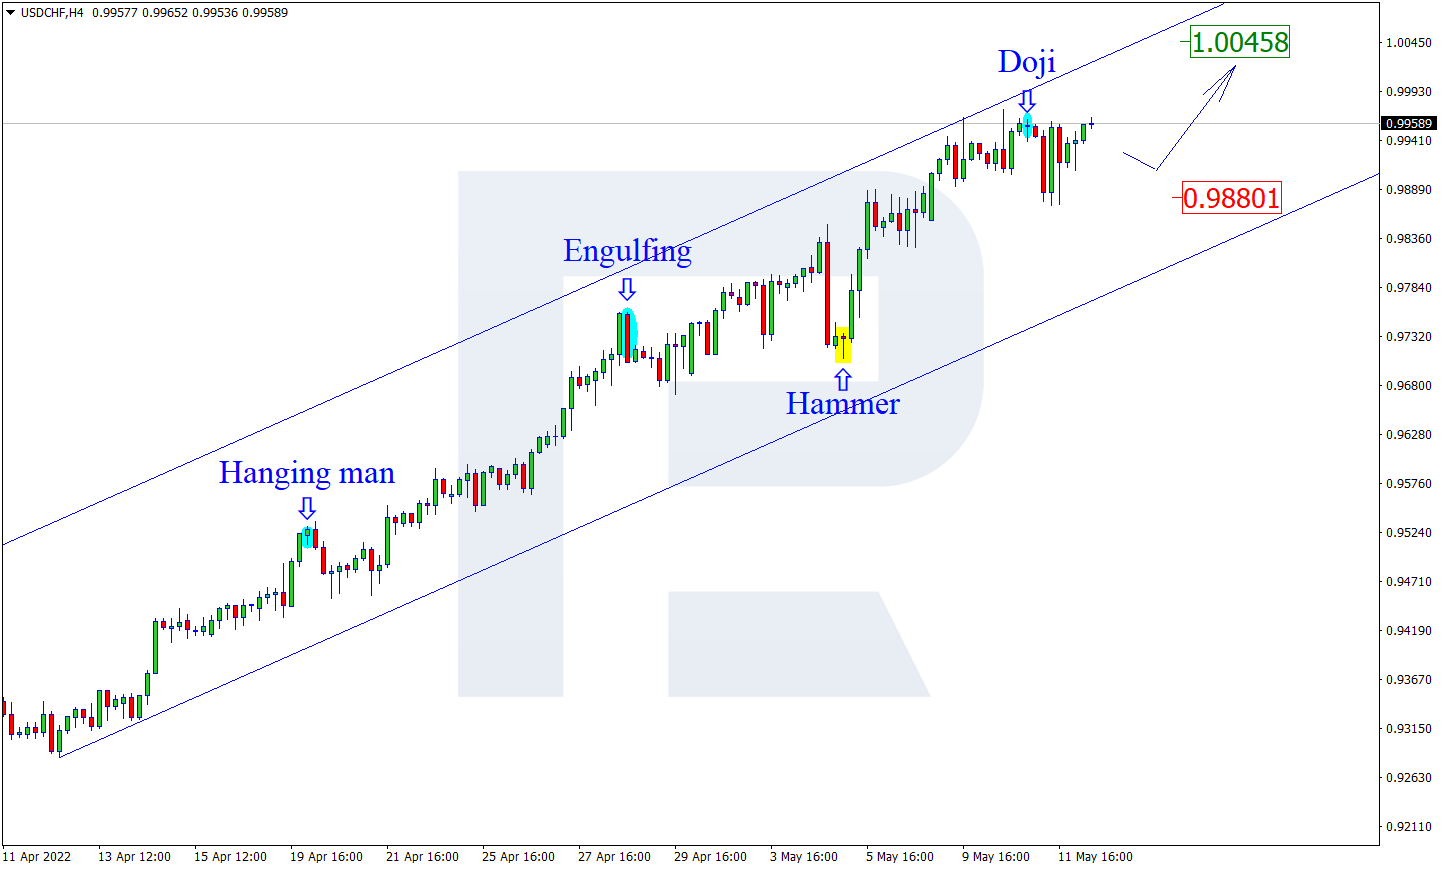
As we can see in the H4 chart, after testing the resistance area, the pair has formed a Doji reversal pattern. At the moment, USDCHF may reverse in the form of a new descending impulse. In this case, the downside target may be at 0.9880. After testing the support level, the price may rebound from it and resume trading upwards. Still, there might be an alternative scenario, according to which the asset may grow to reach 1.0045 without any pullbacks.

USDCHF

Article By RoboForex.com

Attention!
Forecasts presented in this section only reflect the author’s private opinion and should not be considered as guidance for trading. RoboForex LP bears no responsibility for trading results based on trading recommendations described in these analytical reviews.