By InvestMacro
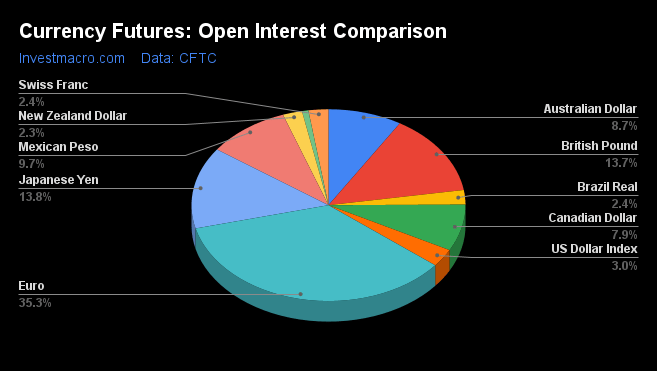
The latest charts and statistics for the Commitment of Traders (COT) data published by the Commodities Futures Trading Commission (CFTC) showed that large forex speculators raised their bets for most of the currency futures markets. The latest COT data for Week 36 is updated through Tuesday September 6th and shows a quick view of how large traders (for-profit speculators and commercial entities) were positioned in the futures markets.
All currency positions are in direct relation to the US dollar where, for example, a bet for the euro is a bet that the euro will rise versus the dollar while a bet against the euro will be a bet that the euro will decline versus the dollar.
Weekly Speculator Changes led higher by Brazilian Real & Euro bets
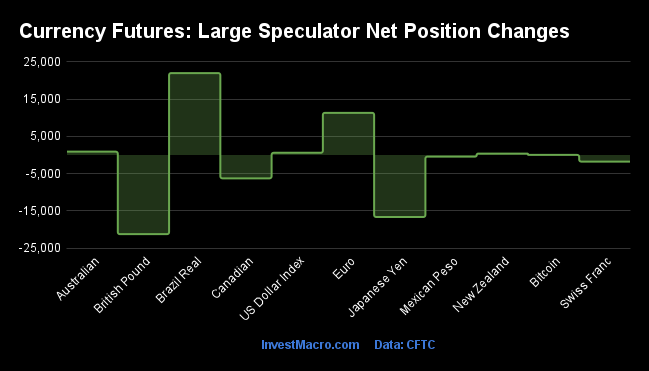
The COT currency market speculator bets were slightly higher this week as six out of the eleven currency markets we cover had higher positioning while the other five markets had lower speculator contracts.
Leading the gains for the currency markets was the Brazilian real (22,001 contracts) and the Euro (11,327 contracts) with the Australian dollar (893 contracts), US Dollar Index (592 contracts), New Zealand dollar (378 contracts) and the Bitcoin (26 contracts) having positive weeks.
The currencies leading the declines in speculator bets this week were the British pound sterling (-21,262 contracts) and the Japanese yen (-16,658 contracts) with the Canadian dollar (-6,269 contracts), Swiss franc (-1,775 contracts) and the Mexican peso (-430 contracts) also registering lower bets on the week.
Highlighting the COT currency changes this week is the sharp gain in the Brazilian Real speculator positions this week. Speculators boosted the Brazilian currency bets by the largest weekly amount since March and have increased bullish bets in six out of the past eight weeks. The overall speculator standing now sits at the most bullish level in ten weeks, dating back to June 28th. The Real futures and spot prices have been range-bound in trading and are expected to stay that way as a presidential election comes up on October 2nd.
The Euro currency bets this week jumped by the most in fourteen weeks (+11,327 contracts) as the European Central Bank raised its benchmark interest rate by 75 basis points on Thursday. This week’s gain broke a streak of three weeks of speculator bet declines. The overall speculator positioning is relatively tame at a level of just -36,349 contracts despite the Euro currency’s exchange rate versus the US Dollar. The EURUSD is currently trading right near parity (1.0048) and not too far from 20-year lows. Comparatively, when the Euro speculator positions were last consistently near or below -100,000 net contracts in 2019, the EURUSD was trading above the 1.20 exchange rate. The outlook for the European economy is not looking great as a low growth environment could combine with a potential energy crisis shaping up for this winter (due to the Russia-Ukraine war) – so it will be interesting to see if speculator positioning follows the Euro lower or if the exchange rate is near a bottom.
| Sep-06-2022 | OI | OI-Index | Spec-Net | Spec-Index | Com-Net | COM-Index | Smalls-Net | Smalls-Index |
|---|---|---|---|---|---|---|---|---|
| USD Index | 61,662 | 92 | 36,107 | 85 | -38,458 | 15 | 2,351 | 42 |
| EUR | 721,678 | 91 | -36,349 | 24 | 19,610 | 82 | 16,739 | 2 |
| GBP | 280,937 | 100 | -50,432 | 29 | 69,958 | 78 | -19,526 | 6 |
| JPY | 281,266 | 100 | -58,189 | 33 | 77,669 | 74 | -19,480 | 14 |
| CHF | 48,226 | 37 | -4,037 | 46 | 16,867 | 70 | -12,830 | 14 |
| CAD | 160,567 | 37 | 17,910 | 59 | -18,916 | 53 | 1,006 | 32 |
| AUD | 178,232 | 66 | -56,500 | 32 | 63,784 | 66 | -7,284 | 35 |
| NZD | 46,796 | 37 | -2,746 | 67 | 6,500 | 40 | -3,754 | 8 |
| MXN | 199,161 | 49 | -29,460 | 15 | 25,310 | 83 | 4,150 | 61 |
| RUB | 20,930 | 4 | 7,543 | 31 | -7,150 | 69 | -393 | 24 |
| BRL | 50,005 | 40 | 30,860 | 81 | -32,482 | 20 | 1,622 | 84 |
| Bitcoin | 15,337 | 90 | 1,322 | 100 | -1,301 | 0 | -21 | 12 |
Bitcoin, US Dollar Index & Brazilian Real at top of Strength Scores
Strength Scores (a normalized measure of Speculator positions over a 3-Year range, from 0 to 100 where above 80 is extreme bullish and below 20 is extreme bearish) showed that Bitcoin (100.0 percent), the US Dollar Index (85.2 percent) and the Brazilian Real (80.7 percent) lead the currency markets at the top of their respective ranges and are all in bullish extreme positions with scores above 80 percent. The New Zealand Dollar (66.7 percent) and Canadian Dollar (59.5 percent) come in as the next highest in the currency markets in strength scores.
On the downside, the Mexican Peso (14.8 percent) comes in at the lowest strength level and is in a bearish extreme level below 20 percent. The next lowest strength scores are for the EuroFX (23.8 percent), the British Pound Sterling (29.2 percent) and the Australian Dollar (32.4 percent).
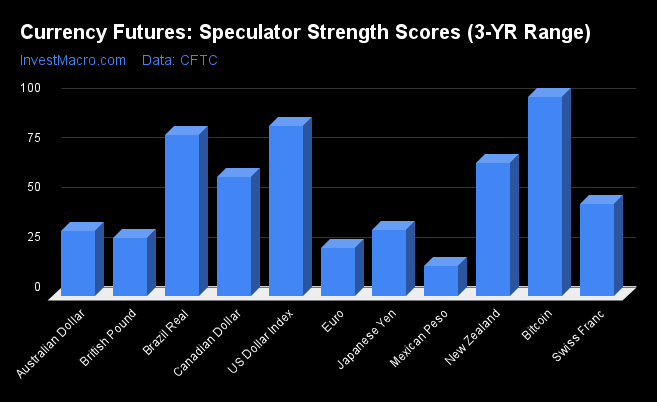
Strength Statistics:
US Dollar Index (85.2 percent) vs US Dollar Index previous week (84.2 percent)
EuroFX (23.8 percent) vs EuroFX previous week (20.4 percent)
British Pound Sterling (29.2 percent) vs British Pound Sterling previous week (46.6 percent)
Japanese Yen (33.0 percent) vs Japanese Yen previous week (43.3 percent)
Swiss Franc (46.3 percent) vs Swiss Franc previous week (50.8 percent)
Canadian Dollar (59.5 percent) vs Canadian Dollar previous week (66.5 percent)
Australian Dollar (32.4 percent) vs Australian Dollar previous week (31.6 percent)
New Zealand Dollar (66.7 percent) vs New Zealand Dollar previous week (66.0 percent)
Mexican Peso (14.8 percent) vs Mexican Peso previous week (15.0 percent)
Brazil Real (80.7 percent) vs Brazil Real previous week (59.1 percent)
Bitcoin (100.0 percent) vs Bitcoin previous week (99.5 percent)
Bitcoin, Real and Swiss Franc lead the Strength Trends
Strength Score Trends (or move index, calculates the 6-week changes in strength scores) show that Bitcoin (25.2 percent) leads the past six weeks trends for the currency markets this week. The Brazilian Real (18.8 percent) and the Swiss Franc (18.4 percent) fill out the next highest movers in the latest trends data.
The Australian Dollar (-8.5 percent) leads the downside trend scores currently while the only other market with a lower trend scores was the US Dollar Index (-7.4 percent).
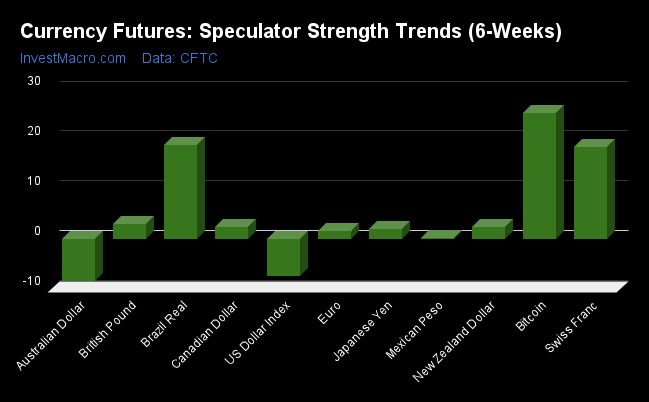
Strength Trend Statistics:
US Dollar Index (-7.4 percent) vs US Dollar Index previous week (-5.9 percent)
EuroFX (1.6 percent) vs EuroFX previous week (-1.5 percent)
British Pound Sterling (2.9 percent) vs British Pound Sterling previous week (23.0 percent)
Japanese Yen (2.0 percent) vs Japanese Yen previous week (10.9 percent)
Swiss Franc (18.4 percent) vs Swiss Franc previous week (21.9 percent)
Canadian Dollar (2.4 percent) vs Canadian Dollar previous week (19.7 percent)
Australian Dollar (-8.5 percent) vs Australian Dollar previous week (-13.2 percent)
New Zealand Dollar (2.4 percent) vs New Zealand Dollar previous week (0.9 percent)
Mexican Peso (0.2 percent) vs Mexican Peso previous week (0.7 percent)
Brazil Real (18.8 percent) vs Brazil Real previous week (-1.6 percent)
Bitcoin (25.2 percent) vs Bitcoin previous week (31.4 percent)
Individual Markets:
US Dollar Index Futures:
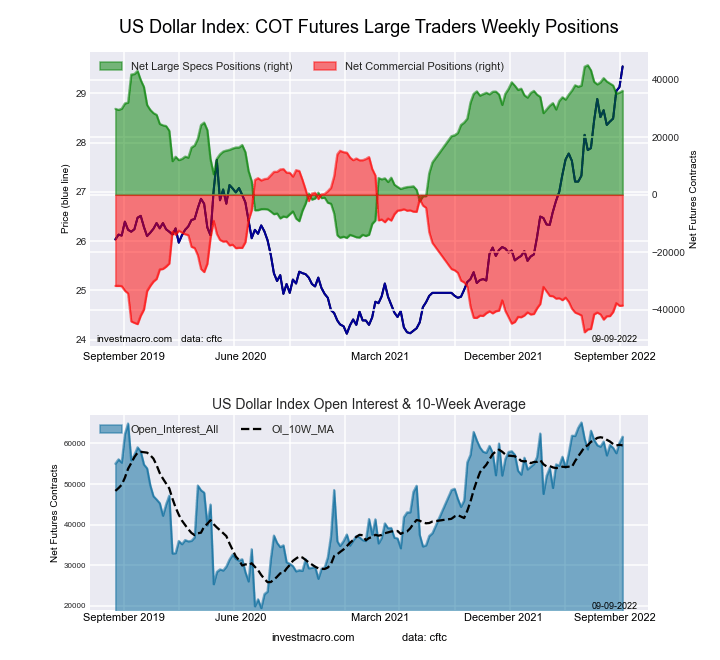 The US Dollar Index large speculator standing this week came in at a net position of 36,107 contracts in the data reported through Tuesday. This was a weekly boost of 592 contracts from the previous week which had a total of 35,515 net contracts.
This week’s current strength score (the trader positioning range over the past three years, measured from 0 to 100) shows the speculators are currently Bullish-Extreme with a score of 85.2 percent. The commercials are Bearish-Extreme with a score of 14.7 percent and the small traders (not shown in chart) are Bearish with a score of 42.2 percent.
| US DOLLAR INDEX Statistics | SPECULATORS | COMMERCIALS | SMALL TRADERS |
| – Percent of Open Interest Longs: | 85.3 | 3.1 | 8.9 |
| – Percent of Open Interest Shorts: | 26.8 | 65.5 | 5.1 |
| – Net Position: | 36,107 | -38,458 | 2,351 |
| – Gross Longs: | 52,607 | 1,912 | 5,476 |
| – Gross Shorts: | 16,500 | 40,370 | 3,125 |
| – Long to Short Ratio: | 3.2 to 1 | 0.0 to 1 | 1.8 to 1 |
| NET POSITION TREND: | |||
| – Strength Index Score (3 Year Range Pct): | 85.2 | 14.7 | 42.2 |
| – Strength Index Reading (3 Year Range): | Bullish-Extreme | Bearish-Extreme | Bearish |
| NET POSITION MOVEMENT INDEX: | |||
| – 6-Week Change in Strength Index: | -7.4 | 7.7 | -4.7 |
Euro Currency Futures:
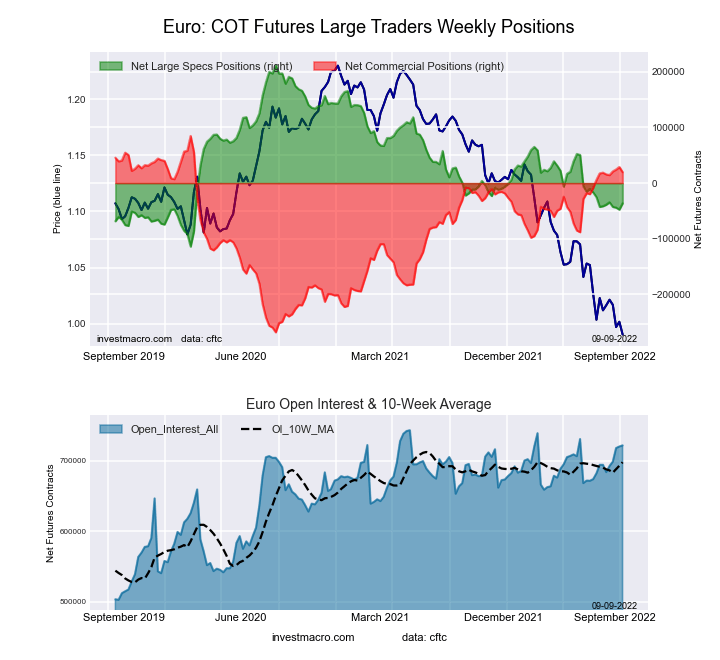 The Euro Currency large speculator standing this week came in at a net position of -36,349 contracts in the data reported through Tuesday. This was a weekly advance of 11,327 contracts from the previous week which had a total of -47,676 net contracts.
This week’s current strength score (the trader positioning range over the past three years, measured from 0 to 100) shows the speculators are currently Bearish with a score of 23.8 percent. The commercials are Bullish-Extreme with a score of 81.6 percent and the small traders (not shown in chart) are Bearish-Extreme with a score of 2.1 percent.
| EURO Currency Statistics | SPECULATORS | COMMERCIALS | SMALL TRADERS |
| – Percent of Open Interest Longs: | 28.4 | 56.7 | 11.6 |
| – Percent of Open Interest Shorts: | 33.5 | 54.0 | 9.2 |
| – Net Position: | -36,349 | 19,610 | 16,739 |
| – Gross Longs: | 205,277 | 409,460 | 83,493 |
| – Gross Shorts: | 241,626 | 389,850 | 66,754 |
| – Long to Short Ratio: | 0.8 to 1 | 1.1 to 1 | 1.3 to 1 |
| NET POSITION TREND: | |||
| – Strength Index Score (3 Year Range Pct): | 23.8 | 81.6 | 2.1 |
| – Strength Index Reading (3 Year Range): | Bearish | Bullish-Extreme | Bearish-Extreme |
| NET POSITION MOVEMENT INDEX: | |||
| – 6-Week Change in Strength Index: | 1.6 | 0.3 | -10.2 |
British Pound Sterling Futures:
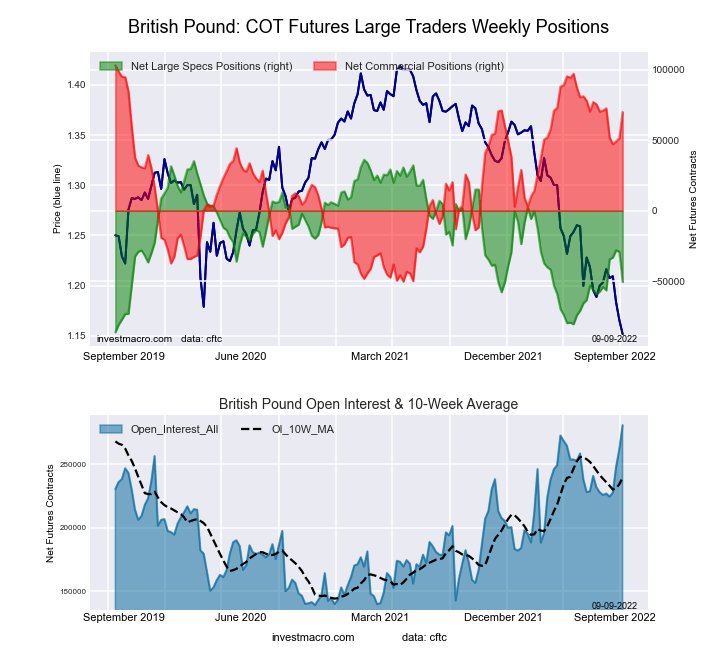 The British Pound Sterling large speculator standing this week came in at a net position of -50,432 contracts in the data reported through Tuesday. This was a weekly fall of -21,262 contracts from the previous week which had a total of -29,170 net contracts.
This week’s current strength score (the trader positioning range over the past three years, measured from 0 to 100) shows the speculators are currently Bearish with a score of 29.2 percent. The commercials are Bullish with a score of 78.4 percent and the small traders (not shown in chart) are Bearish-Extreme with a score of 6.4 percent.
| BRITISH POUND Statistics | SPECULATORS | COMMERCIALS | SMALL TRADERS |
| – Percent of Open Interest Longs: | 18.8 | 67.5 | 8.0 |
| – Percent of Open Interest Shorts: | 36.7 | 42.6 | 15.0 |
| – Net Position: | -50,432 | 69,958 | -19,526 |
| – Gross Longs: | 52,731 | 189,617 | 22,607 |
| – Gross Shorts: | 103,163 | 119,659 | 42,133 |
| – Long to Short Ratio: | 0.5 to 1 | 1.6 to 1 | 0.5 to 1 |
| NET POSITION TREND: | |||
| – Strength Index Score (3 Year Range Pct): | 29.2 | 78.4 | 6.4 |
| – Strength Index Reading (3 Year Range): | Bearish | Bullish | Bearish-Extreme |
| NET POSITION MOVEMENT INDEX: | |||
| – 6-Week Change in Strength Index: | 2.9 | -0.7 | -5.8 |
Japanese Yen Futures:
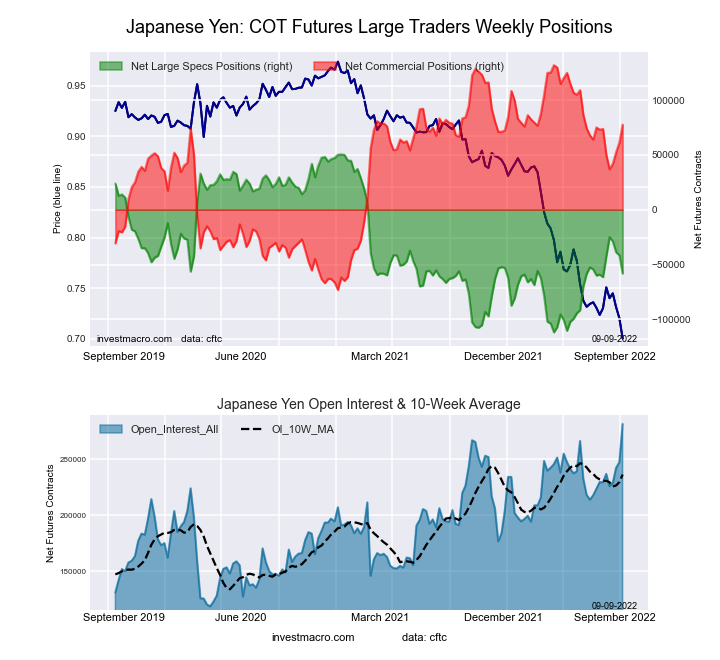 The Japanese Yen large speculator standing this week came in at a net position of -58,189 contracts in the data reported through Tuesday. This was a weekly fall of -16,658 contracts from the previous week which had a total of -41,531 net contracts.
This week’s current strength score (the trader positioning range over the past three years, measured from 0 to 100) shows the speculators are currently Bearish with a score of 33.0 percent. The commercials are Bullish with a score of 73.5 percent and the small traders (not shown in chart) are Bearish-Extreme with a score of 13.9 percent.
| JAPANESE YEN Statistics | SPECULATORS | COMMERCIALS | SMALL TRADERS |
| – Percent of Open Interest Longs: | 19.9 | 68.0 | 8.6 |
| – Percent of Open Interest Shorts: | 40.6 | 40.3 | 15.5 |
| – Net Position: | -58,189 | 77,669 | -19,480 |
| – Gross Longs: | 56,002 | 191,138 | 24,109 |
| – Gross Shorts: | 114,191 | 113,469 | 43,589 |
| – Long to Short Ratio: | 0.5 to 1 | 1.7 to 1 | 0.6 to 1 |
| NET POSITION TREND: | |||
| – Strength Index Score (3 Year Range Pct): | 33.0 | 73.5 | 13.9 |
| – Strength Index Reading (3 Year Range): | Bearish | Bullish | Bearish-Extreme |
| NET POSITION MOVEMENT INDEX: | |||
| – 6-Week Change in Strength Index: | 2.0 | 1.9 | -14.6 |
Swiss Franc Futures:
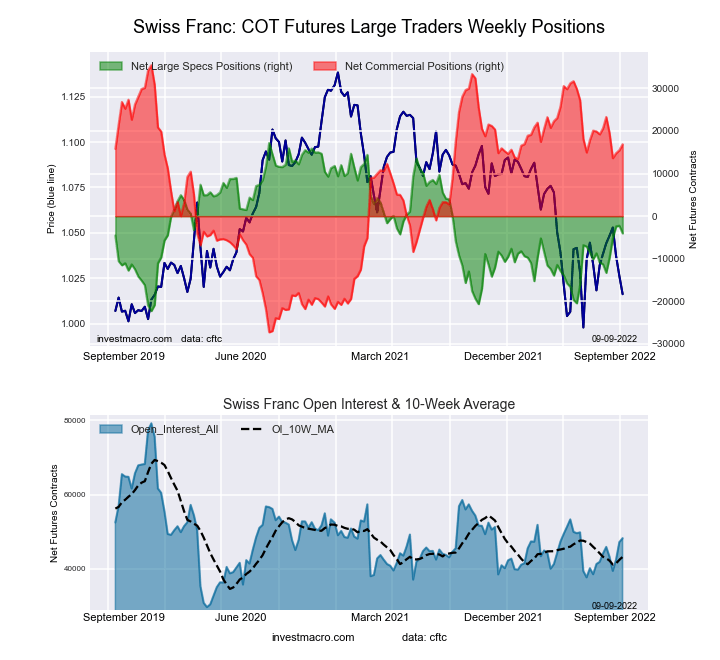 The Swiss Franc large speculator standing this week came in at a net position of -4,037 contracts in the data reported through Tuesday. This was a weekly decrease of -1,775 contracts from the previous week which had a total of -2,262 net contracts.
This week’s current strength score (the trader positioning range over the past three years, measured from 0 to 100) shows the speculators are currently Bearish with a score of 46.3 percent. The commercials are Bullish with a score of 70.4 percent and the small traders (not shown in chart) are Bearish-Extreme with a score of 14.1 percent.
| SWISS FRANC Statistics | SPECULATORS | COMMERCIALS | SMALL TRADERS |
| – Percent of Open Interest Longs: | 22.6 | 55.1 | 19.9 |
| – Percent of Open Interest Shorts: | 30.9 | 20.1 | 46.6 |
| – Net Position: | -4,037 | 16,867 | -12,830 |
| – Gross Longs: | 10,882 | 26,584 | 9,620 |
| – Gross Shorts: | 14,919 | 9,717 | 22,450 |
| – Long to Short Ratio: | 0.7 to 1 | 2.7 to 1 | 0.4 to 1 |
| NET POSITION TREND: | |||
| – Strength Index Score (3 Year Range Pct): | 46.3 | 70.4 | 14.1 |
| – Strength Index Reading (3 Year Range): | Bearish | Bullish | Bearish-Extreme |
| NET POSITION MOVEMENT INDEX: | |||
| – 6-Week Change in Strength Index: | 18.4 | -6.0 | -11.9 |
Canadian Dollar Futures:
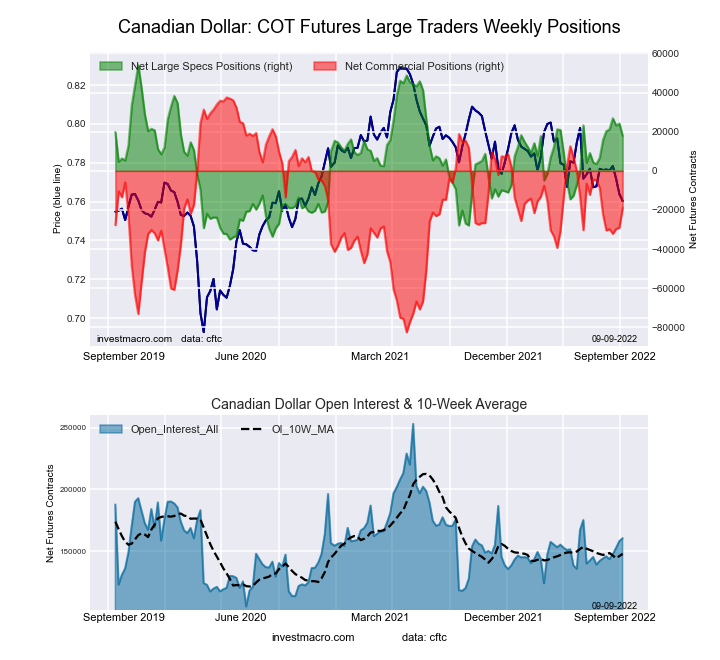 The Canadian Dollar large speculator standing this week came in at a net position of 17,910 contracts in the data reported through Tuesday. This was a weekly lowering of -6,269 contracts from the previous week which had a total of 24,179 net contracts.
This week’s current strength score (the trader positioning range over the past three years, measured from 0 to 100) shows the speculators are currently Bullish with a score of 59.5 percent. The commercials are Bullish with a score of 53.0 percent and the small traders (not shown in chart) are Bearish with a score of 32.1 percent.
| CANADIAN DOLLAR Statistics | SPECULATORS | COMMERCIALS | SMALL TRADERS |
| – Percent of Open Interest Longs: | 35.6 | 41.4 | 20.6 |
| – Percent of Open Interest Shorts: | 24.5 | 53.2 | 19.9 |
| – Net Position: | 17,910 | -18,916 | 1,006 |
| – Gross Longs: | 57,185 | 66,485 | 33,039 |
| – Gross Shorts: | 39,275 | 85,401 | 32,033 |
| – Long to Short Ratio: | 1.5 to 1 | 0.8 to 1 | 1.0 to 1 |
| NET POSITION TREND: | |||
| – Strength Index Score (3 Year Range Pct): | 59.5 | 53.0 | 32.1 |
| – Strength Index Reading (3 Year Range): | Bullish | Bullish | Bearish |
| NET POSITION MOVEMENT INDEX: | |||
| – 6-Week Change in Strength Index: | 2.4 | 2.7 | -10.9 |
Australian Dollar Futures:
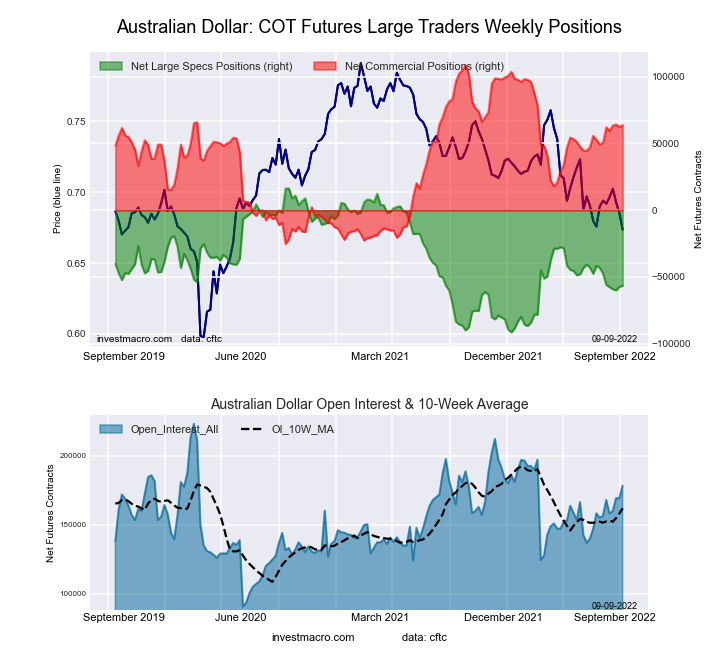 The Australian Dollar large speculator standing this week came in at a net position of -56,500 contracts in the data reported through Tuesday. This was a weekly lift of 893 contracts from the previous week which had a total of -57,393 net contracts.
This week’s current strength score (the trader positioning range over the past three years, measured from 0 to 100) shows the speculators are currently Bearish with a score of 32.4 percent. The commercials are Bullish with a score of 66.5 percent and the small traders (not shown in chart) are Bearish with a score of 34.7 percent.
| AUSTRALIAN DOLLAR Statistics | SPECULATORS | COMMERCIALS | SMALL TRADERS |
| – Percent of Open Interest Longs: | 18.7 | 66.7 | 10.9 |
| – Percent of Open Interest Shorts: | 50.4 | 30.9 | 15.0 |
| – Net Position: | -56,500 | 63,784 | -7,284 |
| – Gross Longs: | 33,305 | 118,817 | 19,403 |
| – Gross Shorts: | 89,805 | 55,033 | 26,687 |
| – Long to Short Ratio: | 0.4 to 1 | 2.2 to 1 | 0.7 to 1 |
| NET POSITION TREND: | |||
| – Strength Index Score (3 Year Range Pct): | 32.4 | 66.5 | 34.7 |
| – Strength Index Reading (3 Year Range): | Bearish | Bullish | Bearish |
| NET POSITION MOVEMENT INDEX: | |||
| – 6-Week Change in Strength Index: | -8.5 | 9.8 | -9.9 |
New Zealand Dollar Futures:
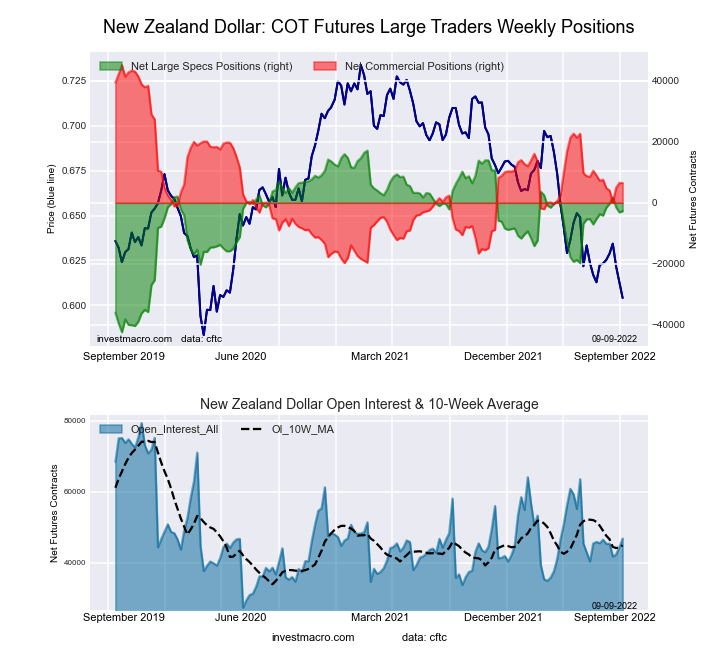 The New Zealand Dollar large speculator standing this week came in at a net position of -2,746 contracts in the data reported through Tuesday. This was a weekly advance of 378 contracts from the previous week which had a total of -3,124 net contracts.
This week’s current strength score (the trader positioning range over the past three years, measured from 0 to 100) shows the speculators are currently Bullish with a score of 66.7 percent. The commercials are Bearish with a score of 40.4 percent and the small traders (not shown in chart) are Bearish-Extreme with a score of 8.5 percent.
| NEW ZEALAND DOLLAR Statistics | SPECULATORS | COMMERCIALS | SMALL TRADERS |
| – Percent of Open Interest Longs: | 36.7 | 55.3 | 5.4 |
| – Percent of Open Interest Shorts: | 42.5 | 41.5 | 13.4 |
| – Net Position: | -2,746 | 6,500 | -3,754 |
| – Gross Longs: | 17,165 | 25,900 | 2,540 |
| – Gross Shorts: | 19,911 | 19,400 | 6,294 |
| – Long to Short Ratio: | 0.9 to 1 | 1.3 to 1 | 0.4 to 1 |
| NET POSITION TREND: | |||
| – Strength Index Score (3 Year Range Pct): | 66.7 | 40.4 | 8.5 |
| – Strength Index Reading (3 Year Range): | Bullish | Bearish | Bearish-Extreme |
| NET POSITION MOVEMENT INDEX: | |||
| – 6-Week Change in Strength Index: | 2.4 | -1.7 | -3.8 |
Mexican Peso Futures:
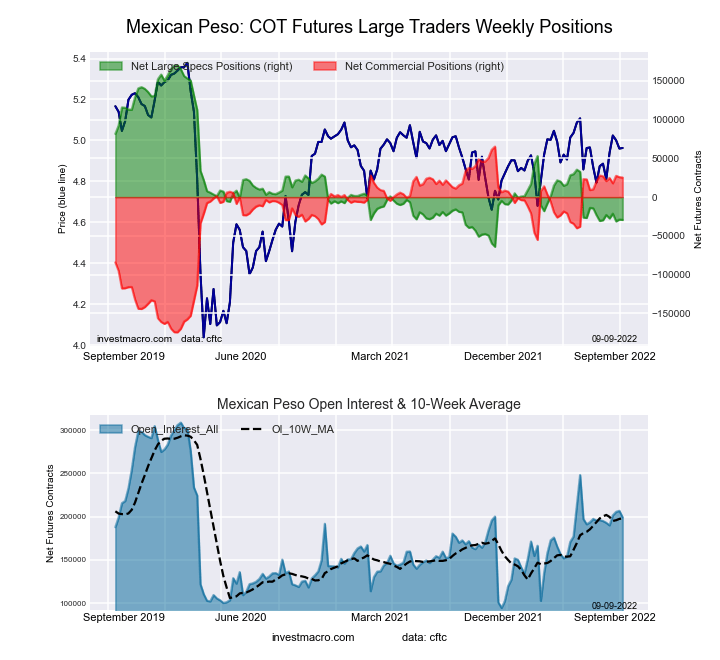 The Mexican Peso large speculator standing this week came in at a net position of -29,460 contracts in the data reported through Tuesday. This was a weekly decline of -430 contracts from the previous week which had a total of -29,030 net contracts.
This week’s current strength score (the trader positioning range over the past three years, measured from 0 to 100) shows the speculators are currently Bearish-Extreme with a score of 14.8 percent. The commercials are Bullish-Extreme with a score of 83.4 percent and the small traders (not shown in chart) are Bullish with a score of 60.6 percent.
| MEXICAN PESO Statistics | SPECULATORS | COMMERCIALS | SMALL TRADERS |
| – Percent of Open Interest Longs: | 48.8 | 45.6 | 3.6 |
| – Percent of Open Interest Shorts: | 63.6 | 32.9 | 1.6 |
| – Net Position: | -29,460 | 25,310 | 4,150 |
| – Gross Longs: | 97,112 | 90,882 | 7,269 |
| – Gross Shorts: | 126,572 | 65,572 | 3,119 |
| – Long to Short Ratio: | 0.8 to 1 | 1.4 to 1 | 2.3 to 1 |
| NET POSITION TREND: | |||
| – Strength Index Score (3 Year Range Pct): | 14.8 | 83.4 | 60.6 |
| – Strength Index Reading (3 Year Range): | Bearish-Extreme | Bullish-Extreme | Bullish |
| NET POSITION MOVEMENT INDEX: | |||
| – 6-Week Change in Strength Index: | 0.2 | -0.6 | 4.7 |
Brazilian Real Futures:
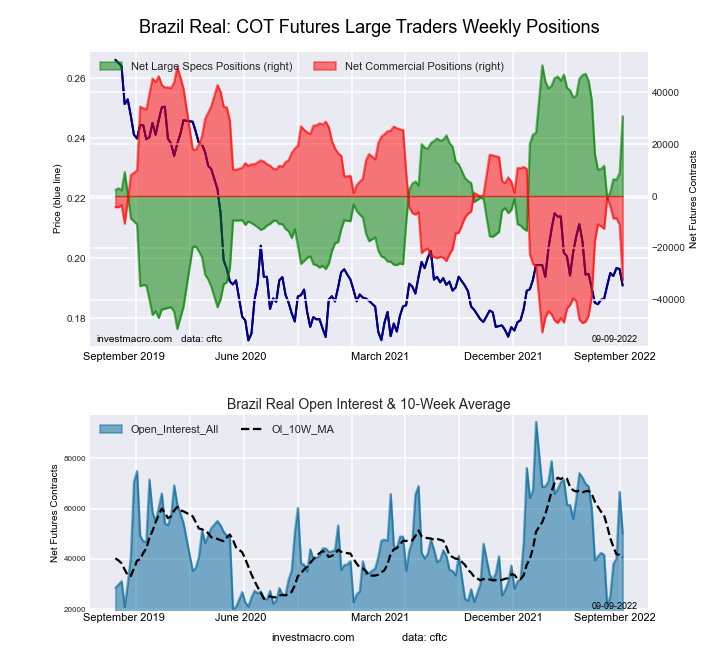 The Brazilian Real large speculator standing this week came in at a net position of 30,860 contracts in the data reported through Tuesday. This was a weekly gain of 22,001 contracts from the previous week which had a total of 8,859 net contracts.
This week’s current strength score (the trader positioning range over the past three years, measured from 0 to 100) shows the speculators are currently Bullish-Extreme with a score of 80.7 percent. The commercials are Bearish-Extreme with a score of 19.6 percent and the small traders (not shown in chart) are Bullish-Extreme with a score of 83.8 percent.
| BRAZIL REAL Statistics | SPECULATORS | COMMERCIALS | SMALL TRADERS |
| – Percent of Open Interest Longs: | 78.9 | 14.4 | 6.7 |
| – Percent of Open Interest Shorts: | 17.2 | 79.3 | 3.5 |
| – Net Position: | 30,860 | -32,482 | 1,622 |
| – Gross Longs: | 39,451 | 7,177 | 3,374 |
| – Gross Shorts: | 8,591 | 39,659 | 1,752 |
| – Long to Short Ratio: | 4.6 to 1 | 0.2 to 1 | 1.9 to 1 |
| NET POSITION TREND: | |||
| – Strength Index Score (3 Year Range Pct): | 80.7 | 19.6 | 83.8 |
| – Strength Index Reading (3 Year Range): | Bullish-Extreme | Bearish-Extreme | Bullish-Extreme |
| NET POSITION MOVEMENT INDEX: | |||
| – 6-Week Change in Strength Index: | 18.8 | -19.4 | 8.5 |
Bitcoin Futures:
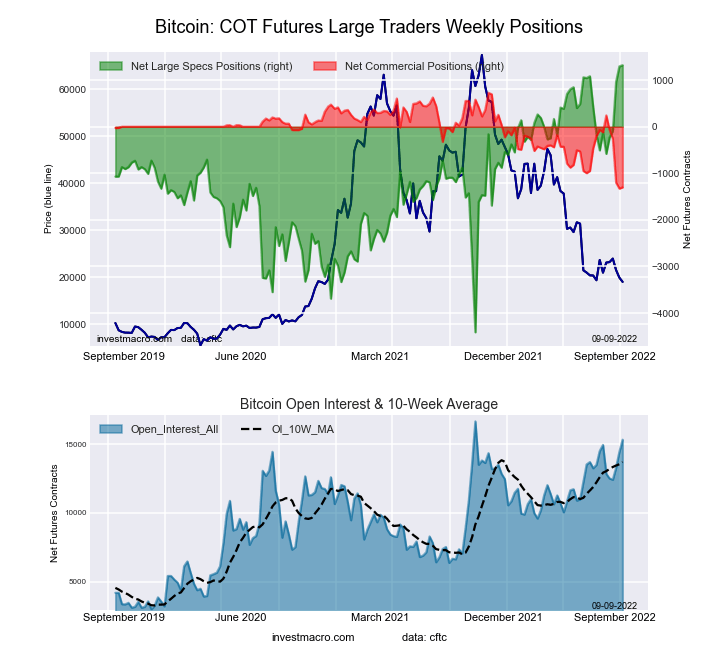 The Bitcoin large speculator standing this week came in at a net position of 1,322 contracts in the data reported through Tuesday. This was a weekly gain of 26 contracts from the previous week which had a total of 1,296 net contracts.
This week’s current strength score (the trader positioning range over the past three years, measured from 0 to 100) shows the speculators are currently Bullish-Extreme with a score of 100.0 percent. The commercials are Bearish-Extreme with a score of 1.3 percent and the small traders (not shown in chart) are Bearish-Extreme with a score of 12.5 percent.
| BITCOIN Statistics | SPECULATORS | COMMERCIALS | SMALL TRADERS |
| – Percent of Open Interest Longs: | 83.1 | 0.4 | 6.2 |
| – Percent of Open Interest Shorts: | 74.5 | 8.9 | 6.4 |
| – Net Position: | 1,322 | -1,301 | -21 |
| – Gross Longs: | 12,743 | 63 | 956 |
| – Gross Shorts: | 11,421 | 1,364 | 977 |
| – Long to Short Ratio: | 1.1 to 1 | 0.0 to 1 | 1.0 to 1 |
| NET POSITION TREND: | |||
| – Strength Index Score (3 Year Range Pct): | 100.0 | 1.3 | 12.5 |
| – Strength Index Reading (3 Year Range): | Bullish-Extreme | Bearish-Extreme | Bearish-Extreme |
| NET POSITION MOVEMENT INDEX: | |||
| – 6-Week Change in Strength Index: | 25.2 | -57.5 | -5.9 |
Article By InvestMacro – Receive our Weekly COT Newsletter by Email
*COT Report: The COT data, released weekly to the public each Friday, is updated through the most recent Tuesday (data is 3 days old) and shows a quick view of how large speculators or non-commercials (for-profit traders) were positioned in the futures markets.
The CFTC categorizes trader positions according to commercial hedgers (traders who use futures contracts for hedging as part of the business), non-commercials (large traders who speculate to realize trading profits) and nonreportable traders (usually small traders/speculators) as well as their open interest (contracts open in the market at time of reporting). See CFTC criteria here.