By InvestMacro
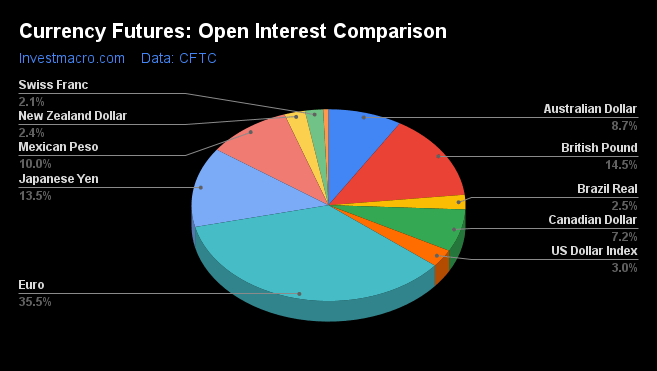
Here are the latest charts and statistics for the Commitment of Traders (COT) data published by the Commodities Futures Trading Commission (CFTC).
The latest COT data is updated through Tuesday September 13th and shows a quick view of how large market participants (for-profit speculators and commercial traders) were positioned in the futures markets. All currency positions are in direct relation to the US dollar where, for example, a bet for the euro is a bet that the euro will rise versus the dollar while a bet against the euro will be a bet that the euro will decline versus the dollar.
Weekly Speculator Changes led lower by Japanese Yen & British Pound Sterling

The COT currency market speculator bets were mostly lower this week as just three out of the eleven currency markets we cover had higher positioning while the other eight markets had lower speculator contracts.
Leading the gains for the currency markets was the Euro (24,512 contracts) with the Mexican peso (4,079 contracts) and the Brazilian real (2,093 contracts) also showing a positive weeks.
The currencies leading the declines in speculator bets this week were the Japanese yen (-22,503 contracts) and the British pound sterling (-17,654 contracts) with the Canadian dollar (-5,485 contracts), Swiss franc (-3,268 contracts), New Zealand dollar (-2,555 contracts), Australian dollar (-1,350 contracts), Bitcoin (-1,196 contracts) and the US Dollar Index (-438 contracts) also registering lower bets on the week.
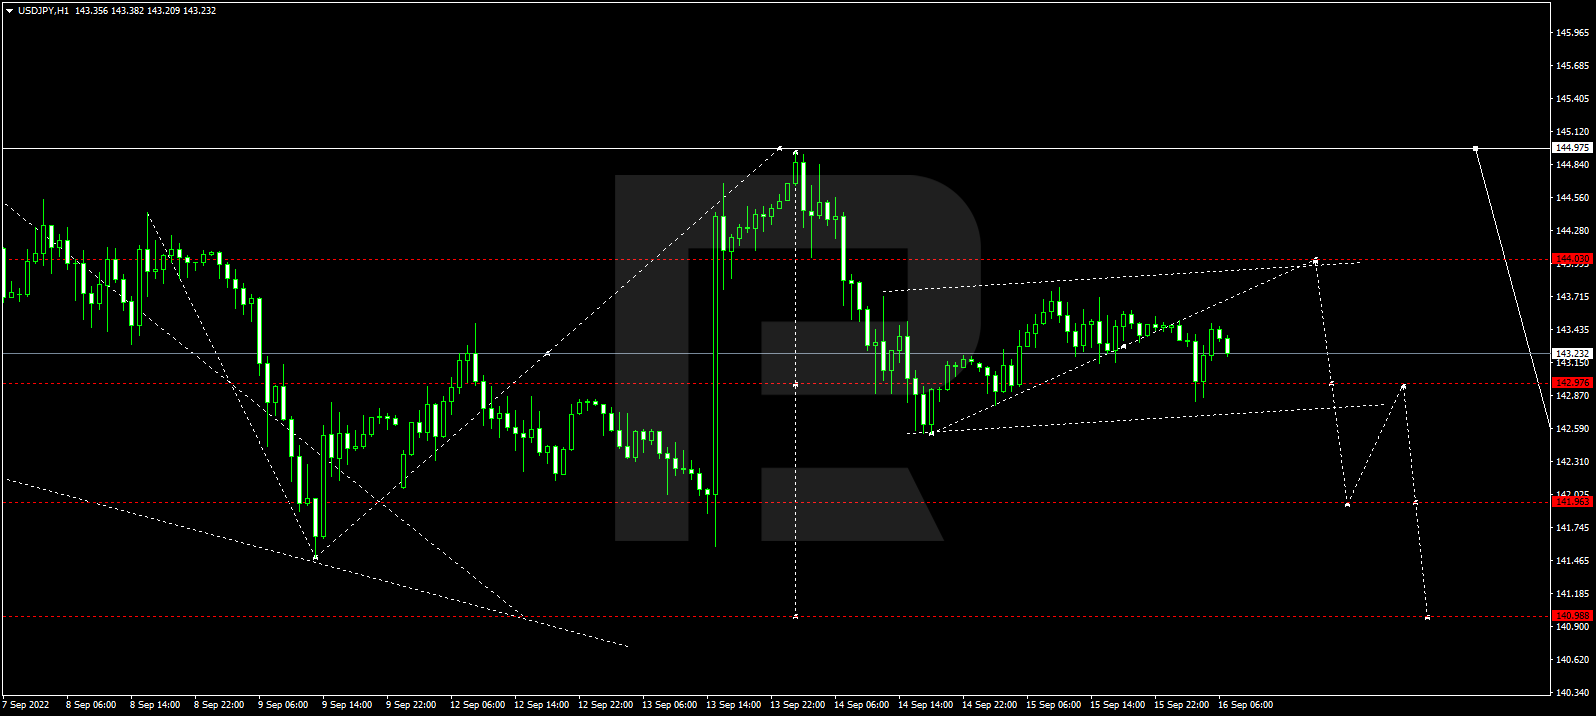
Highlighting the COT currencies this week was the further deterioration of the Japanese yen speculative positions. The yen speculator bets have now fallen for five straight weeks and by a total of -55,660 contracts over that period. This recent weakness followed an improvement in the yen positions in ten out of the previous thirteen weeks through August 9th. The overall speculator standing this week has dipped to the most bearish level of the past fourteen weeks, dating back to June 7th. The USDJPY currency pair has continued to see the dollar surge against the yen with the USDJPY above the 142.90 exchange rate to end the week. The pair has hit a high right below the 145.00 level for two straight weeks which is the highest exchange rate for the dollar versus the yen since September of 1998.
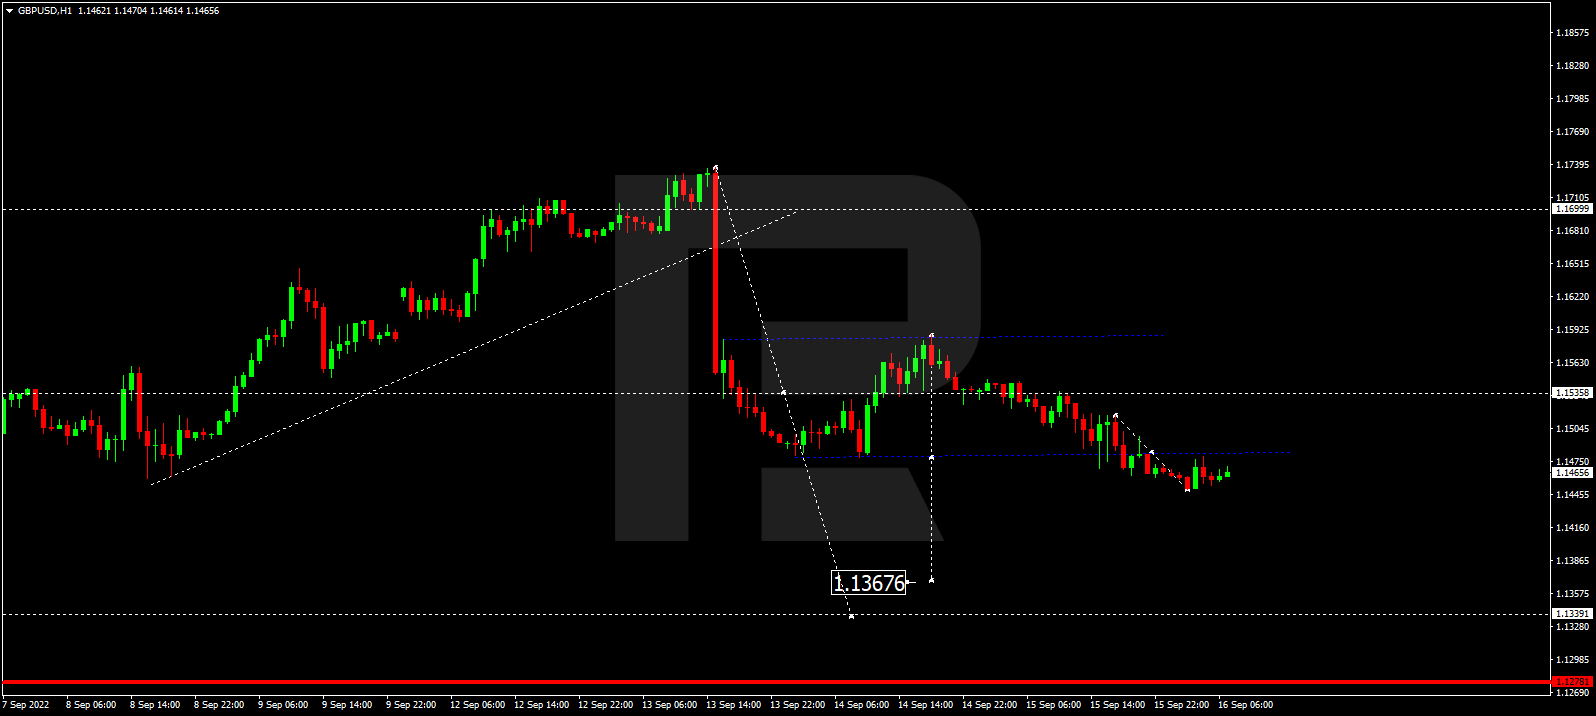
The British pound sterling speculator positions fell for a third consecutive week this week. The sterling bets have now declined by a total of -40,120 contracts over the past three weeks to bring the overall standing to a 14-week low. The GBPUSD currency pair has also dropped to a multi-decade low against the US dollar with the pound hitting a 37-year low this week. The GBPUSD closed the week just above the 1.1400 exchange rate after falling in four out of the past five weeks.
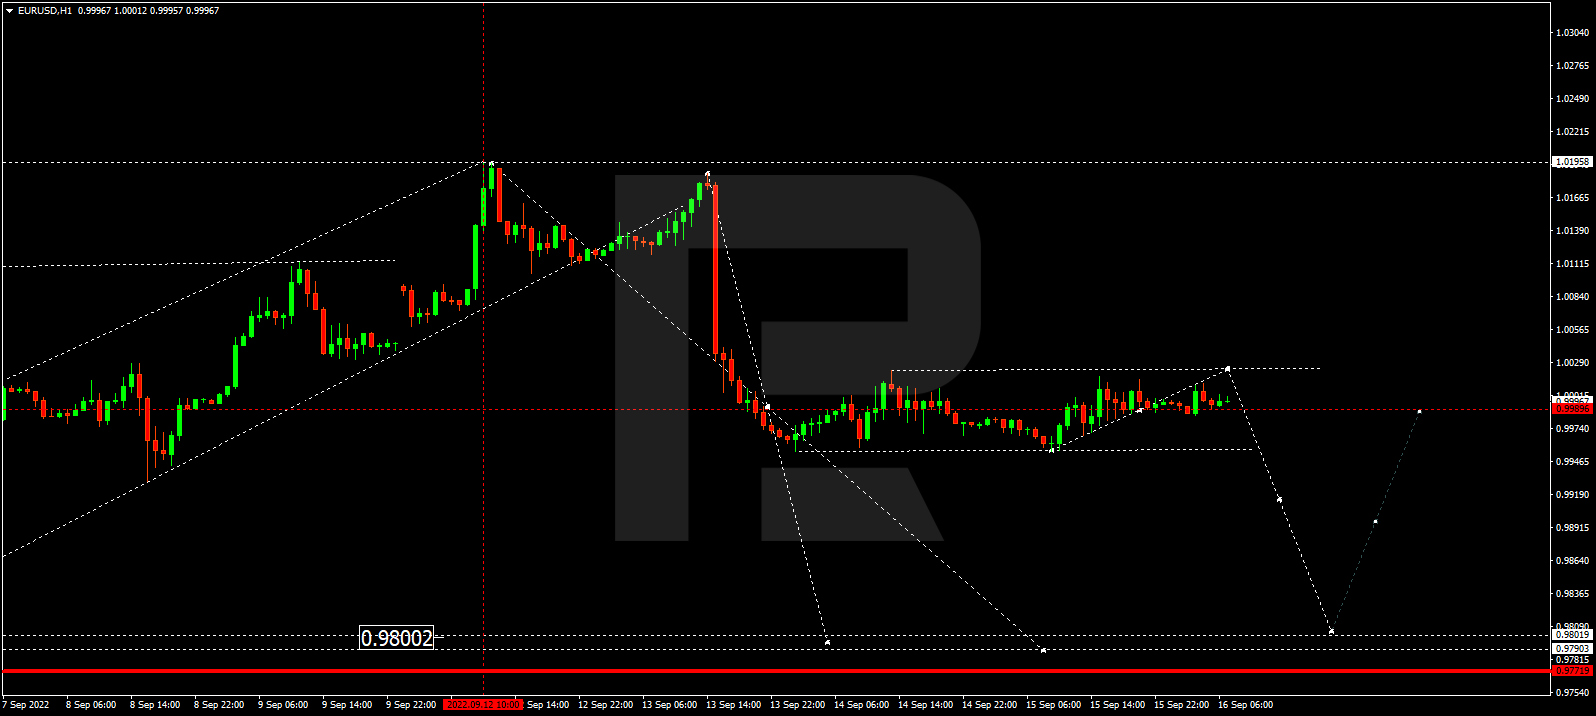
On the positive side of the COT data this week is the Euro. The European common currency bounced back this week with a strong +24,512 contracts and has now risen for two straight weeks. This recent improvement has taken the overall speculator standing to a level of just -11,837 contracts. With the EURUSD currency pair trading virtually at parity as it closed the week at the 1.0017 exchange rate, it is an interesting situation trying to read the large trader positioning. The speculators, especially in currencies, usually exhibit trend following behavior and would be expected to have a position of at least -100,000 contracts in this type of environment.
This could mean the speculators feel that the parity level will be close to the bottom for this pair and it is too risky to add to the short positioning. Or, the speculator short positioning could start to rise if the pair keeps its downtrend below parity. One thing for sure is that there are a huge amount of positions open in the market currently. The open interest level this week of 742,244 contracts is in the 99th percentile of the past three years. We know from open interest analysis that many times turning points coincide with peaks in open interest. However, with a possible recession for the Eurozone on the way combined with strong inflationary pressures and a potential energy crisis from the Russia-Ukraine war, the fundamental backdrop is very cloudy. It will undoubtedly take some time but will be very interesting to see how the large trader positioning and situation resolves itself.
| Sep-13-2022 | OI | OI-Index | Spec-Net | Spec-Index | Com-Net | COM-Index | Smalls-Net | Smalls-Index |
|---|
| USD Index | 62,077 | 93 | 35,669 | 84 | -38,380 | 15 | 2,711 | 46 |
| EUR | 742,244 | 100 | -11,837 | 31 | -11,423 | 73 | 23,260 | 13 |
| GBP | 303,965 | 100 | -68,086 | 11 | 87,325 | 92 | -19,239 | 7 |
| JPY | 281,716 | 100 | -80,692 | 19 | 98,299 | 84 | -17,607 | 18 |
| CHF | 44,853 | 31 | -7,305 | 38 | 16,512 | 70 | -9,207 | 26 |
| CAD | 149,556 | 30 | 12,425 | 53 | -13,476 | 57 | 1,051 | 32 |
| AUD | 182,287 | 69 | -57,850 | 31 | 67,018 | 69 | -9,168 | 30 |
| NZD | 51,079 | 46 | -5,301 | 62 | 9,408 | 45 | -4,107 | 4 |
| MXN | 208,403 | 53 | -25,381 | 17 | 21,333 | 82 | 4,048 | 60 |
| RUB | 20,930 | 4 | 7,543 | 31 | -7,150 | 69 | -393 | 24 |
| BRL | 51,582 | 42 | 32,953 | 83 | -34,577 | 18 | 1,624 | 84 |
| Bitcoin | 13,089 | 74 | 126 | 79 | -320 | 0 | 194 | 17 |
Strength Scores led by US Dollar Index & Brazilian Real
Strength Scores (a normalized measure of Speculator positions over a 3-Year range, from 0 to 100 where above 80 is extreme bullish and below 20 is extreme bearish) showed that the US Dollar Index (84.4 percent) and the Brazilian Real (82.8 percent) lead the currency markets near the top of their respective ranges and both are in bullish extreme positions (above 80 percent). Bitcoin (79.1 percent) comes in as the next highest in the currency markets in strength scores followed by the New Zealand Dollar (62.4 percent).
On the downside, the British Pound Sterling (10.9 percent), Mexican Peso (16.5 percent) and the Japanese Yen (19.2 percent) all come in at the lowest strength levels and all three are in bearish extreme levels (below 20 percent).
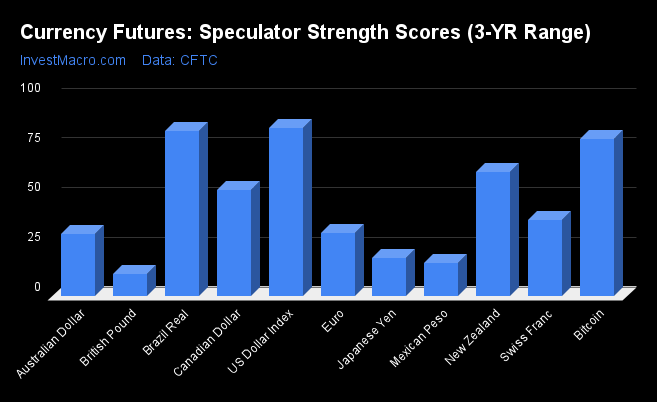
Strength Statistics:
US Dollar Index (84.4 percent) vs US Dollar Index previous week (85.2 percent)
EuroFX (31.4 percent) vs EuroFX previous week (23.8 percent)
British Pound Sterling (10.9 percent) vs British Pound Sterling previous week (26.0 percent)
Japanese Yen (19.2 percent) vs Japanese Yen previous week (33.0 percent)
Swiss Franc (38.0 percent) vs Swiss Franc previous week (46.3 percent)
Canadian Dollar (53.3 percent) vs Canadian Dollar previous week (59.5 percent)
Australian Dollar (31.2 percent) vs Australian Dollar previous week (32.4 percent)
New Zealand Dollar (62.4 percent) vs New Zealand Dollar previous week (66.7 percent)
Mexican Peso (16.5 percent) vs Mexican Peso previous week (14.8 percent)
Brazil Real (82.8 percent) vs Brazil Real previous week (80.7 percent)
Bitcoin (79.1 percent) vs Bitcoin previous week (100.0 percent)
Brazilian Real leads the 6-Week Strength Trends
Strength Score Trends (or move index, calculates the 6-week changes in strength scores) show that the Brazilian Real (33.5 percent) leads the past six weeks trends for the currency markets this week. The Swiss Franc (15.2 percent), Bitcoin (12.3 percent) and the Euro (8.3 percent) fill out the only other positive movers in the latest trends data.
The Japanese Yen (-23.4 percent) leads the downside trend scores currently while the next market with lower trend scores were the British Pound Sterling (-10.0 percent) followed by the Canadian Dollar (-8.8 percent), the New Zealand Dollar (-6.3 percent) and the US Dollar Index (-6.1 percent).
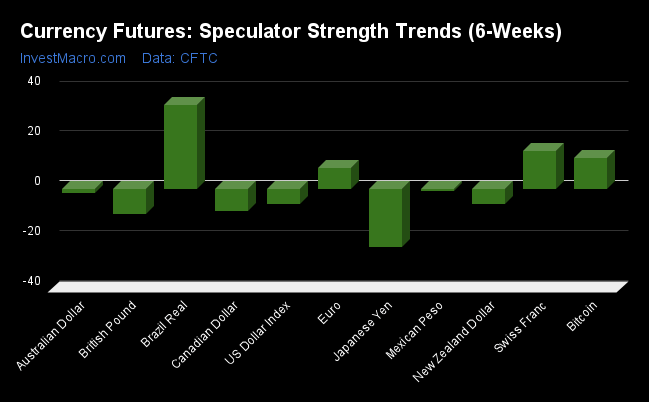
Strength Trend Statistics:
US Dollar Index (-6.1 percent) vs US Dollar Index previous week (-7.4 percent)
EuroFX (8.3 percent) vs EuroFX previous week (1.6 percent)
British Pound Sterling (-10.0 percent) vs British Pound Sterling previous week (3.0 percent)
Japanese Yen (-23.4 percent) vs Japanese Yen previous week (2.0 percent)
Swiss Franc (15.2 percent) vs Swiss Franc previous week (18.4 percent)
Canadian Dollar (-8.8 percent) vs Canadian Dollar previous week (2.4 percent)
Australian Dollar (-1.8 percent) vs Australian Dollar previous week (-8.5 percent)
New Zealand Dollar (-6.3 percent) vs New Zealand Dollar previous week (2.4 percent)
Mexican Peso (-1.0 percent) vs Mexican Peso previous week (0.2 percent)
Brazil Real (33.5 percent) vs Brazil Real previous week (18.8 percent)
Bitcoin (12.3 percent) vs Bitcoin previous week (25.2 percent)
Individual Markets:
US Dollar Index Futures:
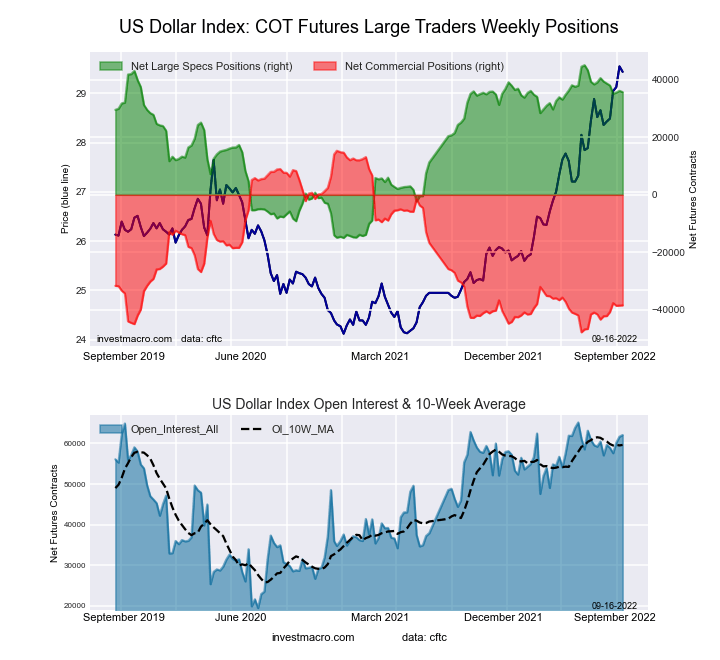 The US Dollar Index large speculator standing this week came in at a net position of 35,669 contracts in the data reported through Tuesday. This was a weekly decline of -438 contracts from the previous week which had a total of 36,107 net contracts.
This week’s current strength score (the trader positioning range over the past three years, measured from 0 to 100) shows the speculators are currently Bullish-Extreme with a score of 84.4 percent. The commercials are Bearish-Extreme with a score of 14.8 percent and the small traders (not shown in chart) are Bearish with a score of 46.2 percent.
| US DOLLAR INDEX Statistics | SPECULATORS | COMMERCIALS | SMALL TRADERS |
| – Percent of Open Interest Longs: | 78.9 | 9.1 | 8.6 |
| – Percent of Open Interest Shorts: | 21.4 | 70.9 | 4.2 |
| – Net Position: | 35,669 | -38,380 | 2,711 |
| – Gross Longs: | 48,984 | 5,647 | 5,342 |
| – Gross Shorts: | 13,315 | 44,027 | 2,631 |
| – Long to Short Ratio: | 3.7 to 1 | 0.1 to 1 | 2.0 to 1 |
| NET POSITION TREND: | | | |
| – Strength Index Score (3 Year Range Pct): | 84.4 | 14.8 | 46.2 |
| – Strength Index Reading (3 Year Range): | Bullish-Extreme | Bearish-Extreme | Bearish |
| NET POSITION MOVEMENT INDEX: | | | |
| – 6-Week Change in Strength Index: | -6.1 | 6.0 | -1.1 |
Euro Currency Futures:
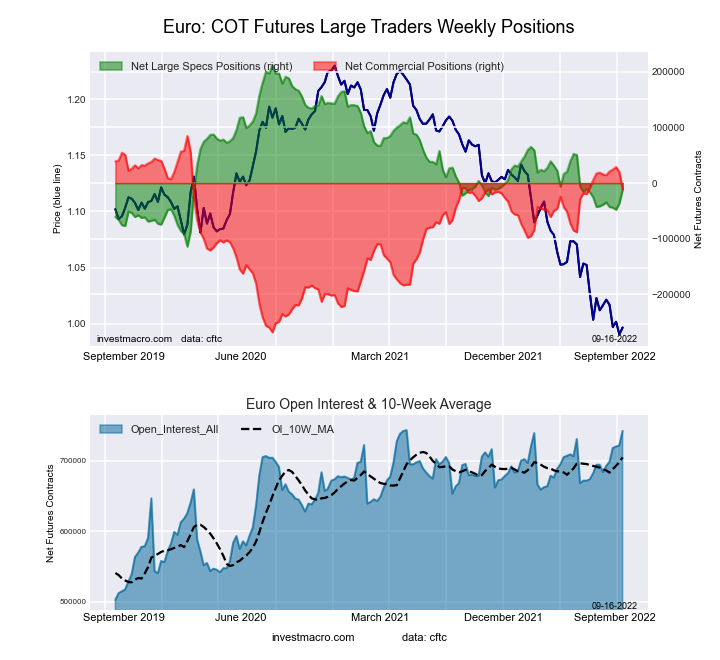 The Euro Currency large speculator standing this week came in at a net position of -11,837 contracts in the data reported through Tuesday. This was a weekly boost of 24,512 contracts from the previous week which had a total of -36,349 net contracts.
This week’s current strength score (the trader positioning range over the past three years, measured from 0 to 100) shows the speculators are currently Bearish with a score of 31.4 percent. The commercials are Bullish with a score of 72.8 percent and the small traders (not shown in chart) are Bearish-Extreme with a score of 12.9 percent.
| EURO Currency Statistics | SPECULATORS | COMMERCIALS | SMALL TRADERS |
| – Percent of Open Interest Longs: | 28.0 | 55.3 | 12.0 |
| – Percent of Open Interest Shorts: | 29.6 | 56.8 | 8.8 |
| – Net Position: | -11,837 | -11,423 | 23,260 |
| – Gross Longs: | 207,778 | 410,364 | 88,806 |
| – Gross Shorts: | 219,615 | 421,787 | 65,546 |
| – Long to Short Ratio: | 0.9 to 1 | 1.0 to 1 | 1.4 to 1 |
| NET POSITION TREND: | | | |
| – Strength Index Score (3 Year Range Pct): | 31.4 | 72.8 | 12.9 |
| – Strength Index Reading (3 Year Range): | Bearish | Bullish | Bearish-Extreme |
| NET POSITION MOVEMENT INDEX: | | | |
| – 6-Week Change in Strength Index: | 8.3 | -7.6 | -0.1 |
British Pound Sterling Futures:
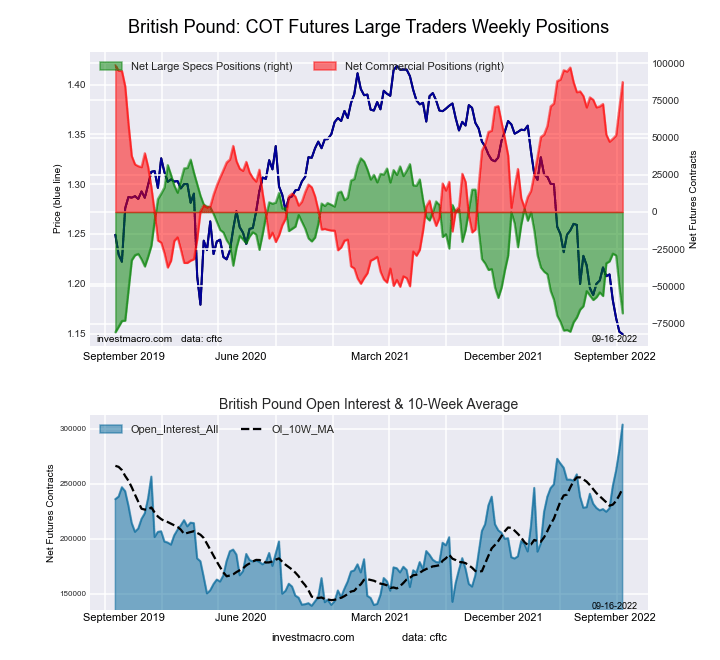 The British Pound Sterling large speculator standing this week came in at a net position of -68,086 contracts in the data reported through Tuesday. This was a weekly decrease of -17,654 contracts from the previous week which had a total of -50,432 net contracts.
This week’s current strength score (the trader positioning range over the past three years, measured from 0 to 100) shows the speculators are currently Bearish-Extreme with a score of 10.9 percent. The commercials are Bullish-Extreme with a score of 92.4 percent and the small traders (not shown in chart) are Bearish-Extreme with a score of 7.1 percent.
| BRITISH POUND Statistics | SPECULATORS | COMMERCIALS | SMALL TRADERS |
| – Percent of Open Interest Longs: | 13.5 | 76.4 | 7.0 |
| – Percent of Open Interest Shorts: | 35.9 | 47.7 | 13.3 |
| – Net Position: | -68,086 | 87,325 | -19,239 |
| – Gross Longs: | 41,129 | 232,346 | 21,161 |
| – Gross Shorts: | 109,215 | 145,021 | 40,400 |
| – Long to Short Ratio: | 0.4 to 1 | 1.6 to 1 | 0.5 to 1 |
| NET POSITION TREND: | | | |
| – Strength Index Score (3 Year Range Pct): | 10.9 | 92.4 | 7.1 |
| – Strength Index Reading (3 Year Range): | Bearish-Extreme | Bullish-Extreme | Bearish-Extreme |
| NET POSITION MOVEMENT INDEX: | | | |
| – 6-Week Change in Strength Index: | -10.0 | 9.9 | -7.0 |
Japanese Yen Futures:
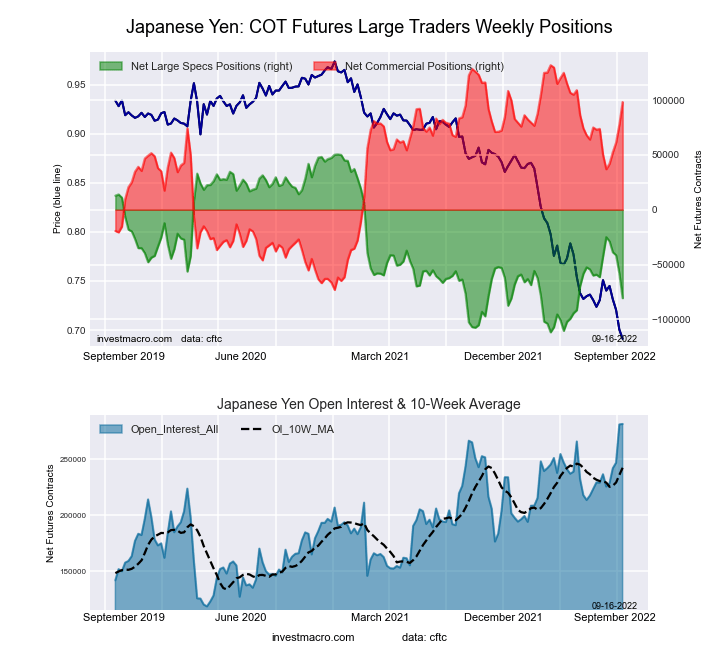 The Japanese Yen large speculator standing this week came in at a net position of -80,692 contracts in the data reported through Tuesday. This was a weekly decline of -22,503 contracts from the previous week which had a total of -58,189 net contracts.
This week’s current strength score (the trader positioning range over the past three years, measured from 0 to 100) shows the speculators are currently Bearish-Extreme with a score of 19.2 percent. The commercials are Bullish-Extreme with a score of 83.6 percent and the small traders (not shown in chart) are Bearish-Extreme with a score of 17.7 percent.
| JAPANESE YEN Statistics | SPECULATORS | COMMERCIALS | SMALL TRADERS |
| – Percent of Open Interest Longs: | 14.0 | 75.4 | 8.2 |
| – Percent of Open Interest Shorts: | 42.6 | 40.5 | 14.5 |
| – Net Position: | -80,692 | 98,299 | -17,607 |
| – Gross Longs: | 39,323 | 212,375 | 23,186 |
| – Gross Shorts: | 120,015 | 114,076 | 40,793 |
| – Long to Short Ratio: | 0.3 to 1 | 1.9 to 1 | 0.6 to 1 |
| NET POSITION TREND: | | | |
| – Strength Index Score (3 Year Range Pct): | 19.2 | 83.6 | 17.7 |
| – Strength Index Reading (3 Year Range): | Bearish-Extreme | Bullish-Extreme | Bearish-Extreme |
| NET POSITION MOVEMENT INDEX: | | | |
| – 6-Week Change in Strength Index: | -23.4 | 23.4 | -20.5 |
Swiss Franc Futures:
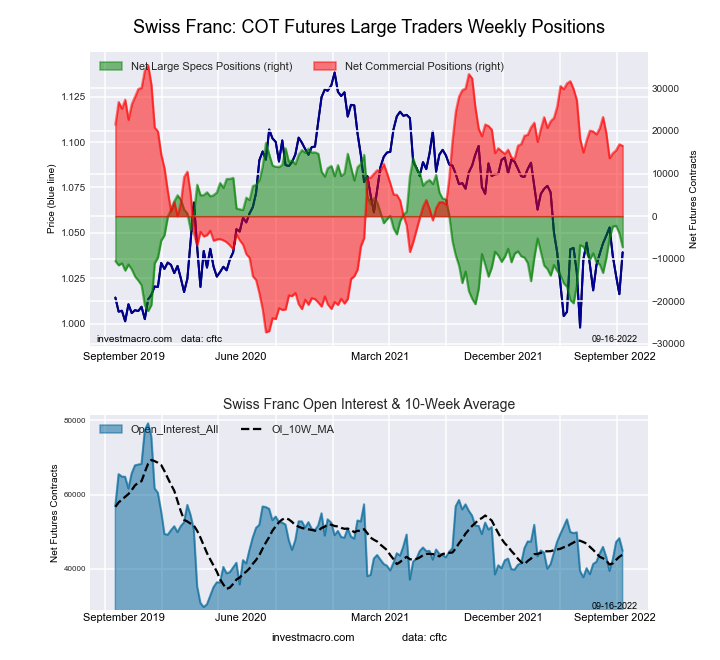 The Swiss Franc large speculator standing this week came in at a net position of -7,305 contracts in the data reported through Tuesday. This was a weekly decrease of -3,268 contracts from the previous week which had a total of -4,037 net contracts.
This week’s current strength score (the trader positioning range over the past three years, measured from 0 to 100) shows the speculators are currently Bearish with a score of 38.0 percent. The commercials are Bullish with a score of 69.8 percent and the small traders (not shown in chart) are Bearish with a score of 26.4 percent.
| SWISS FRANC Statistics | SPECULATORS | COMMERCIALS | SMALL TRADERS |
| – Percent of Open Interest Longs: | 17.2 | 60.2 | 20.9 |
| – Percent of Open Interest Shorts: | 33.5 | 23.4 | 41.4 |
| – Net Position: | -7,305 | 16,512 | -9,207 |
| – Gross Longs: | 7,704 | 26,988 | 9,355 |
| – Gross Shorts: | 15,009 | 10,476 | 18,562 |
| – Long to Short Ratio: | 0.5 to 1 | 2.6 to 1 | 0.5 to 1 |
| NET POSITION TREND: | | | |
| – Strength Index Score (3 Year Range Pct): | 38.0 | 69.8 | 26.4 |
| – Strength Index Reading (3 Year Range): | Bearish | Bullish | Bearish |
| NET POSITION MOVEMENT INDEX: | | | |
| – 6-Week Change in Strength Index: | 15.2 | -10.8 | 2.6 |
Canadian Dollar Futures:
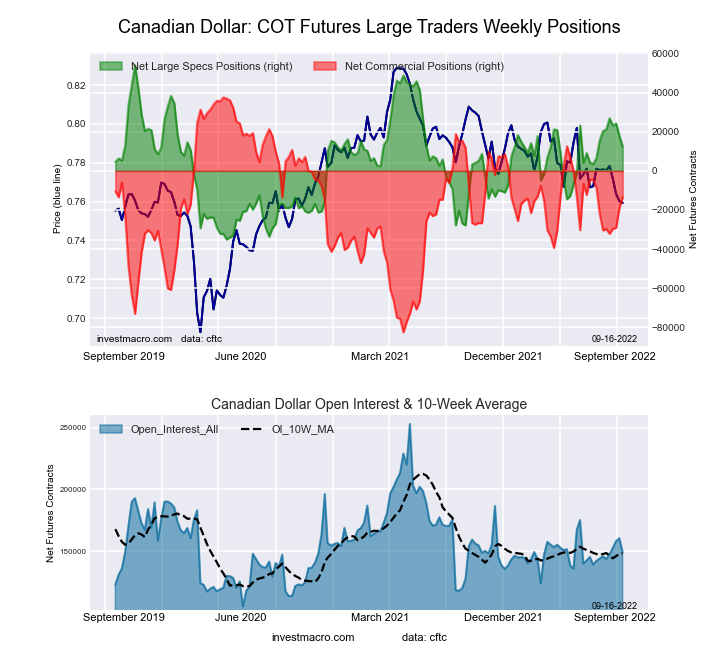 The Canadian Dollar large speculator standing this week came in at a net position of 12,425 contracts in the data reported through Tuesday. This was a weekly lowering of -5,485 contracts from the previous week which had a total of 17,910 net contracts.
This week’s current strength score (the trader positioning range over the past three years, measured from 0 to 100) shows the speculators are currently Bullish with a score of 53.3 percent. The commercials are Bullish with a score of 57.5 percent and the small traders (not shown in chart) are Bearish with a score of 32.2 percent.
| CANADIAN DOLLAR Statistics | SPECULATORS | COMMERCIALS | SMALL TRADERS |
| – Percent of Open Interest Longs: | 32.2 | 44.7 | 20.7 |
| – Percent of Open Interest Shorts: | 23.9 | 53.7 | 20.0 |
| – Net Position: | 12,425 | -13,476 | 1,051 |
| – Gross Longs: | 48,102 | 66,866 | 30,933 |
| – Gross Shorts: | 35,677 | 80,342 | 29,882 |
| – Long to Short Ratio: | 1.3 to 1 | 0.8 to 1 | 1.0 to 1 |
| NET POSITION TREND: | | | |
| – Strength Index Score (3 Year Range Pct): | 53.3 | 57.5 | 32.2 |
| – Strength Index Reading (3 Year Range): | Bullish | Bullish | Bearish |
| NET POSITION MOVEMENT INDEX: | | | |
| – 6-Week Change in Strength Index: | -8.8 | 14.1 | -18.3 |
Australian Dollar Futures:
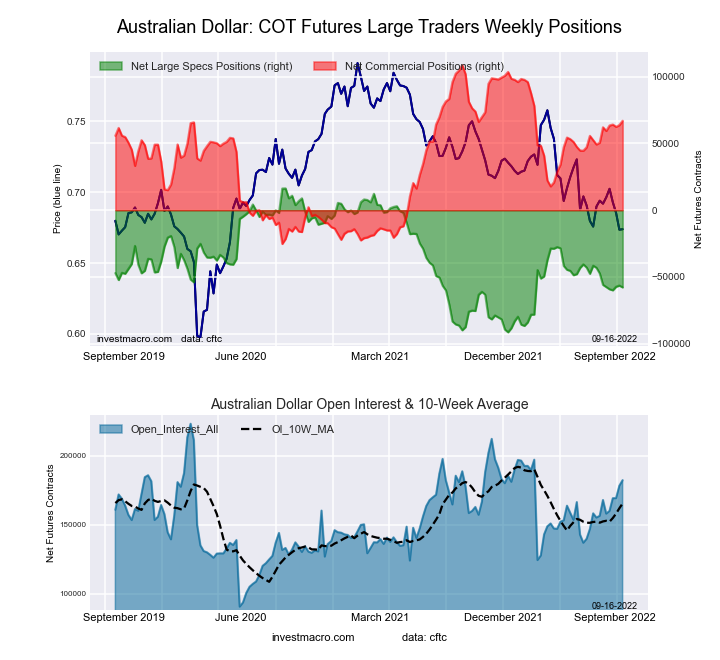 The Australian Dollar large speculator standing this week came in at a net position of -57,850 contracts in the data reported through Tuesday. This was a weekly lowering of -1,350 contracts from the previous week which had a total of -56,500 net contracts.
This week’s current strength score (the trader positioning range over the past three years, measured from 0 to 100) shows the speculators are currently Bearish with a score of 31.2 percent. The commercials are Bullish with a score of 68.9 percent and the small traders (not shown in chart) are Bearish with a score of 30.1 percent.
| AUSTRALIAN DOLLAR Statistics | SPECULATORS | COMMERCIALS | SMALL TRADERS |
| – Percent of Open Interest Longs: | 16.0 | 66.0 | 12.1 |
| – Percent of Open Interest Shorts: | 47.8 | 29.3 | 17.1 |
| – Net Position: | -57,850 | 67,018 | -9,168 |
| – Gross Longs: | 29,218 | 120,393 | 22,049 |
| – Gross Shorts: | 87,068 | 53,375 | 31,217 |
| – Long to Short Ratio: | 0.3 to 1 | 2.3 to 1 | 0.7 to 1 |
| NET POSITION TREND: | | | |
| – Strength Index Score (3 Year Range Pct): | 31.2 | 68.9 | 30.1 |
| – Strength Index Reading (3 Year Range): | Bearish | Bullish | Bearish |
| NET POSITION MOVEMENT INDEX: | | | |
| – 6-Week Change in Strength Index: | -1.8 | 3.7 | -7.3 |
New Zealand Dollar Futures:
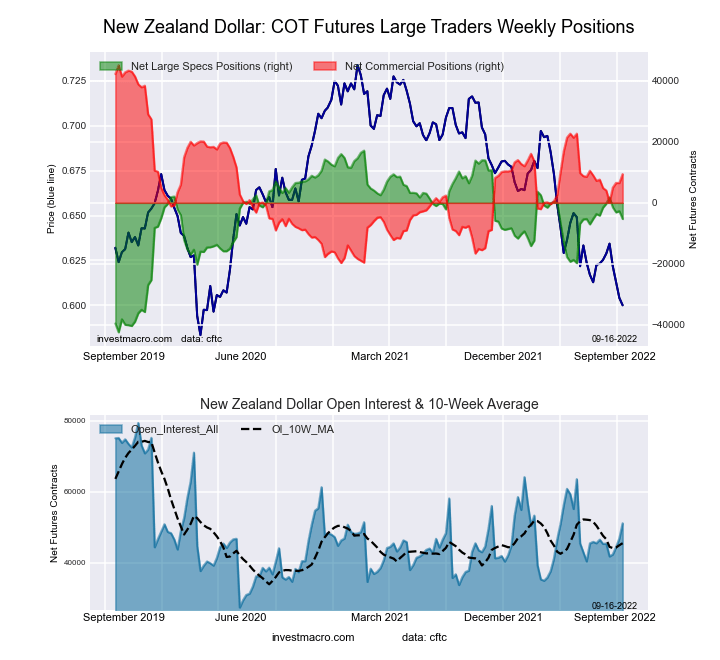 The New Zealand Dollar large speculator standing this week came in at a net position of -5,301 contracts in the data reported through Tuesday. This was a weekly decrease of -2,555 contracts from the previous week which had a total of -2,746 net contracts.
This week’s current strength score (the trader positioning range over the past three years, measured from 0 to 100) shows the speculators are currently Bullish with a score of 62.4 percent. The commercials are Bearish with a score of 44.9 percent and the small traders (not shown in chart) are Bearish-Extreme with a score of 4.4 percent.
| NEW ZEALAND DOLLAR Statistics | SPECULATORS | COMMERCIALS | SMALL TRADERS |
| – Percent of Open Interest Longs: | 35.1 | 53.8 | 4.9 |
| – Percent of Open Interest Shorts: | 45.5 | 35.3 | 12.9 |
| – Net Position: | -5,301 | 9,408 | -4,107 |
| – Gross Longs: | 17,949 | 27,458 | 2,498 |
| – Gross Shorts: | 23,250 | 18,050 | 6,605 |
| – Long to Short Ratio: | 0.8 to 1 | 1.5 to 1 | 0.4 to 1 |
| NET POSITION TREND: | | | |
| – Strength Index Score (3 Year Range Pct): | 62.4 | 44.9 | 4.4 |
| – Strength Index Reading (3 Year Range): | Bullish | Bearish | Bearish-Extreme |
| NET POSITION MOVEMENT INDEX: | | | |
| – 6-Week Change in Strength Index: | -6.3 | 7.0 | -9.5 |
Mexican Peso Futures:
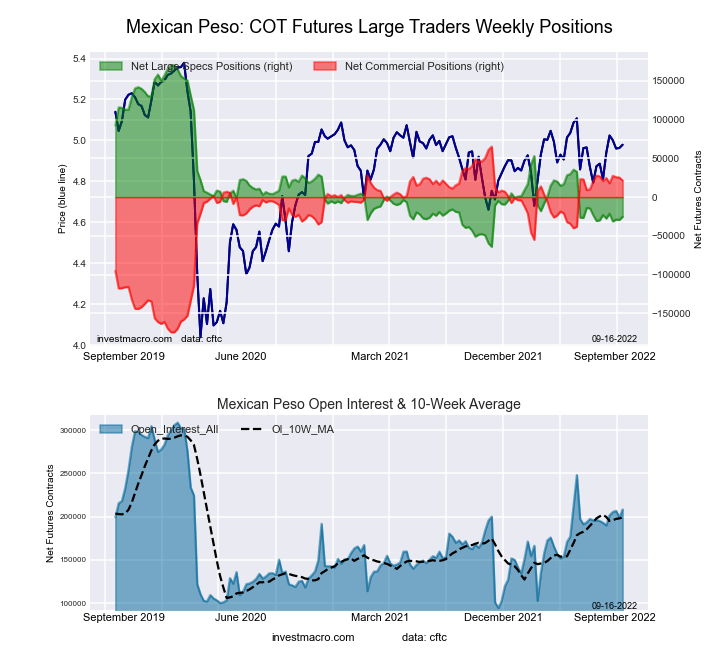 The Mexican Peso large speculator standing this week came in at a net position of -25,381 contracts in the data reported through Tuesday. This was a weekly boost of 4,079 contracts from the previous week which had a total of -29,460 net contracts.
This week’s current strength score (the trader positioning range over the past three years, measured from 0 to 100) shows the speculators are currently Bearish-Extreme with a score of 16.5 percent. The commercials are Bullish-Extreme with a score of 81.7 percent and the small traders (not shown in chart) are Bullish with a score of 60.2 percent.
| MEXICAN PESO Statistics | SPECULATORS | COMMERCIALS | SMALL TRADERS |
| – Percent of Open Interest Longs: | 49.8 | 42.8 | 3.6 |
| – Percent of Open Interest Shorts: | 62.0 | 32.6 | 1.6 |
| – Net Position: | -25,381 | 21,333 | 4,048 |
| – Gross Longs: | 103,772 | 89,260 | 7,469 |
| – Gross Shorts: | 129,153 | 67,927 | 3,421 |
| – Long to Short Ratio: | 0.8 to 1 | 1.3 to 1 | 2.2 to 1 |
| NET POSITION TREND: | | | |
| – Strength Index Score (3 Year Range Pct): | 16.5 | 81.7 | 60.2 |
| – Strength Index Reading (3 Year Range): | Bearish-Extreme | Bullish-Extreme | Bullish |
| NET POSITION MOVEMENT INDEX: | | | |
| – 6-Week Change in Strength Index: | -1.0 | 0.3 | 7.2 |
Brazilian Real Futures:
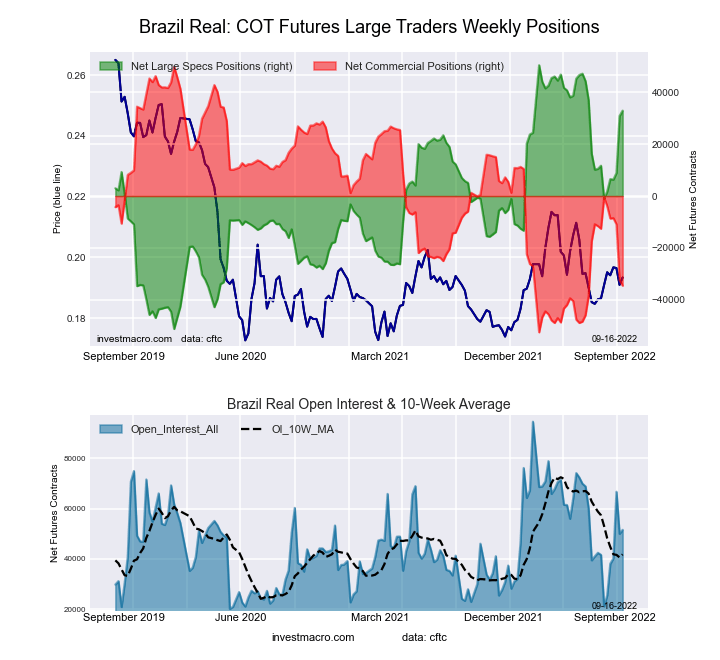 The Brazilian Real large speculator standing this week came in at a net position of 32,953 contracts in the data reported through Tuesday. This was a weekly gain of 2,093 contracts from the previous week which had a total of 30,860 net contracts.
This week’s current strength score (the trader positioning range over the past three years, measured from 0 to 100) shows the speculators are currently Bullish-Extreme with a score of 82.8 percent. The commercials are Bearish-Extreme with a score of 17.5 percent and the small traders (not shown in chart) are Bullish-Extreme with a score of 83.8 percent.
| BRAZIL REAL Statistics | SPECULATORS | COMMERCIALS | SMALL TRADERS |
| – Percent of Open Interest Longs: | 81.8 | 12.0 | 6.2 |
| – Percent of Open Interest Shorts: | 17.9 | 79.0 | 3.1 |
| – Net Position: | 32,953 | -34,577 | 1,624 |
| – Gross Longs: | 42,192 | 6,186 | 3,203 |
| – Gross Shorts: | 9,239 | 40,763 | 1,579 |
| – Long to Short Ratio: | 4.6 to 1 | 0.2 to 1 | 2.0 to 1 |
| NET POSITION TREND: | | | |
| – Strength Index Score (3 Year Range Pct): | 82.8 | 17.5 | 83.8 |
| – Strength Index Reading (3 Year Range): | Bullish-Extreme | Bearish-Extreme | Bullish-Extreme |
| NET POSITION MOVEMENT INDEX: | | | |
| – 6-Week Change in Strength Index: | 33.5 | -33.2 | -0.8 |
Bitcoin Futures:
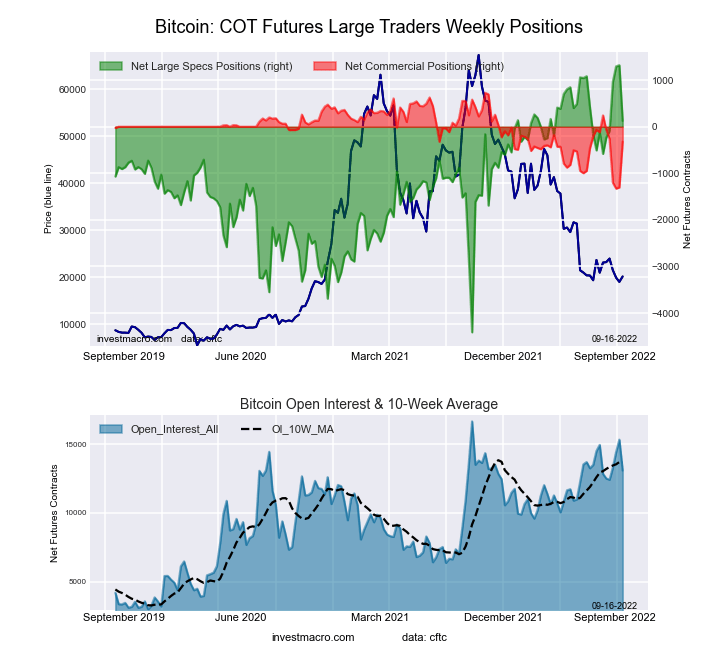 The Bitcoin large speculator standing this week came in at a net position of 126 contracts in the data reported through Tuesday. This was a weekly lowering of -1,196 contracts from the previous week which had a total of 1,322 net contracts.
This week’s current strength score (the trader positioning range over the past three years, measured from 0 to 100) shows the speculators are currently Bullish with a score of 79.1 percent. The commercials are Bearish with a score of 49.0 percent and the small traders (not shown in chart) are Bearish-Extreme with a score of 17.3 percent.
| BITCOIN Statistics | SPECULATORS | COMMERCIALS | SMALL TRADERS |
| – Percent of Open Interest Longs: | 78.4 | 4.2 | 7.2 |
| – Percent of Open Interest Shorts: | 77.5 | 6.6 | 5.7 |
| – Net Position: | 126 | -320 | 194 |
| – Gross Longs: | 10,268 | 546 | 944 |
| – Gross Shorts: | 10,142 | 866 | 750 |
| – Long to Short Ratio: | 1.0 to 1 | 0.6 to 1 | 1.3 to 1 |
| NET POSITION TREND: | | | |
| – Strength Index Score (3 Year Range Pct): | 79.1 | 49.0 | 17.3 |
| – Strength Index Reading (3 Year Range): | Bullish | Bearish | Bearish-Extreme |
| NET POSITION MOVEMENT INDEX: | | | |
| – 6-Week Change in Strength Index: | 12.3 | -27.4 | -3.3 |
Article By InvestMacro – Receive our weekly COT Reports by Email
*COT Report: The COT excel data, released weekly to the public each Friday, is updated through the most recent Tuesday (data is 3 days old) and shows a quick view of how large speculators or non-commercials (for-profit traders) were positioned in the futures markets.
The CFTC categorizes trader positions according to commercial hedgers (traders who use futures contracts for hedging as part of the business), non-commercials (large traders who speculate to realize trading profits) and nonreportable traders (usually small traders/speculators) as well as their open interest (contracts open in the market at time of reporting). See CFTC criteria here.