WTI Crude, Brent Oil and Gasoline lead COT Energy Speculators bets lower

By InvestMacro | COT | Data Tables | COT Leaders | Downloads | COT Newsletter

Energy Futures Open Interest Comparison(1)

Here are the latest charts and statistics for the Commitment of Traders (COT) data published by the Commodities Futures Trading Commission (CFTC).

The latest COT data is updated through Tuesday August 30th and shows a quick view of how large traders (for-profit speculators and commercial entities) were positioned in the futures markets.

WTI Crude Oil, Brent and Gasoline lead Weekly Speculator Changes lower

The COT energy market speculator bets were lower this week as two out of the six energy markets we cover had higher positioning this week while the other two markets had lower contracts.

Leading the gains for energy markets was Heating Oil (3,373 contracts) with the Bloomberg Commodity Index (98 contracts) also showing a positive week.

The energy market leading the declines in speculator bets this week was WTI Crude Oil (-17,031 contracts) with Brent Crude Oil (-3,589 contracts), Gasoline (-3,088 contracts) and Natural Gas (-155 contracts) also registering lower bets on the week.

Energy Futures Speculator Net Position Changes


Data Snapshot of Commodity Market Traders | Columns Legend
Aug-30-2022OIOI-IndexSpec-NetSpec-IndexCom-NetCOM-IndexSmalls-NetSmalls-Index
WTI Crude1,470,2070229,1895-256,2489527,05948
Gold459,1652117,73410-129,6799211,9452
Silver138,7146-8,27102651008,0068
Copper158,3900-23,2551924,98583-1,73015
Palladium5,8750-1,129161,32382-19433
Platinum70,74740-5,3781646994,73228
Natural Gas978,8814-128,7654092,4636036,30266
Brent180,95224-40,0134436,585543,42856
Heating Oil283,4272925,19679-43,7612518,56563
Soybeans605,924783,56240-52,79168-30,77119
Corn1,267,7350283,39766-225,75940-57,63810
Coffee193,889748,68781-50,983232,29621
Sugar752,642962,55149-72,5935410,04220
Wheat288,5450-11,499414,91481-3,41593


Heating Oil leads the Strength Scores

Strength Scores (a normalized measure of Speculator positions over a 3-Year range, from 0 to 100 where above 80 is extreme bullish and below 20 is extreme bearish) showed that Heating Oil (79.5 percent) leads the energy markets and is just under the bullish extreme position threshold (above 80 percent). The Bloomberg Commodity Index (59.4 percent) comes in as the next highest energy market in strength scores.

On the downside, WTI Crude Oil (4.9 percent) comes in at the lowest strength level currently and is in a bearish extreme position (below 20 percent). The next lowest is Gasoline (21.7 percent) followed by Natural Gas (39.9 percent) and Brent Crude Oil (44.0 percent).


Strength Statistics:
WTI Crude Oil (4.9 percent) vs WTI Crude Oil previous week (9.4 percent)
Brent Crude Oil (44.0 percent) vs Brent Crude Oil previous week (50.1 percent)
Natural Gas (39.9 percent) vs Natural Gas previous week (40.0 percent)
Gasoline (21.7 percent) vs Gasoline previous week (24.8 percent)
Heating Oil (79.5 percent) vs Heating Oil previous week (74.5 percent)
Bloomberg Commodity Index (59.4 percent) vs Bloomberg Commodity Index previous week (59.0 percent)

Heating Oil also leads the 6-Week Strength Trends

Strength Score Trends (or move index, calculates the 6-week changes in strength scores) show that Heating Oil (23.5 percent) leads the past six weeks trends for energy this week. Gasoline (9.9 percent), the Bloomberg Commodity Index (6.0 percent) and Brent Crude Oil (2.2 percent) round out the rest of the positive movers in the latest trends data.

WTI Crude Oil (-11.1 percent) leads the downside trend scores currently while the next market with lower trend scores was Natural Gas (-2.5 percent).


Energy Futures Speculator Strength Score Trends (6-Weeks)(1)
Strength Trend Statistics:
WTI Crude Oil (-11.1 percent) vs WTI Crude Oil previous week (-5.8 percent)
Brent Crude Oil (2.2 percent) vs Brent Crude Oil previous week (3.3 percent)
Natural Gas (-2.5 percent) vs Natural Gas previous week (0.9 percent)
Gasoline (9.9 percent) vs Gasoline previous week (20.1 percent)
Heating Oil (23.5 percent) vs Heating Oil previous week (22.2 percent)
Bloomberg Commodity Index (6.0 percent) vs Bloomberg Commodity Index previous week (-7.5 percent)


Individual Markets:

WTI Crude Oil Futures:

WTI Crude Oil Futures COT ChartThe WTI Crude Oil Futures large speculator standing this week reached a net position of 229,189 contracts in the data reported through Tuesday. This was a weekly decline of -17,031 contracts from the previous week which had a total of 246,220 net contracts.

This week’s current strength score (the trader positioning range over the past three years, measured from 0 to 100) shows the speculators are currently Bearish-Extreme with a score of 4.9 percent. The commercials are Bullish-Extreme with a score of 95.1 percent and the small traders (not shown in chart) are Bearish with a score of 48.3 percent.

WTI Crude Oil Futures StatisticsSPECULATORSCOMMERCIALSSMALL TRADERS
– Percent of Open Interest Longs:22.640.05.3
– Percent of Open Interest Shorts:7.057.53.4
– Net Position:229,189-256,24827,059
– Gross Longs:332,415588,60177,360
– Gross Shorts:103,226844,84950,301
– Long to Short Ratio:3.2 to 10.7 to 11.5 to 1
NET POSITION TREND:
– Strength Index Score (3 Year Range Pct):4.995.148.3
– Strength Index Reading (3 Year Range):Bearish-ExtremeBullish-ExtremeBearish
NET POSITION MOVEMENT INDEX:
– 6-Week Change in Strength Index:-11.110.16.9


Brent Crude Oil Futures:

Brent Last Day Crude Oil Futures COT ChartThe Brent Crude Oil Futures large speculator standing this week reached a net position of -40,013 contracts in the data reported through Tuesday. This was a weekly reduction of -3,589 contracts from the previous week which had a total of -36,424 net contracts.

This week’s current strength score (the trader positioning range over the past three years, measured from 0 to 100) shows the speculators are currently Bearish with a score of 44.0 percent. The commercials are Bullish with a score of 54.1 percent and the small traders (not shown in chart) are Bullish with a score of 55.6 percent.

Brent Crude Oil Futures StatisticsSPECULATORSCOMMERCIALSSMALL TRADERS
– Percent of Open Interest Longs:18.051.85.0
– Percent of Open Interest Shorts:40.131.63.2
– Net Position:-40,01336,5853,428
– Gross Longs:32,55693,6809,137
– Gross Shorts:72,56957,0955,709
– Long to Short Ratio:0.4 to 11.6 to 11.6 to 1
NET POSITION TREND:
– Strength Index Score (3 Year Range Pct):44.054.155.6
– Strength Index Reading (3 Year Range):BearishBullishBullish
NET POSITION MOVEMENT INDEX:
– 6-Week Change in Strength Index:2.2-7.140.2


Natural Gas Futures:

Natural Gas Futures COT ChartThe Natural Gas Futures large speculator standing this week reached a net position of -128,765 contracts in the data reported through Tuesday. This was a weekly decrease of -155 contracts from the previous week which had a total of -128,610 net contracts.

This week’s current strength score (the trader positioning range over the past three years, measured from 0 to 100) shows the speculators are currently Bearish with a score of 39.9 percent. The commercials are Bullish with a score of 60.0 percent and the small traders (not shown in chart) are Bullish with a score of 66.1 percent.

Natural Gas Futures StatisticsSPECULATORSCOMMERCIALSSMALL TRADERS
– Percent of Open Interest Longs:17.342.06.7
– Percent of Open Interest Shorts:30.432.53.0
– Net Position:-128,76592,46336,302
– Gross Longs:168,924410,93065,677
– Gross Shorts:297,689318,46729,375
– Long to Short Ratio:0.6 to 11.3 to 12.2 to 1
NET POSITION TREND:
– Strength Index Score (3 Year Range Pct):39.960.066.1
– Strength Index Reading (3 Year Range):BearishBullishBullish
NET POSITION MOVEMENT INDEX:
– 6-Week Change in Strength Index:-2.51.86.3


Gasoline Blendstock Futures:

RBOB Gasoline Energy Futures COT ChartThe Gasoline Blendstock Futures large speculator standing this week reached a net position of 49,702 contracts in the data reported through Tuesday. This was a weekly decline of -3,088 contracts from the previous week which had a total of 52,790 net contracts.

This week’s current strength score (the trader positioning range over the past three years, measured from 0 to 100) shows the speculators are currently Bearish with a score of 21.7 percent. The commercials are Bullish-Extreme with a score of 80.1 percent and the small traders (not shown in chart) are Bearish with a score of 37.6 percent.

Nasdaq Mini Futures StatisticsSPECULATORSCOMMERCIALSSMALL TRADERS
– Percent of Open Interest Longs:31.947.37.3
– Percent of Open Interest Shorts:12.368.45.8
– Net Position:49,702-53,4383,736
– Gross Longs:80,794119,87518,480
– Gross Shorts:31,092173,31314,744
– Long to Short Ratio:2.6 to 10.7 to 11.3 to 1
NET POSITION TREND:
– Strength Index Score (3 Year Range Pct):21.780.137.6
– Strength Index Reading (3 Year Range):BearishBullish-ExtremeBearish
NET POSITION MOVEMENT INDEX:
– 6-Week Change in Strength Index:9.9-7.6-13.0


#2 Heating Oil NY-Harbor Futures:

NY Harbor Heating Oil Energy Futures COT ChartThe #2 Heating Oil NY-Harbor Futures large speculator standing this week reached a net position of 25,196 contracts in the data reported through Tuesday. This was a weekly advance of 3,373 contracts from the previous week which had a total of 21,823 net contracts.

This week’s current strength score (the trader positioning range over the past three years, measured from 0 to 100) shows the speculators are currently Bullish with a score of 79.5 percent. The commercials are Bearish with a score of 24.7 percent and the small traders (not shown in chart) are Bullish with a score of 62.7 percent.

Heating Oil Futures StatisticsSPECULATORSCOMMERCIALSSMALL TRADERS
– Percent of Open Interest Longs:17.351.514.6
– Percent of Open Interest Shorts:8.566.98.0
– Net Position:25,196-43,76118,565
– Gross Longs:49,157145,89341,370
– Gross Shorts:23,961189,65422,805
– Long to Short Ratio:2.1 to 10.8 to 11.8 to 1
NET POSITION TREND:
– Strength Index Score (3 Year Range Pct):79.524.762.7
– Strength Index Reading (3 Year Range):BullishBearishBullish
NET POSITION MOVEMENT INDEX:
– 6-Week Change in Strength Index:23.5-21.313.9


Bloomberg Commodity Index Futures:

Bloomberg Commodity Index Futures COT ChartThe Bloomberg Commodity Index Futures large speculator standing this week reached a net position of -12,567 contracts in the data reported through Tuesday. This was a weekly lift of 98 contracts from the previous week which had a total of -12,665 net contracts.

This week’s current strength score (the trader positioning range over the past three years, measured from 0 to 100) shows the speculators are currently Bullish with a score of 59.4 percent. The commercials are Bearish with a score of 40.4 percent and the small traders (not shown in chart) are Bearish with a score of 22.3 percent.

Bloomberg Index Futures StatisticsSPECULATORSCOMMERCIALSSMALL TRADERS
– Percent of Open Interest Longs:23.774.30.6
– Percent of Open Interest Shorts:42.556.00.1
– Net Position:-12,56712,243324
– Gross Longs:15,86849,746419
– Gross Shorts:28,43537,50395
– Long to Short Ratio:0.6 to 11.3 to 14.4 to 1
NET POSITION TREND:
– Strength Index Score (3 Year Range Pct):59.440.422.3
– Strength Index Reading (3 Year Range):BullishBearishBearish
NET POSITION MOVEMENT INDEX:
– 6-Week Change in Strength Index:6.0-6.44.0


Article By InvestMacroReceive our weekly COT Reports by Email

*COT Report: The COT data, released weekly to the public each Friday, is updated through the most recent Tuesday (data is 3 days old) and shows a quick view of how large speculators or non-commercials (for-profit traders) were positioned in the futures markets.

The CFTC categorizes trader positions according to commercial hedgers (traders who use futures contracts for hedging as part of the business), non-commercials (large traders who speculate to realize trading profits) and nonreportable traders (usually small traders/speculators) as well as their open interest (contracts open in the market at time of reporting). See CFTC criteria here.

Stock Market Speculator bets gain led by S&P500 Mini, VIX & EAFE Mini

By InvestMacro | COT | Data Tables | COT Leaders | Downloads | COT Newsletter

COT Stock Futures Open Interest Comparison

Here are the latest charts and statistics for the Commitment of Traders (COT) data published by the Commodities Futures Trading Commission (CFTC).

The latest COT data is updated through Tuesday August 30th (COT Week 35) and shows a quick view of how large traders (for-profit speculators and commercial entities) were positioned in the futures markets.

S&P500 Mini, VIX & EAFE Mini lead the Weekly Speculator Changes

COT stock market speculator bets were mostly higher this week as five out of the seven stock markets we cover had higher positioning this week while the other two markets had lower contracts.

Leading the gains for stock markets was S&P500 Mini (22,644 contracts) with the VIX (8,410 contracts), MSCI EAFE Mini (7,680 contracts), Russell 2000 Mini (3,774 contracts) and the Dow Jones Industrial Average Mini (3,174 contracts) also showing a positive weeks.

The stock markets leading the declines in speculator bets this week was the Nasdaq Mini (-11,226 contracts) with Nikkei 225 USD (-78 contracts), also registering lower bets on the week.

Stocks Futures Speculator Net Position Changes


Data Snapshot of Stock Market Traders | Columns Legend
Aug-30-2022OIOI-IndexSpec-NetSpec-IndexCom-NetCOM-IndexSmalls-NetSmalls-Index
S&P500-Mini2,329,9539-239,63212311,81594-72,18311
Nikkei 22514,15110-4,641552,949441,69250
Nasdaq-Mini263,6415026,80790-2,85025-23,9570
DowJones-Mini77,43038-1,420363,02763-1,60730
VIX338,59038-97,93560101,48539-3,55074
Nikkei 225 Yen56,93339-3193319,46278-19,14335


Nasdaq-Mini leads the Strength Scores

Strength Scores (a normalized measure of Speculator positions over a 3-Year range, from 0 to 100 where above 80 is extreme bullish and below 20 is extreme bearish) showed that the Nasdaq-Mini (90.0 percent) leads the stocks markets this week. The Nasdaq-Mini strength score is down from last week’s 96.3 percent but remains in a bullish extreme position (above 80 percent). The VIX (60.2 percent) comes in as the next highest stock market in strength scores.

On the downside, the S&P500-Mini (11.8 percent) comes in at the lowest strength level currently and is followed by the Russell2000-Mini (16.2 percent) with both markets residing in a bearish extreme level currently (below 20 percent).


Strength Statistics:
VIX (60.2 percent) vs VIX previous week (56.0 percent)
S&P500-Mini (11.8 percent) vs S&P500-Mini previous week (7.6 percent)
DowJones-Mini (36.4 percent) vs DowJones-Mini previous week (32.2 percent)
Nasdaq-Mini (90.0 percent) vs Nasdaq-Mini previous week (96.3 percent)
Russell2000-Mini (16.2 percent) vs Russell2000-Mini previous week (14.0 percent)
Nikkei USD (55.4 percent) vs Nikkei USD previous week (55.8 percent)
EAFE-Mini (24.4 percent) vs EAFE-Mini previous week (16.0 percent)

Dow Jones-Mini leads the 6-Week Strength Trends

Strength Score Trends (or move index, calculates the 6-week changes in strength scores) showed that the DowJones-Mini (19.2 percent) leads the past six weeks trends for stocks this week. The EAFE-Mini (13.0 percent) and the Russell 2000-Mini (5.4 percent) fill out the other positive movers in the latest trends data.

The VIX (-14.0 percent) leads the downside trend scores currently while the next market with lower trend scores were the Nikkei USD (-12.8 percent) followed by the S&P500-Mini (-5.8 percent).


——————–
Strength Trend Statistics:
VIX (-14.0 percent) vs VIX previous week (-20.0 percent)
S&P500-Mini (-5.8 percent) vs S&P500-Mini previous week (-8.7 percent)
DowJones-Mini (19.2 percent) vs DowJones-Mini previous week (20.3 percent)
Nasdaq-Mini (-0.7 percent) vs Nasdaq-Mini previous week (10.4 percent)
Russell2000-Mini (5.4 percent) vs Russell2000-Mini previous week (12.8 percent)
Nikkei USD (-12.8 percent) vs Nikkei USD previous week (-13.4 percent)
EAFE-Mini (13.0 percent) vs EAFE-Mini previous week (0.5 percent)


Individual Markets:

VIX Volatility Futures:

VIX Volatility Futures COT ChartThe VIX Volatility large speculator standing this week recorded a net position of -97,935 contracts in the data reported through Tuesday. This was a weekly gain of 8,410 contracts from the previous week which had a total of -106,345 net contracts.

This week’s current strength score (the trader positioning range over the past three years, measured from 0 to 100) shows the speculators are currently Bullish with a score of 60.2 percent. The commercials are Bearish with a score of 38.5 percent and the small traders (not shown in chart) are Bullish with a score of 74.1 percent.

VIX Volatility Futures StatisticsSPECULATORSCOMMERCIALSSMALL TRADERS
– Percent of Open Interest Longs:13.859.67.4
– Percent of Open Interest Shorts:42.729.68.4
– Net Position:-97,935101,485-3,550
– Gross Longs:46,792201,68124,889
– Gross Shorts:144,727100,19628,439
– Long to Short Ratio:0.3 to 12.0 to 10.9 to 1
NET POSITION TREND:
– Strength Index Score (3 Year Range Pct):60.238.574.1
– Strength Index Reading (3 Year Range):BullishBearishBullish
NET POSITION MOVEMENT INDEX:
– 6-Week Change in Strength Index:-14.012.412.7


S&P500 Mini Futures:

SP500 Mini Futures COT ChartThe S&P500 Mini large speculator standing this week recorded a net position of -239,632 contracts in the data reported through Tuesday. This was a weekly lift of 22,644 contracts from the previous week which had a total of -262,276 net contracts.

This week’s current strength score (the trader positioning range over the past three years, measured from 0 to 100) shows the speculators are currently Bearish-Extreme with a score of 11.8 percent. The commercials are Bullish-Extreme with a score of 94.1 percent and the small traders (not shown in chart) are Bearish-Extreme with a score of 11.2 percent.

S&P500 Mini Futures StatisticsSPECULATORSCOMMERCIALSSMALL TRADERS
– Percent of Open Interest Longs:10.377.39.7
– Percent of Open Interest Shorts:20.663.912.8
– Net Position:-239,632311,815-72,183
– Gross Longs:240,6531,800,768224,954
– Gross Shorts:480,2851,488,953297,137
– Long to Short Ratio:0.5 to 11.2 to 10.8 to 1
NET POSITION TREND:
– Strength Index Score (3 Year Range Pct):11.894.111.2
– Strength Index Reading (3 Year Range):Bearish-ExtremeBullish-ExtremeBearish-Extreme
NET POSITION MOVEMENT INDEX:
– 6-Week Change in Strength Index:-5.86.3-2.9


Dow Jones Mini Futures:

Dow Jones Mini Futures COT ChartThe Dow Jones Mini large speculator standing this week recorded a net position of -1,420 contracts in the data reported through Tuesday. This was a weekly gain of 3,174 contracts from the previous week which had a total of -4,594 net contracts.

This week’s current strength score (the trader positioning range over the past three years, measured from 0 to 100) shows the speculators are currently Bearish with a score of 36.4 percent. The commercials are Bullish with a score of 63.1 percent and the small traders (not shown in chart) are Bearish with a score of 29.9 percent.

Dow Jones Mini Futures StatisticsSPECULATORSCOMMERCIALSSMALL TRADERS
– Percent of Open Interest Longs:34.549.115.0
– Percent of Open Interest Shorts:36.345.217.1
– Net Position:-1,4203,027-1,607
– Gross Longs:26,72438,00511,643
– Gross Shorts:28,14434,97813,250
– Long to Short Ratio:0.9 to 11.1 to 10.9 to 1
NET POSITION TREND:
– Strength Index Score (3 Year Range Pct):36.463.129.9
– Strength Index Reading (3 Year Range):BearishBullishBearish
NET POSITION MOVEMENT INDEX:
– 6-Week Change in Strength Index:19.2-24.118.9


Nasdaq Mini Futures:

Nasdaq Mini Futures COT ChartThe Nasdaq Mini large speculator standing this week recorded a net position of 26,807 contracts in the data reported through Tuesday. This was a weekly decrease of -11,226 contracts from the previous week which had a total of 38,033 net contracts.

This week’s current strength score (the trader positioning range over the past three years, measured from 0 to 100) shows the speculators are currently Bullish-Extreme with a score of 90.0 percent. The commercials are Bearish with a score of 24.8 percent and the small traders (not shown in chart) are Bearish-Extreme with a score of 0.0 percent.

Nasdaq Mini Futures StatisticsSPECULATORSCOMMERCIALSSMALL TRADERS
– Percent of Open Interest Longs:29.456.312.2
– Percent of Open Interest Shorts:19.257.421.2
– Net Position:26,807-2,850-23,957
– Gross Longs:77,379148,38532,035
– Gross Shorts:50,572151,23555,992
– Long to Short Ratio:1.5 to 11.0 to 10.6 to 1
NET POSITION TREND:
– Strength Index Score (3 Year Range Pct):90.024.80.0
– Strength Index Reading (3 Year Range):Bullish-ExtremeBearishBearish-Extreme
NET POSITION MOVEMENT INDEX:
– 6-Week Change in Strength Index:-0.710.3-31.5


Russell 2000 Mini Futures:

Russell 2000 Mini Futures COT ChartThe Russell 2000 Mini large speculator standing this week recorded a net position of -91,149 contracts in the data reported through Tuesday. This was a weekly boost of 3,774 contracts from the previous week which had a total of -94,923 net contracts.

This week’s current strength score (the trader positioning range over the past three years, measured from 0 to 100) shows the speculators are currently Bearish-Extreme with a score of 16.2 percent. The commercials are Bullish-Extreme with a score of 83.5 percent and the small traders (not shown in chart) are Bearish with a score of 23.9 percent.

Russell 2000 Mini Futures StatisticsSPECULATORSCOMMERCIALSSMALL TRADERS
– Percent of Open Interest Longs:7.586.84.2
– Percent of Open Interest Shorts:24.969.24.4
– Net Position:-91,14992,282-1,133
– Gross Longs:39,315455,29622,023
– Gross Shorts:130,464363,01423,156
– Long to Short Ratio:0.3 to 11.3 to 11.0 to 1
NET POSITION TREND:
– Strength Index Score (3 Year Range Pct):16.283.523.9
– Strength Index Reading (3 Year Range):Bearish-ExtremeBullish-ExtremeBearish
NET POSITION MOVEMENT INDEX:
– 6-Week Change in Strength Index:5.4-7.112.4


Nikkei Stock Average (USD) Futures:

Nikkei Stock Average (USD) Futures COT ChartThe Nikkei Stock Average (USD) large speculator standing this week recorded a net position of -4,641 contracts in the data reported through Tuesday. This was a weekly reduction of -78 contracts from the previous week which had a total of -4,563 net contracts.

This week’s current strength score (the trader positioning range over the past three years, measured from 0 to 100) shows the speculators are currently Bullish with a score of 55.4 percent. The commercials are Bearish with a score of 44.4 percent and the small traders (not shown in chart) are Bearish with a score of 49.6 percent.

Nikkei Stock Average Futures StatisticsSPECULATORSCOMMERCIALSSMALL TRADERS
– Percent of Open Interest Longs:12.253.334.2
– Percent of Open Interest Shorts:45.032.522.3
– Net Position:-4,6412,9491,692
– Gross Longs:1,7297,5484,844
– Gross Shorts:6,3704,5993,152
– Long to Short Ratio:0.3 to 11.6 to 11.5 to 1
NET POSITION TREND:
– Strength Index Score (3 Year Range Pct):55.444.449.6
– Strength Index Reading (3 Year Range):BullishBearishBearish
NET POSITION MOVEMENT INDEX:
– 6-Week Change in Strength Index:-12.8-1.337.0


MSCI EAFE Mini Futures:

MSCI EAFE Mini Futures COT ChartThe MSCI EAFE Mini large speculator standing this week recorded a net position of -13,864 contracts in the data reported through Tuesday. This was a weekly gain of 7,680 contracts from the previous week which had a total of -21,544 net contracts.

This week’s current strength score (the trader positioning range over the past three years, measured from 0 to 100) shows the speculators are currently Bearish with a score of 24.4 percent. The commercials are Bullish with a score of 75.9 percent and the small traders (not shown in chart) are Bearish with a score of 40.0 percent.

MSCI EAFE Mini Futures StatisticsSPECULATORSCOMMERCIALSSMALL TRADERS
– Percent of Open Interest Longs:5.991.52.1
– Percent of Open Interest Shorts:9.488.61.5
– Net Position:-13,86411,4452,419
– Gross Longs:23,657366,9258,362
– Gross Shorts:37,521355,4805,943
– Long to Short Ratio:0.6 to 11.0 to 11.4 to 1
NET POSITION TREND:
– Strength Index Score (3 Year Range Pct):24.475.940.0
– Strength Index Reading (3 Year Range):BearishBullishBearish
NET POSITION MOVEMENT INDEX:
– 6-Week Change in Strength Index:13.0-11.6-8.8


Article By InvestMacroReceive our weekly COT Reports by Email

*COT Report: The COT data, released weekly to the public each Friday, is updated through the most recent Tuesday (data is 3 days old) and shows a quick view of how large speculators or non-commercials (for-profit traders) were positioned in the futures markets.

The CFTC categorizes trader positions according to commercial hedgers (traders who use futures contracts for hedging as part of the business), non-commercials (large traders who speculate to realize trading profits) and nonreportable traders (usually small traders/speculators) as well as their open interest (contracts open in the market at time of reporting). See CFTC criteria here.

The global risk of weaponization in semiconductors

By Dan Steinbock

– On August 9, President Biden signed the CHIPS Act. It is a prelude in an effort to weaponize the global IT supply chains.

In international media, the CHIPS and Science Act of 2022 is portrayed as a $52 billion package aiming to boost semiconductor manufacturing in the United States. But the underlying strategic objective is geopolitical.

Today Asia dominates global semiconductor manufacturing. Though a top exporter, US semiconductor industry no longer controls the global supply chains. However, it still accounts for over 80% of the world’s chip design equipment, 50% of intellectual property for chip designs, and half of the globe’s chip manufacturing equipment.

To dominate the semiconductors, which enable advanced military technology, the Biden team seeks to restore the past US superiority in global semiconductors.

The problem is that no single nation can any longer control entire supply chains. Hence, the effort to weaponize the system, to “counter” China.

Forcing semiconductor giants to pick sides

Currently, the US, Taiwan, South Korea and Japan supply most of the world’s semiconductors, whereas China represents the highest demand in the industry. The Biden administration would like to keep it that way.

In order to restore the US’ supremacy, the Biden administration needs to neutralize future rivals. That’s the likely reason why Washington is also considering restricting U.S. chipmaking equipment from being exported to Chinese memory chip makers.

Such restrictions are designed to hurt China and its progress in advanced technology. But they would also harm South Korea’s Samsung and SK Hynix, which have memory chip operations in China. Japanese semiconductor rivals were derailed already in the 1980s trade wars.

Unsurprisingly, Chinese critics of the “CHIP-4 alliance” call it a “hongmen Banquet”; a well-known Chinese expression for a feast that’s set up as a trap for the invitees.

Ambivalent “allies” divided

At present, six US-headquartered or foreign-owned semiconductor companies have 20 fabrication facilities (“fabs”) in America. South Korean Samsung is building a $17 billion fab in Texas, while the Taiwan Semiconductor Manufacturing Company (TSMC) is investing $12 billion on a plant in Arizona. The real costs are likely to prove far higher, as they have already affirmed.

Reportedly, the CHIPS Act would bar recipients of U.S. government funds from expanding or upgrading their advanced chip capacity in China, which has led South Korean firms to review their Chinese operations. That leaves Taiwan.

Hence, the recent Taiwan visit by the US House Speaker Nancy Pelosi, for which the way was paved by the Taiwan lobby (TECRO); Pelosi’s generous supporter that also helped to push through the recent $5 billion weapons sales deal to Taiwan.

In Taiwan, Pelosi insisted on a meeting with TSMC’s CEO Mark Liu, the largest contract chip maker. Reportedly, she said she hopes TSMC will side with the US.

In the long term, US and some of its allies hope to undermine Taiwan’s dominance in semiconductors, however. Effectively, such goals were initiated by the Obama administration, codified by the Trump White House and are now being executed by the Biden team.

Weaponizing semiconductors replaces competitiveness with geopolitics

In the 1980s, US technology giants pressed the Reagan administration to battle the Japanese competitors. By contrast, Trump and Biden administrations are pushing the reluctant US semiconductor giants to fight China.

The US-Sino ties soured and bilateral disputes escalated in July 2018, when the Trump administration imposed 25% tariffs on semiconductors imported from China, causing significant damage in the US industry. And as companies like Huawei bypassed US suppliers buying semiconductors from Taiwan and South Korea, the tariffs failed to have the desired effect. That’s why the White House is now trying to use an alliance to command the full semiconductor ecosystem.

In early 2021, the Biden administration signaled it planned to move ahead with a Trump administration-proposed rule to “secure” the information-technology (IT) supply chains. That allowed the Department of Commerce to monitor the transactions of governments, including those of China. Reportedly, it is part of the effort to weaponize the global IT ecosystem.

The activities of Eric Schmidt, ex-CEO of Google and financier of Obama, Clinton and Biden campaigns, reflects the new semiconductor geopolitics. Prior to his advisory role in artificial intelligence, Schmidt headed Pentagon’s advisory board to link Silicon Valley with Pentagon. “The US and its allies,” Schmidt urged, “should utilize targeted export controls on high-end semiconductor manufacturing equipment … to protect existing technical advantages and slow the advancement of China’s semiconductor industry.”

Such are the behind-the-façade strategic objectives.

Geopolitics derails supply chains, consumer welfare and innovation

The semiconductor debacles first intensified with the US-Japan trade wars of the 1980s. Eventually, Japan, heavily dependent on the US military, agreed to “voluntary restrictions” on contested export products, bilateral concessions, sky-high US tariffs, de facto currency revaluation, and structural reforms opening the Japanese market to the US.

As a result, Japan lost its mantle of world leader in microchips. Secular stagnation ensued soon thereafter. This precedent obviously makes executive teams uneasy in both South Korea and Taiwan.

Weaponization of the global semiconductor supply chains by any one country would be disastrous to the ecosystem. It would replace industry competition with geopolitical dicta. It would undermine consumer welfare. And it would derail innovation.

About the Author:

Dr. Dan Steinbock is an internationally recognized strategist of the multipolar world and the founder of Difference Group. He has served at the India, China and America Institute (USA), Shanghai Institutes for International Studies (China) and the EU Center (Singapore). For more, see https://www.differencegroup.net

The original version was published by China Daily on August 29, 2022


Making EVs without China’s supply chain is hard, but not impossible – 3 supply chain experts outline a strategy

By Ho-Yin Mak, Georgetown University; Christopher S. Tang, University of California, Los Angeles, and Tinglong Dai, Johns Hopkins University 

Two electrifying moves in recent weeks have the potential to ignite electric vehicle demand in the United States. First, Congress passed the Inflation Reduction Act, expanding federal tax rebates for EV purchases. Then California approved rules to ban the sale of new gasoline-powered cars by 2035.

The Inflation Reduction Act extends the Obama-era EV tax credit of up to US$7,500. But it includes some high hurdles. Its country-of-origin rules require that EVs – and an increasing percentage of their components and critical minerals – be sourced from the U.S. or countries that have free-trade agreements with the U.S. The law expressly forbids tax credits for vehicles with any components or critical minerals sourced from a “foreign entity of concern,” such as China or Russia.

That’s not so simple when China controls 60% of the world’s lithium mining, 77% of battery cell capacity and 60% of battery component manufacturing. Many American EV makers, including Tesla, rely heavily on battery materials from China.

The U.S. needs a national strategy to build an EV ecosystem if it hopes to catch up. As experts in supply chain management, we have some ideas.

Why the EV industry depends heavily on China

How did the U.S. fall so far behind?

Back in 2009, the Obama administration pledged $2.4 billion to support the country’s fledgling EV industry. But demand grew slowly, and battery manufacturers such as A123 Systems and Ener1 failed to scale up their production. Both succumbed to financial pressure and were acquired by Chinese and Russian investors.

China took the lead in the EV market through an aggressive mix of carrots and sticks. Its consumer subsidies raised demand at home, and Beijing and other major cities set licensing quotas mandating a minimum share of EV sales.

China also established a world-dominating battery supply chain by securing overseas mineral supplies and heavily subsidizing its battery manufacturers.

Today, the U.S. domestic EV supply chain is far from adequate to meet its goals. The new U.S. tax credits are designed to help turn that around, but building a resilient EV supply chain will inevitably entail competing with China for limited resources.

A comprehensive national strategy entails measures for the short, medium and long term.

Short-term: What can be done now?

Six of the 10 best-selling EV models in 2022 are already assembled in the U.S., fulfilling the Inflation Reduction Act’s final assembly location clause. The Hyundai-Kia alliance, which has three of the other four bestsellers, plans to open an EV assembly line in Georgia. Volkswagen has also started assembling its ID.4 electric SUV in Tennessee.

The challenge is batteries. Besides the Tesla-Panasonic factories in Nevada and planned in Kansas, U.S.-based battery manufacturers trail their Chinese counterparts in both size and growth.

For the U.S. to scale up its own production, it needs to rely on strategic partners overseas. The Inflation Reduction Act allows imports of critical minerals from countries with free trade agreements to still qualify for incentives, but not imports of battery components. This means overseas suppliers like Korea’s “Big Three” – LG Chem, SK Innovation and Samsung SDI – which supply 26% of the world’s EV batteries, are shut out, even though the U.S. and Korea have a free trade agreement.

A Sankey chart, also known as a spaghetti chart, shows the flow of cobalt Congo, with some resources in the rest of the world, through to the production of EVs.
The bulk of the world’s cobalt is mined in the Democratic Republic of Congo but processed and turned into lithium-ion battery components by Chinese companies. This chart shows the pathways from mining to EVs.
Based on an NREL presentation in 2020, CC BY-ND

The Korea Automobile Manufacturers Association has asked Congress to make an exception for Korean-made EVs and batteries.

In the spirit of “friend-shoring,” the Biden administration could think of a temporary waiver as a stopgap measure that makes it easier for Korean battery makers to move more of their supply chain to the U.S., such as LG’s planned battery plants in partnerships with GM and Honda.

The 2021 Infrastructure Act also provided $5 billion to expand charging infrastructure, which surveys show is critical to bolstering demand.

Medium-term: Diversifying lithium and cobalt supplies

A strong and concerted effort in trade and diplomacy is necessary for the U.S. to secure critical mineral supplies.

As EV sales rise, the world is expected to face a lithium shortage by 2025. In addition to lithium, cobalt is needed for high-performance battery chemistries.

The problem? The Democratic Republic of the Congo is where 70% of the world’s cobalt is mined, and Chinese companies control 80% of that. The distant second-largest producer is Russia.

The Biden administration’s “friend-shoring” vision has a chance only if it can diversify the lithium and cobalt supply chains.

Bars on a map show countries with the most critical mineral production.
Lithium, cobalt and nickel are critical components in many EV batteries. The largest 2021 production sources included the Democratic Republic of Congo for cobalt; Australia, Chile and China for lithium; and Indonesia, the Philippines and Russia for nickel.
The Conversation, USGS Mineral Commodity Summaries 2022, CC BY-ND

The “Lithium Triangle” of South America is one region to invest in. Also, Australia, a key U.S. ally, leads the world in lithium production and possesses rich cobalt deposits. Waste from many of Australia’s copper mines also contains cobalt, lowering the cost. GM has reached an agreement with the Australian mining giant Glencore to mine and process cobalt in Western Australia for its Ohio battery plant with LG Chem, bypassing China.

A way to avoid cobalt altogether also exists: lithium-iron-phosphate batteries are about 30% cheaper to make because they use minerals that are easy to find and plentiful. However, LFP batteries are heavier and have less power and range per unit.

For years, Chinese companies like CATL and BYD were the only ones making LFP batteries. But the patent rights associated with LFP batteries expire this year, opening up an important opportunity for the U.S.

Since not everyone needs a high-end electric supercar, affordable EVs powered by LFP batteries are an option. In fact, Tesla now offers Model 3s with LFP batteries that can travel about 270 miles on a charge.

The 2021 Bipartisan Infrastructure Law set aside $3.16 billion to support domestic battery supply chains. With the Inflation Reduction Act’s emphasis on supporting more affordable EVs – it has price caps for vehicles to qualify for incentives – these funds will be needed to help scale up domestic LFP manufacturing.

Long-term: US critical mineral production

Replacing overseas critical materials with domestic mining falls under long-term planning.

The scale of current domestic mining is minuscule, and new mining operations can take seven to 10 years to establish because of the lengthy permitting process. Lithium deposits exist in California, Maine, Nevada and North Carolina, and there are cobalt resources in Minnesota and Idaho.

Finally, to build an industrial commons for EVs, the U.S. must continue to invest in research and development of new battery technologies.

Also, end-of-life battery recycling is essential to the sustainability of EVs. The industry has been kicking the can down the road on this, as recycling demand has been minuscule thus far given the longevity of batteries. Yet, as a proactive step, the Inflation Reduction Act specifically permits battery content recycled in North America to qualify for the critical mineral clause.

To make this happen, the federal and state governments could use takeback legislation similar to producer responsibility laws for electronic waste enacted in more than 20 states, which stipulate that producers bear the responsibility for collecting, transporting and recycling end-of-cycle electronic products.

What’s ahead

With the new law, the Biden administration has set its sights on a future transportation system that is built in the U.S. and runs on electricity. But there are supply chain obstacles, and the U.S. will need both incentives and regulations to make it happen.

California’s announcement will help. Under the Clean Air Act, California has a waiver that allows it to set policies more strict than federal law. Other states can choose to follow California’s policies. Seventeen other states have adopted California’s emissions standards. At least three, New York, Washington and Massachusetts, have already announced plans to also phase out new gas-powered cars and light trucks by 2035.The Conversation

About the Author:

Ho-Yin Mak, Associate Professor in Operations & Information Management, Georgetown University; Christopher S. Tang, Professor of Supply Chain Management, University of California, Los Angeles, and Tinglong Dai, Professor of Operations Management & Business Analytics, Carey Business School, Johns Hopkins University

This article is republished from The Conversation under a Creative Commons license. Read the original article.

A Multi-Asset Trading Platform from RoboForex Is Named the Best in the LatAm Area

RoboForex, the company that provides services for trading on global financial markets, received an award in the “Best Multi Asset Trading Platform – LATAM” category at the Global Banking & Finance Awards.

The famous international magazine Global Banking and Finance Review, an organiser of the same-name award, has rewarded RoboForex for the best multi-asset trading platform, R StocksTrader, the company’s proprietary solution for the second consecutive year.

R StocksTrader combines cutting-edge technologies and a classic, intuitive interface. Access to all global financial markets is provided through a web terminal in a familiar browser on desktop and mobile devices. Traders can use over 12,000 trading instruments, one-click trading directly from charts, advanced watchlists, and a free strategy builder that starts and runs in the “cloud”.

Robert Stephenson, Chief Business Officer at RoboForex, says: “RoboForex is very delighted to have won the “Best Multi Asset Trading Platform – LATAM” title again. We’ve been actively working in this region and see what clients want: cutting-edge technologies, instant access to markets, and a wide choice of trading instruments. All these features can be easily found in our terminal, R StocksTrader, which becomes more convenient and powerful after each upgrade.”

About RoboForex

RoboForex is a company which delivers brokerage services. The company provides traders who work on financial markets with access to its proprietary trading platforms. RoboForex Ltd has the brokerage licence FSC 000138/333. More detailed information about the Company’s products and activities can be found on the official website at roboforex.com.

The most cost-effective energy efficiency investments you can make – and how the new Inflation Reduction Act could help

By Jasmina Burek, UMass Lowell 

Energy efficiency can save homeowners and renters hundreds of dollars a year, and the new Inflation Reduction Act includes a wealth of home improvement rebates and tax incentives to help Americans secure those saving.

It extends tax credits for installing energy-efficient windows, doors, insulation, water heaters, furnaces, air conditioners or heat pumps, as well as for home energy audits. It also offers rebates for low- and moderate-income households’ efficiency improvements, up to US$14,000 per home.

Together, these incentives aim to cut energy costs for consumers who use them by $500 to $1,000 per year and reduce the nation’s climate-warming greenhouse gas emissions.

With so many options, what are the most cost-effective moves homeowners and renters can make?

My lab at UMass Lowell works on ways to improve sustainability in buildings and homes by finding cost-effective design solutions to decrease their energy demand and carbon footprint. There are two key ways to cut energy use: energy-efficient upgrades and behavior change. Each has clear winners.

Stop the leaks

The biggest payoff for both saving money and reducing emissions is weatherizing the home to stop leaks. Losing cool air in summer and warm air in winter means heating and cooling systems run more, and they’re among the most energy-intensive systems in a home.

Gaps along the baseboard where the wall meets the floor and at windows, doors, pipes, fireplace dampers and electrical outlets are all prime spots for drafts. Fixing those leaks can cut a home’s entire energy use by about 6%, on average, by our estimates. And it’s cheap, since those fixes mostly involve caulk and weather stripping.

Illustration of a house showing common air leaks, primarily in the attic and along walls and vents.
Common places where homes leak – and where weatherization measures can save money.
Department of Energy

The Inflation Reduction Act offers homeowners a hand. It includes a $150 rebate to help pay for a home energy audit that can locate leaks.

While a professional audit can help, it isn’t essential – the Department of Energy website offers guidance for doing your own inspection.

Once you find the leaks, the act includes 30% tax credits with a maximum of $1,200 a year for basic weatherization work, plus rebates up to $1,600 for low- and moderate-income homeowners earning less than 150% of the local median.

Replace windows

Replacing windows is more expensive upfront but can save a lot of money on energy costs. Leaky windows and doors are responsible for 25% to 30% of residential heating and cooling costs, according to Department of Energy estimates.

Insulation can also reduce energy loss. But with the exception of older homes with poor insulation and homes facing extreme temperatures, it generally doesn’t have as high of a payoff in whole-house energy savings as weatherization or window replacement.

The Inflation Reduction Act includes up to $600 to help pay for window replacement and $250 to replace an exterior door.

Upgrade appliances, especially HVAC and dryers

Buildings cumulatively are responsible for about 40% of U.S. energy consumption and associated greenhouse gas emissions, and a significant share of that is in homes. Heating is typically the main energy use.

Among appliances, upgrading air conditioners and clothes dryers results in the largest environmental and cost benefits; however, HVAC systems – heating, ventilation and air conditioning – come with some of the highest upfront costs.

That includes energy-efficient electric heat pumps, which both heat and cool a home. The Inflation Reduction Act offers a 30% tax credit up to $2,000 available to anyone who purchases and installs a heat pump, in addition to rebates of up to $8,000 for low- and moderate-income households earning less than 150% of the local median income. Some high-efficiency wood-burning stoves also qualify.

The act also provides rebates for low- and moderate-income households for electric stoves of up to $840, heat-pump water heaters of up to $1,750 and heat-pump clothes dryers of up to $840.

Change your behavior in a few easy steps

You can also make a pretty big difference without federal incentives by changing your habits. My dad was energy-efficient before it was hip. His “hobby” was to turn off the lights. This action itself has been among the most cost-saving behavioral changes.

Just turning out the lights for an hour a day can save a home up to $65 per year. Replacing old lightbulbs with LED lighting also cuts energy use. They’re more expensive, but they save money on energy costs.

We found that a homeowner could save $265 per year and reduce emissions even more by adopting a few behavioral changes including unplugging appliances not being used, line-drying clothes, lowering the water heater temperature, setting the thermostat 1 degree warmer at night in summer or 1 degree cooler in winter, turning off lights for an hour a day, and going tech-free for an hour a day.

Some appliances are energy vampires – they draw electricity when plugged in even if you’re not using them. One study in Northern California found that plugged-in devices, such as TVs, cable boxes, computers and smart appliances, that weren’t being used were responsible for as much as 23% of electricity consumption in homes.

Start with a passive solar home

If you’re looking for a home to rent or buy, or even to build, you can make an even bigger difference by looking at how it’s built and powered.

Passive solar homes take advantage of local climate and site conditions, such as having lots of south-facing windows to capture solar energy during cool months to reduce home energy use as much as possible. Then they meet the remaining energy demand with on-site solar energy.

Studies show that for homeowners in cold climates, building a passive design home could cut their energy cost by 14% compared with an average home. That’s before taking solar panels into account.

The Inflation Reduction Act offers a 30% tax credit for rooftop solar and geothermal heating, plus accompanying battery storage, as well as incentives for community solar – larger solar systems owned by several homeowners. It also includes a $5,000 tax credit for developers to build homes to the Energy Department’s Zero Energy Ready Homes standard.

The entire energy and climate package – including incentives for utility-scale renewable energy, carbon capture and electric vehicles – could have a big impact for homeowners’ energy costs and the climate. According to several estimates, it has the potential to reduce U.S. carbon emissions by about 40% by the end of this decade.The Conversation

About the Author:

Jasmina Burek, Assistant Professor of Engineering, UMass Lowell

This article is republished from The Conversation under a Creative Commons license. Read the original article.


The cryptocurrency market digest (BTC, ETH). Overview for 02.09.2022

Article By RoboForex.com

On Friday, the BTC is barely moving close to $20,101. The major crypto is slowly cheapening, but market players remain cautious and don’t want to sell without news. The news might come up later today – labour market data for August from the US. Actually, market expectations are rather average: both Unemployment Rate and Average Hourly Earnings are expected to remain unchanged. The key intrigue lies in Non-Farm Payrolls. Strong numbers will help capital markets grow and the crypto sector will follow. However, if the BTC fails to secure above $22,000, one should forget about the growth potential.

At the end of this trading week, the capitalisation of the crypto market is estimated at $984 billion, and the share of the BTC dropped to 39.1%. The fear index has dropped a bit, 25 points.

Buterin: BTC is in danger

Ethereum founder Vitalik Buterin is worried about the BTC security. He surfaced the reasons for being concerned about the prospects of the major cryptocurrency – the BTC won’t be able to get enough revenue yield from commissions. In this case, mining won’t be efficient enough.

Justin Sun bought ETH

In the last four days, Tron founder Justin Sun bought 20,633 ETHs for the total amount of $33 million. Sun supports the PoS concept and allows ETHW and ETHS tokens in his exchange Poloniex.

BABL plummeted 95%

The BABL price plunged 95% after they announced the shutdown of Babylon Finance. The project’s founders said that they weren’t able to handle the negative impulse that appeared after DeFi-platform Rari Capital was hacked.

Article By RoboForex.com

Attention!
Forecasts presented in this section only reflect the author’s private opinion and should not be considered as guidance for trading. RoboForex LP bears no responsibility for trading results based on trading recommendations described in these analytical reviews.

GBP: no rest for the wicked. Overview for 02.09.2022

Article By RoboForex.com

GBPUSD keeps updating its lows; there are very few options on how to stop the plunge.

After updating another low against the USD, the Pound Sterling is trying to reach stability. The current quote for the instrument is 1.1562.

The political factor should be cleared up as early as next Monday. The Conservative Party will announce its new leader, who will go on to become the country’s Prime Minister. Liz Truss is a favourite so far. Politicians like her. Unlike investors.

Truss has a checkered reputation despite many years of political experience and the current status of Secretary of State for Foreign, Commonwealth and Development Affairs. However, she has opponents, and if the party chooses Rishi Sunak, a young conservator and Chancellor of the Exchequer, to be the next leader, the Pound will get much support.

All these things considered, fundamental prospects for the GBP remain negative. Neither Truss nor Sunak will be able to reverse the British currency upwards, because the crisis is only escalating.

Nevertheless, there might be some local improvement for sure.

Article By RoboForex.com

Attention!
Forecasts presented in this section only reflect the author’s private opinion and should not be considered as guidance for trading. RoboForex LP bears no responsibility for trading results based on trading recommendations described in these analytical reviews.

The Analytical Overview of the Main Currency Pairs on 2022.09.02

By JustForex

The EUR/USD currency pair

Technical indicators of the currency pair:
  • Prev Open: 1.0049
  • Prev Close: 0.9943
  • % chg. over the last day: -1.07 %

Important data will be released today on the US labor market. The Nonfarm Payroll report is expected to show an increase of 300,000 jobs after recording an increase of 528,000 in July. Another strong report is likely to further reinforce expectations that the Fed will continue its excessive rate hikes after three straight 75 basis point hikes. The US dollar hit a 20-year high yesterday as economic data supports the Fed’s aggressive stance.

Trading recommendations
  • Support levels: 0.9900
  • Resistance levels: 0.9973, 1.0024, 1.0112, 1.0146, 1.0230, 1.0286, 1.0365

From the technical point of view, the trend on the EUR/USD currency pair on the hourly time frame is bearish. Yesterday the EUR/USD quotes fell below parity again. Technically, a wide balance is being formed. The MACD indicator has become negative, and the selling pressure remains. Under such market conditions it is best to look for buy trades on intraday time frames from the support level of 0.9900, but only with a confirmation in the form of a false breakdown. Sell trades can be considered from resistance levels of 0.9973 or 1.0024, but only after the additional confirmation.

Alternative scenario: if the price breaks out of the 1.0146 resistance level and fixes above, the uptrend will likely resume.

EUR/USD
News feed for 2022.09.02:
  • – Eurozone Producer Price Index (m/m) at 12:00 (GMT+3);
  • – US Nonfarm Payrolls (m/m) at 15:30 (GMT+3);
  • – US Unemployment Rate (m/m) at 15:30 (GMT+3).

The GBP/USD currency pair

Technical indicators of the currency pair:
  • Prev Open: 1.1622
  • Prev Close: 1.1544
  • % chg. over the last day: -0.67 %

The UK Manufacturing Business Activity Index unexpectedly increased overr the last month from 46 to 47.3. This is a positive factor, but the value is still below the 50 levels, indicating a slowdown in the sector. If you look at the GBP/USD chart on higher time frames, traders can clearly see that the British pound has been declining against the US dollar since 2007. But the rate of decline has gained strength in recent months, as the energy crisis and lack of government continue to weigh on the national exchange rate.

Trading recommendations
  • Support levels: 1.1500, 1.1400
  • Resistance levels: 1.1586, 1.1670, 1.1817, 1.1838, 1.1901, 1.1994, 1.2035, 1.2167

From the technical point of view, the trend on the GBP/USD currency pair on the hourly time frame is bearish. The situation does not change. The British pound has been declining for 8 sessions in a row and breaking through all support levels. The price is trading below the moving levels, and the MACD indicator is in the negative zone, but the divergence is getting stronger. At the moment, it is best to look for sell trades on intraday time frames, the nearest resistance level is 1.1586. Buy trades can be considered from the support level of 1.1500, but only after an additional confirmation in the form of a reverse initiative.

Alternative scenario: if the price breaks out through the 1.1817 resistance level and fixes above, the uptrend will likely resume.

GBP/USD
News feed for 2022.09.02:
  • – US Nonfarm Payrolls (m/m) at 15:30 (GMT+3);
  • – US Unemployment Rate (m/m) at 15:30 (GMT+3).

The USD/JPY currency pair

Technical indicators of the currency pair:
  • Prev Open: 139.08
  • Prev Close: 140.20
  • % chg. over the last day: +0.81 %

The Japanese yen has fallen to 140.23 yen against the dollar, its lowest level since 1998. The continuing fall in the Japanese currency is putting pressure on the consensus between Japan’s Central Bank, which is trying to boost inflation, and Japan’s government, which is desperately trying to avoid a cost-of-living crisis. Some analysts say that fixing the price above the 140 level could trigger government intervention.

Trading recommendations
  • Support levels: 139.61, 137.67, 136.85, 135.89, 135.35, 134.23, 133.47, 132.27
  • Resistance levels: 141.00, 142.00

From the technical point of view, the medium-term trend on the currency pair USD/JPY is bullish. The price is trading above the moving average lines again, and the buyers’ pressure remains. The MACD indicator remains positive, but there are signs of divergence, which means that a technical correction will take place soon. Under such market conditions, buy trades can be sought from the support level of 139.61, but with additional confirmation. For sell deals, it is possible to consider the psychological resistance levels of 141 and 142, but only with additional confirmation, as fundamentally, USD/JPY quotes are inclined to grow.

Alternative scenario: If the price fixes below 137.67, the downtrend will likely resume.

USD/JPY
News feed for 2022.09.02:
  • – US Nonfarm Payrolls (m/m) at 15:30 (GMT+3);
  • – US Unemployment Rate (m/m) at 15:30 (GMT+3).

The USD/CAD currency pair

Technical indicators of the currency pair:
  • Prev Open: 1.3125
  • Prev Close: 1.3153
  • % chg. over the last day: +0.21 %

The Canadian dollar is a commodity currency and depends not only on the monetary policy of the Bank of Canada, but also on the dynamics of the dollar index and oil prices. The deteriorating economic outlook in China and Europe, along with geopolitical concerns related to soaring gas prices and the ongoing war in Ukraine have bolstered the dollar in recent weeks. At the same time, an oil sell-off due to a new coronavirus outbreak in China could push a barrel below $85. As a result, the Canadian dollar has been under pressure from a rising dollar index and falling oil prices recently.

Trading recommendations
  • Support levels: 1.3103, 1.3026, 1.2992, 1.2958, 1.2940, 1.2900, 1.2858, 1.2809, 1.2761
  • Resistance levels: 1.3220

From the point of view of technical analysis, the trend on the USD/CAD currency pair is bullish. The price is now trading above the moving averages. The MACD indicator is in the positive zone, but there are signs of divergence. Under such market conditions, buy trades should be considered on the lower time frames from the support levels of 1.3103 or 1.3026, but only with confirmation. For sell deals, it is better to consider the resistance level of 1.3220, but only after additional confirmation, as the level has already been tested.

Alternative scenario: if the price breaks down and consolidates below the 1.2992 support level, the downtrend will likely resume.

USD/CAD
News feed for 2022.09.02:
  • – US Nonfarm Payrolls (m/m) at 15:30 (GMT+3);
  • – US Unemployment Rate (m/m) at 15:30 (GMT+3).

By JustForex


This article reflects a personal opinion and should not be interpreted as an investment advice, and/or offer, and/or a persistent request for carrying out financial transactions, and/or a guarantee, and/or a forecast of future events.

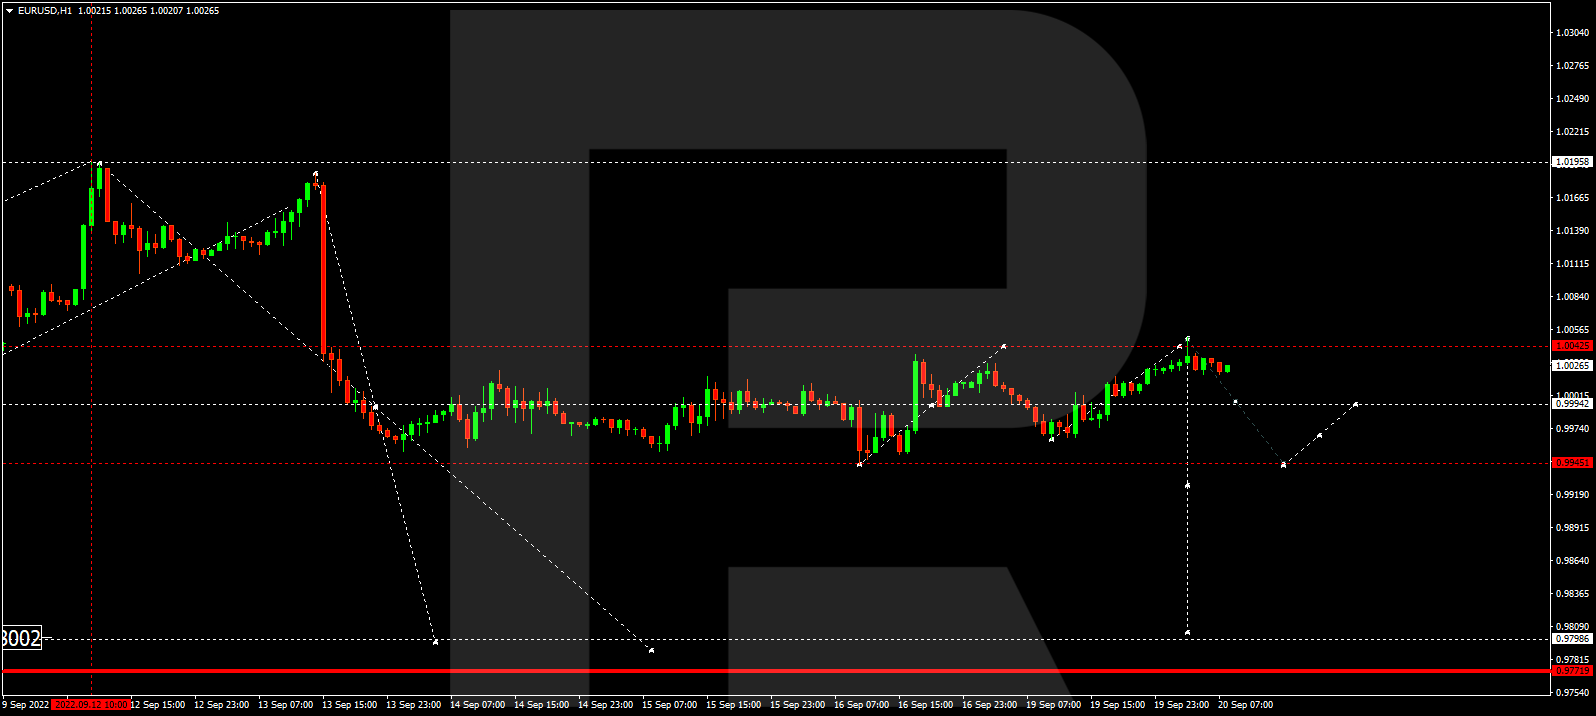
The probability of a 0.75% interest rate hike by the ECB increased to 80%

By JustForex

At the close of the US stock market yesterday, the Dow Jones index (US30) added 0.46%. The S&P 500 Index (US500) increased by 0.30%. The NASDAQ Technology Index (US100) lost 0.26%

The ISM Manufacturing Index was 52.8 in August, unchanged from July and beating the consensus forecast of 51.9. Expectations for a third straight 75 basis point rate hike in the US at the Fed’s September 20-21 meeting are rising on solid economic data, with Fed funds futures indicating a 77.1% chance of such an increase. Market attention now turns to the August US Nonfarm Payrolls report, which will be one of the key reports ahead of the Fed meeting. Although the US economy contracted in the first half of the year, the robust labor market defies talk of a recession and encourages the Federal Reserve to keep raising rates.

According to Swiss investment bank UBS, the likelihood of a recession in the US economy over the next year has risen to 60%. Earlier the probability of recession was 40%. Such a forecast was given by the bank based on 3 recession indicators monitored: macroeconomic data, the U.S. Treasury bond yield curve, and credit data.

European stock indices started September weak, falling to a seven-week low amid growing concerns over slowing economic growth, aggressive interest rate hikes, and record-high inflation. German DAX (DE30) fell yesterday by 1.60%, French CAC 40 (FR40) was down by 1.48%, Spanish IBEX 35 (ES35) lost 1.02%, British FTSE 100 (UK100) closed 1.05% lower. Manufacturing activity in the Eurozone declined slightly over the last month, but the decline was mainly due to a sharp drop in activity in Italy. In Germany, France, and Spain manufacturing activity rose in August, but figures are near the median level of 50. German retail sales rose unexpectedly in July, up 1.9% from the previous month, as online retailing and the food sector showed a recovery. Markets are estimating a roughly 80% chance of a 75 basis point rate hike by the European Central Bank next week, up from just over a 50% chance a day earlier.

New lockdowns in China, triggered by COVID-19 concerns, extended the sell-off in oil for a third straight day, increasing the probability that US crude may fall below $85 a barrel for the first time since late January. OPEC+ countries will meet on September 5. If OPEC+ does not announce any cuts at that time, oil prices could continue to fall due to concerns about seasonally weak demand in the fall. Adding to the uncertainty is the resurgence of the US-Iran nuclear deal, which Iran is very much seeking, and Israel strongly opposes. At stake is the potential lifting of US sanctions on Iranian oil, which could add up to a million barrels per day to the global crude oil export market.

Asian markets traded lower yesterday. Japan’s Nikkei 225 (JP225) was down by 1.53%, Hong Kong’s Hang Seng (HK50) ended the day down by 1.79%, and Australia’s S&P/ASX 200 (AU200) closed at 2.02%.

South China’s Shenzhen technology center tightened restrictions against COVID-19, as the number of cases continues to rise. Large events and indoor entertainment have been suspended for three days. Manufacturing activity in Asia plummeted in August, as China’s COVID-19 restrictions and cost pressures continue to hurt business.

S&P 500 (F) (US500) 3,966.85 −31.16 (−0.30%)

Dow Jones (US30) 31,656.42 +145.99 (−0.46%)

DAX (DE40) 12,630.23 -204.73 (−1.60%)

FTSE 100 (UK100) 7,148.50 −135.65 (−1.86%)

USD Index 109.63 +0.93 (+0.86%)

Important events for today:
  • – Switzerland Unemployment Rate (m/m) at 09:30 (GMT+3);
  • – Eurozone Producer Price Index (m/m) at 12:00 (GMT+3);
  • – US Nonfarm Payrolls (m/m) at 15:30 (GMT+3);
  • – US Unemployment Rate (m/m) at 15:30 (GMT+3).

By JustForex


This article reflects a personal opinion and should not be interpreted as an investment advice, and/or offer, and/or a persistent request for carrying out financial transactions, and/or a guarantee, and/or a forecast of future events.