Murrey Math Lines 16.09.2022 (Brent, S&P 500)

Article By RoboForex.com

BRENT

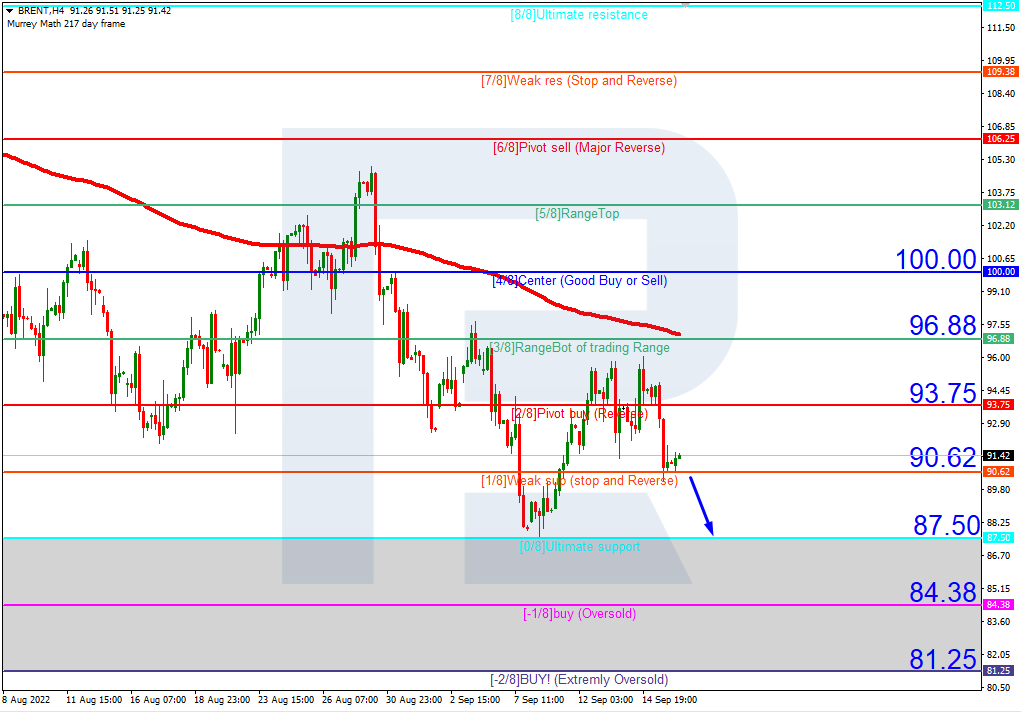
On H4, oil quotes are under the 200-day Moving Average, which indicates a downtrend. A downwards breakaway of 1/8 and subsequent falling to the support level of 0/8 should be expected. The scenario can be canceled by rising over the resistance level of 2/8, which might make the price rise to 3/8.

BRENTH4
Risk Warning: the result of previous trading operations do not guarantee the same results in the future

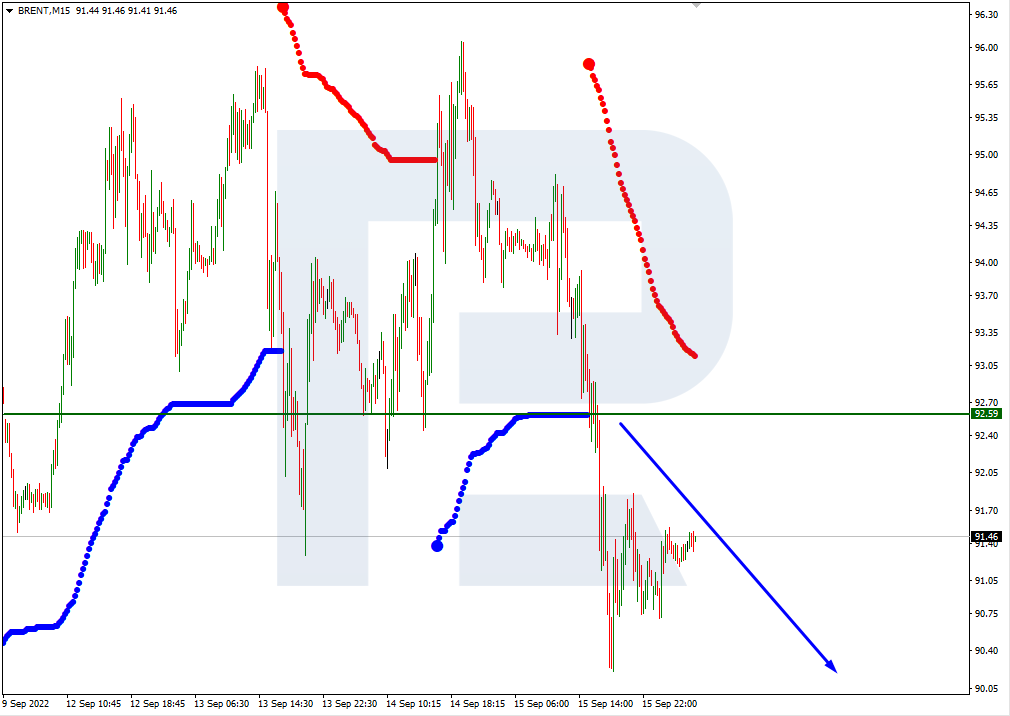
On M15, the lower line of VoltyChannel is broken away, which confirms the downtrend and a high probability of further price falling.

BRENT_M15
Risk Warning: the result of previous trading operations do not guarantee the same results in the future

S&P 500

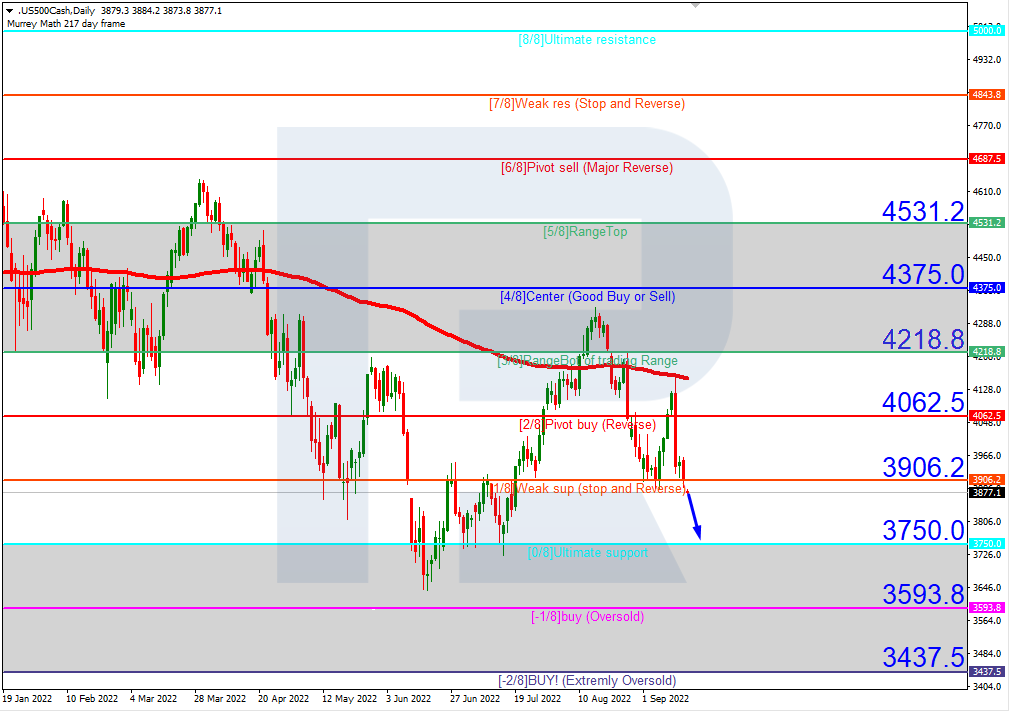
On H4, the index is under the 200-day Moving Average, which indicates a downtrend. Further falling of the quotes to the nearest support level of 0/8 is expected. The scenario can be cancelled by rising over the resistance level of 1/8, in which case the index might rise to 2/8.

S&P 500_H4
Risk Warning: the result of previous trading operations do not guarantee the same results in the future

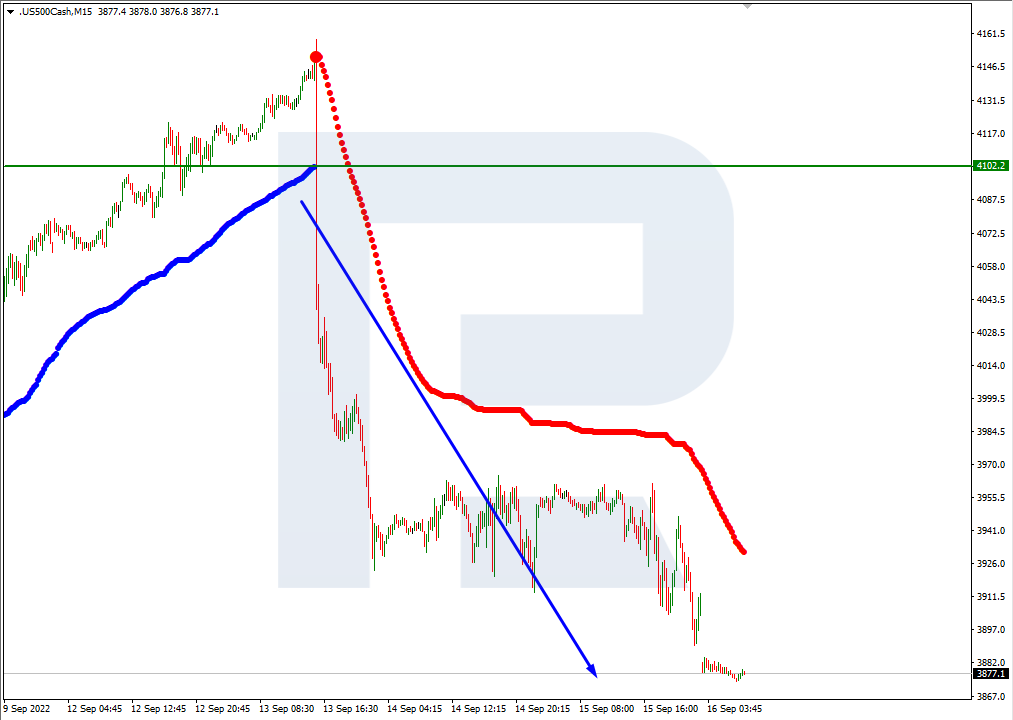
On M15, the lower line of VoltyChannel is broken away, which confirms the probability of further price falling.

S&P 500_M15

Article By RoboForex.com

Attention!
Forecasts presented in this section only reflect the author’s private opinion and should not be considered as guidance for trading. RoboForex LP bears no responsibility for trading results based on trading recommendations described in these analytical reviews.

The Analytical Overview of the Main Currency Pairs on 2022.09.16

By JustForex

The EUR/USD currency pair

Technical indicators of the currency pair:
  • Prev Open: 0.9972
  • Prev Close: 0.9994
  • % chg. over the last day: +0.22 %

New Eurozone inflation data will be released today. Analysts forecast that the Consumer Price Index will not change and will remain at the same level. But there may be surprises in the form of a new round of price acceleration, so investors should keep a close eye on the report. Volatility in currency pairs with the euro will increase.

Trading recommendations
  • Support levels: 0.9971, 0.9912
  • Resistance levels: 1.0111, 1.0162, 1.0230

From the technical point of view, the trend on the EUR/USD currency pair on the hourly time frame is bullish. The price is trading in a narrow range, and a sharp impulse movement is expected. The MACD indicator has become inactive. Under such market conditions, it is best to look for buy deals on intraday time frames from the support level of 0.9912, but with confirmation. Sell trades can be considered from resistance levels of 1.0111 or 1.0162.

Alternative scenario: if the price breaks down through the support level of 0.9912 and fixes below, the downtrend will likely resume.

EUR/USD
News feed for 2022.09.16:
  • – Eurozone Italian Consumer Price Index (m/m) at 12:00 (GMT+3);
  • – Eurozone Consumer Price Index (m/m) at 12:00 (GMT+3);
  • – US Michigan Consumer Sentiment (m/m) at 17:00 (GMT+3).

The GBP/USD currency pair

Technical indicators of the currency pair:
  • Prev Open: 1.1541
  • Prev Close: 1.1462
  • % chg. over the last day: -0.69 %

The pound is one of the major currencies with the worst performance in 2022 due to expectations of a prolonged recession, sustained high inflation, and political instability. New Prime Minister Liz Truss’s plans to finance a giant energy support package by increasing borrowing have heightened investor fears about the long-term prospects of the British economy. The Bank of England (BoE) will meet next week and is expected to raise interest rates by at least 50 basis points (bps), perhaps even 75 bps, as it looks to slow inflation. According to Refinitiv, money markets currently assume a 65% chance of a 75 basis point increase.

Trading recommendations
  • Support levels: 1.1449, 1.1400
  • Resistance levels: 1.1626, 1.1693, 1.1816, 1.1901, 1.1994, 1.2035, 1.2167

From the technical point of view, the GBP/USD currency pair trend on the hourly time frame is bullish. But at the moment, the price is trading below the moving averages again, and the MACD indicator is in the negative zone, but there are signs of divergence. Buy trades can be considered from the support level of 1.1449, but only with confirmation. Sell trades are best to look for on intraday time frames, and the nearest resistance level is 1.1626 or 1.1693.

Alternative scenario: if the price breaks down the support level of 1.1449 and fixes below it, the downtrend will likely resume.

GBP/USD
News feed for 2022.09.16:
  • – UK Retail Sales (m/m) at 09:00 (GMT+3).

The USD/JPY currency pair

Technical indicators of the currency pair:
  • Prev Open: 143.11
  • Prev Close: 143.46
  • % chg. over the last day: +0.25 %

Koichi Hagiuda, executive director of Japan’s ruling party, calls for $209 billion to fight inflation and the weak yen. A senior Japanese ruling party official suggested Thursday that a stimulus package worth more than 30 trillion yen is needed to address inflationary pressures in Japan’s economy. Haguida’s remarks followed Prime Minister Fumio Kishida’s comments last week that the government would prepare a new economic package in October to soften the blow that rising prices are taking on households and businesses. The government has unveiled short-term stimulus measures that include financial support for low-income households, tax exemptions for residents, and an extension of gasoline subsidies and other measures through the end of the year.

Trading recommendations
  • Support levels: 142.88, 141.77, 141.00, 139.61, 138.78, 137.65, 136.80, 135.20
  • Resistance levels: 144.22, 145.00

From the technical point of view, the medium-term trend on the currency pair USD/JPY is bullish. The price is trading at the level of moving averages. The MACD indicator has become inactive. Under such market conditions, buy trades can be sought from the support level of 142.88, but with additional confirmation. Sell deals can be sought on intraday time frames from the resistance level of 144.22 or 145.00, but only with additional confirmation since the USD/JPY is inclined to grow.

Alternative scenario: If the price fixes below 141.00, the downtrend will likely resume.

USD/JPY
There is no news feed for today.

The USD/CAD currency pair

Technical indicators of the currency pair:
  • Prev Open: 1.3167
  • Prev Close: 1.3226
  • % chg. over the last day: +0.45 %

The Canadian dollar has fallen to its lowest level against the US dollar since 2020. Despite falling more than 4% this year against its US counterpart, the Canadian dollar will remain one of the best-performing currencies in the world in 2022. The economy has been helped by higher commodity and energy prices as well as reduced COVID restrictions, with growth actually accelerating in the second quarter even as fears about the global economic crisis intensified.

Trading recommendations
  • Support levels: 1.3220, 1.3053, 1.2990, 1.2958, 1.2936, 1.2900
  • Resistance levels: 1.3326

From the point of view of technical analysis, the trend on the USD/CAD currency pair is bullish. The price is trading above the moving averages, and the MACD indicator is in the positive zone, but there are the first signs of divergence. Under such market conditions, buy trades should be considered on the lower time frames from the support level of 1.3220. For sell deals, it is better to consider the resistance level of 1.3326, but only after an additional confirmation in the form of a false breakout.

Alternative scenario: if the price breaks down and consolidates below the 1.2990 support level, the downtrend will likely resume.

USD/CAD
There is no news feed for today.

By JustForex


This article reflects a personal opinion and should not be interpreted as an investment advice, and/or offer, and/or a persistent request for carrying out financial transactions, and/or a guarantee, and/or a forecast of future events.

Gold continues to fall in price. The focus is on CPI data in Europe

By JustForex

Rosenberg Research’s chief economist expects the US Central Bank to raise interest rates by 75 basis points when it meets later this month. However, he urged the Fed to temporarily suspend its hike program because the US economy is already under pressure. According to Rosenberg, the Fed’s current rate hike program will punish long-term bondholders whose fixed-income assets are particularly sensitive to interest rate changes. Rosenberg added that he expects the US economy to come out of the Fed-induced recession (which will be 100%) only after it has gone through a period of deflation, allowing policymakers to start lowering interest rates.

The US retail sales rose unexpectedly after falling the previous month. The value of total retail purchases increased by 0.3% last month after a downwardly revised drop of 0.4% in July. Excluding fuel prices, retail sales increased by 0.8%.

The S&P 500 Index fell Thursday as energy and technology stocks fell, with the latter under pressure from rising Treasury yields as investors expect the Federal Reserve to raise its interest rate further to curb inflation. At yesterday’s close of the stock market, the Dow Jones Index (US30) decreased by 0.56%, and the S&P 500 Index (US500) lost 1.13%. The NASDAQ Technology Index (US100) fell by 1.43%.

According to the Fed’s rate monitoring tool, a 75 basis point rate hike next week is already priced in. But rising inflation and continued strength in the labor market are forcing a bet on higher and longer rates.

Equity markets in Europe traded without a single dynamic yesterday. Germany’s DAX (DE30) decreased by 0.55%, France’s CAC 40 (FR40) lost 1.04%, Spain’s IBEX 35 (ES35) added 0.37%, Britain’s FTSE 100 (UK100) closed by 0.07%.

New inflation data will be published today in the Eurozone. Analysts forecast that the consumer price index will not change and will remain at the same level. But there may be surprises in the form of a new round of price acceleration, so investors should keep a close eye on the report.

European Union lawmakers voted Thursday overwhelmingly to condemn the damage to democracy in Hungary under Prime Minister Viktor Orban, increasing pressure on the bloc to cut funding for the former communist country. Citing corruption risks, the European Commission is expected to recommend later this week that billions of dollars earmarked for Budapest be suspended from the bloc’s total 1.1 trillion-euro budget. “The situation has deteriorated to the point where Hungary has become a ‘selective autocracy’ rather than a democracy,” the chamber said in a statement. The European Commission has already blocked about 6 billion euros owed to Budapest from the bloc’s separate economic stimulus package for COVID-19, citing insufficient measures against bribery in Hungarian public procurement.

Gold is approaching a 2.5-year low due to excessive investor panic over interest rates. Tighter monetary policy is taking its toll on precious metals, and until rates stop rising and US Treasury yields start to decline, gold and silver will continue to be under selling pressure.

Asian markets were trading higher yesterday. Japan’s Nikkei 225 (JP225) gained 0.21%, Hong Kong’s Hang Seng (HK50) added 0.44% on the day, while Australian S&P/ASX 200 (AU200) gained 0.21%.

Alarming signals are emerging for the Chinese economy. Last week’s trade data showed export growth well below expectations and slowed for the first time in four months. It is very likely that China’s exports will slow further or even contract in the coming months as leading economic indicators point to slower global growth or even recession. Other data showed that retail sales and industrial production in China beat expectations in August. Core investment in the first eight months of the year also exceeded expectations despite major problems in the real estate sector.

The Governor of the Reserve Bank of Australia, Philip Lowe, said that the number of cases of excessive increase in interest rates has decreased. Lowe also said the Central Bank would discuss the benefits of a quarter-point or half-point increase at its October 4 meeting.

A Reuters poll showed that core inflation in Japan would reach an eight-year high in August. The nationwide core Consumer Price Index (CPI), which excludes food and fuel prices, will reach an annualized rate of 2.7%.

S&P 500 (F) (US500)  3,901.35  −44.66  (−1.13%)

Dow Jones (US30) 30,961.82 −173.27 (−0.56%)

DAX (DE40) 12,956.66 −71.34 (−0.55%)

FTSE 100 (UK100)  7,282.07 +4.77 (+0.066%)

USD Index 109.71 +0.05 (+0.04%)

Important events for today:
  • – China Industrial Production (m/m) at 05:00 (GMT+3);
  • – China Retail Sales (m/m) at 05:00 (GMT+3);
  • – China Unemployment Rate (m/m) at 05:00 (GMT+3);
  • – UK Retail Sales (m/m) at 09:00 (GMT+3);
  • – Eurozone Italian Consumer Price Index (m/m) at 12:00 (GMT+3);
  • – Eurozone Consumer Price Index (m/m) at 12:00 (GMT+3);
  • – US Michigan Consumer Sentiment (m/m) at 17:00 (GMT+3).

By JustForex


This article reflects a personal opinion and should not be interpreted as an investment advice, and/or offer, and/or a persistent request for carrying out financial transactions, and/or a guarantee, and/or a forecast of future events.

Week Ahead: Fed to fan red-hot US dollar?

By ForexTime

The coming week will feature central bank decisions galore!

Take your pick: the US Federal Reserve, the Bank of England (meeting delayed from last week), the Bank of Japan, and Norges Bank (the central bank of Norway) are all set to hold their respective policy meetings.

Though of course, the Fed surely takes centre stage considering that it’s the most powerful central bank in the world and holds so much sway across global financial markets.

Here’s what to expect for the coming week:


Monday, September 19

  • UK markets closed for funeral of Queen Elizabeth II

Tuesday, September 20

  • JPY: Japan August CPI
  • CNH: China loan prime rates
  • AUD: RBA September meeting minutes
  • CAD: Canada August CPI

Wednesday, September 21

  • USD: Fed rate decision
  • US crude: EIA weekly oil inventory report

Thursday, September 22

  • NZD: New Zealand 3Q consumer confidence, August external trade
  • JPY: Bank of Japan policy decision
  • NOK: Central Bank of Norway rate decision
  • GBP: Bank of England rate decision
  • USD: US weekly initial jobless claims
  • EUR: Eurozone September consumer confidence

Friday, September 23

  • AUD: Australia September PMIs
  • EUR: Eurozone September PMIs
  • GBP: UK September PMIs and consumer confidence
  • CAD: Canada July retail sales


Here’s what markets are forecasting for the upcoming Fed decision due mid-week:

  • 75 basis point hike fully priced in.
  • 25% chance of a 100bps hike.
  • US interest rates to peak around 4.5% by March 2023 (from the current 2.5%, before the September FOMC meeting next week).
    That’s an extra 50 basis points on top of the 4% peak forecasted just this time last week (before the latest US CPI was released – more on that in a bit).

Such hawkish expectations (that the Fed would have to trigger more of these outsized rate hikes to combat stubbornly elevated inflation) has restored this equally-weighted US dollar index back to its recent peak, trading around levels not seen since the onset of the global pandemic.


The ramp-up in expectations for a more aggressive Fed came in the wake of the US August consumer price index (CPI) released on September 13th.

We learned that inflation rose by a higher-than-expected 8.3% in August, compared to the 8.1% figure forecasted by economists.

The core CPI print (excluding more volatile items such as food and energy prices) also came in 0.2 percentage points above the forecasted 6.1% figure.

In other words, US inflation remains stubbornly elevated, despite the Fed having already hiked by 225 basis points since March.


Recall how before this week’s US CPI release, some segments of the markets believed that the Fed may just be contented with a 50bps hike at the September FOMC meeting.

Such expectations have been dashed by the hotter-than-expected August CPI that was unveiled earlier this week.


The higher-than-expected inflation numbers are set to frame the Fed’s upcoming pivotal decision.

  • Should the Fed indeed trigger that gargantuan 100bps hike, that may send this equally-weighted USD index up to 1.23, a fresh 2-year high.

    That 1.23 region may offer initial resistance for this USD index, as it did back in May 2020. Stronger resistance is set to arrive around 1.25, as was the case back in early April 2020.

  • However, should the Fed unexpectedly deliver a dovish shocker, perhaps by triggering only a 50bps hike or suggesting that most of its intended rate hikes are already in the past, that could see this USD index swiftly unwinding recent gains.

    A moderating greenback would in turn allow the rest of the FX space room to breath a massive sigh of relief.


Forex-Time-LogoArticle by ForexTime

ForexTime Ltd (FXTM) is an award winning international online forex broker regulated by CySEC 185/12 www.forextime.com

Ichimoku Cloud Analysis 15.09.2022 (GBPUSD, USDCAD, NZDUSD)

Article By RoboForex.com

GBPUSD, “Great Britain Pound vs US Dollar”

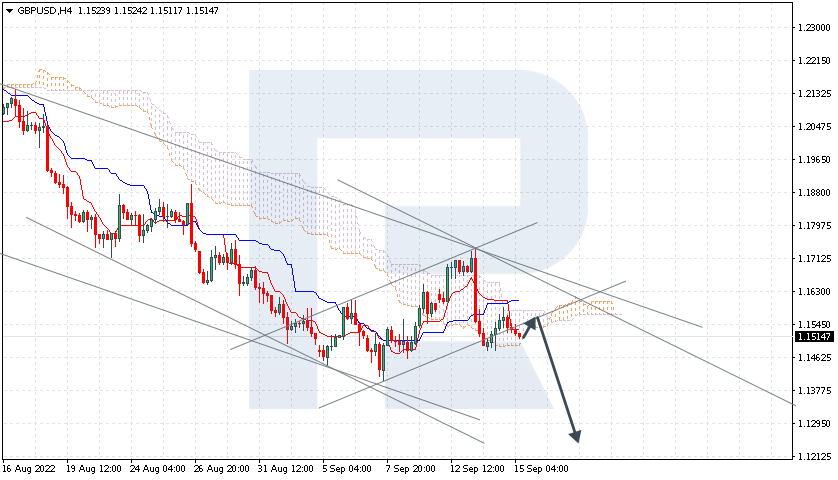
The pair is testing the support level. It is going inside the Cloud, which means the prevalence of a flat. A test of the upper border of the Cloud is expected at 1.1545, followed by falling to 1.1275. The decline will be signaled by a bounce off the lower border of the bullish channel. The scenario can be cancelled by a breakaway of the upper border of the Cloud and securing above 1.1635, which will indicate further growth to 1.1725.

GBPUSD
Risk Warning: the result of previous trading operations do not guarantee the same results in the future

USDCAD, “US Dollar vs Canadian Dollar”

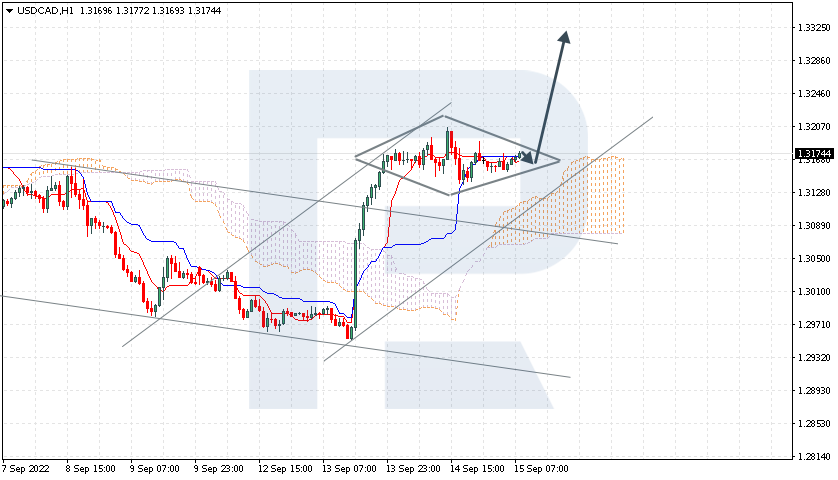
The pair is pushing off the signal lines of the indicator, going above the Ichimoku Cloud, which means an uptrend. A test of the Kijun-Sen line at 1.3165 is expected, followed by growth to 1.3325. An additional signal supporting the growth will be a bounce off the lower border of the bullish channel. The growth can be cancelled by a breakaway of the lower border of the Cloud and securing under 1.3035, which will mean further falling to 1.2945. The growth will also be confirmed by a breakaway of the upper border of the Diamond pattern and securing above 1.3210.

USDCAD
Risk Warning: the result of previous trading operations do not guarantee the same results in the future

NZDUSD, “New Zealand Dollar vs US Dollar”

The pair has secured under the lower border of the bullish channel. The pair is going under the Cloud, which implies a downtrend. A test of the Kijun-Sen line is expected at 0.6045, followed by falling to 0.5835. An additional signal confirming the decline will be a bounce off the lower border of the bullish channel. The scenario can be cancelled by a breakaway of the upper border of the Cloud and securing above 0.6105, which will entail further growth to 0.6200.

NZDUSD

Article By RoboForex.com

Attention!
Forecasts presented in this section only reflect the author’s private opinion and should not be considered as guidance for trading. RoboForex LP bears no responsibility for trading results based on trading recommendations described in these analytical reviews.

Why is gold back below $1700?

By ForexTime

Spot gold is currently trading below the psychologically-important $1700 level, and is on course towards revisiting the lows seen in mid-June.


Here are more data points that make for gloomy reading for gold bulls (those hoping that gold prices will climb):

  • Gold has fallen by 7.8% so far this year
  • Gold has suffered 5 straight months of declines (April – August), its longest monthly losing streak since 2018
  • Bullion-backed ETFs have lowered their gold holdings for a 13th consecutive day (i.e. investors are ditching gold)

So why has gold performed so poorly so far in 2022?

It’s all down to the Federal Reserve.

And here’s a quick summary of what you’re about to read:

More Fed rate hikes = stronger US dollar / higher US Treasury yields = lower gold

To better understand the forces that are driving gold prices lower, read on.

Why is the Fed raising interest rates?

The US Federal Reserve has been raising interest rates as the central bank’s main policy weapon against stubbornly persistent inflation.

The August consumer price index (used to measure the headline inflation rate) released earlier this week showed a higher-than-expected 8.3% growth.

While that 8.3% number is lower than June’s 9.1% CPI, it’s still about 4 times higher than the Fed’s 2% inflation target.

In other words, inflation is still stubbornly high despite the Fed having already hiked rates by 225 basis points since March, and counting, to try and bring that inflation down.

The inflation data suggests that the Fed has to hike rates even higher:

  • Markets are forecasting a 25% chance of a 100 basis point hike at its FOMC policy meeting next week.
    If such a gargantuan move happens, that 100bps move would be 4 times bigger than the usual 25bps adjustments per policy meeting typically employed by major central bankers, at least over the past few decades.
  • Markets currently expect US interest rates to peak at around 4.4%, from the current 2.5%, excluding next week’s expected hike.
    That’s a major shift compared to expectations as of just last week, when markets expect US rates to peak at 4%.
    With these updated expectations, that suggests another 190 basis points more that US interest rates could climb.

How do Fed rate hikes influence gold prices?

Here’s a oversimplified narrative for how the above works:

  1. Fed sends US interest rates higher, investors then ditch US Treasuries, pushing Treasury prices lower.
  2. As US Treasury prices fall, their yields go up (investors get paid a higher interest from holding on to those US government bonds).
  3. When US Treasury yields go up, they eventually become more attractive to foreign investors.
  4. These investors then buy up the US dollar, so they can purchase more US assets.

But when the US dollar/yields climb, gold becomes less appealing because of these two features for the precious metal:

  1. Gold is a zero-yielding asset.
    Investors do not get paid any income for holding on to gold.

    Hence, when investors are promised higher yields on US Treasuries, they tend to favor lending their money to the US government in return for those higher interest payments, as opposed to parking their money in gold which does not pay interest.

  2. Also, gold has an inverse relationship with the US dollar.
    When the dollar goes up, gold typically goes down, and vice versa.

    This is because, when foreign investors need to use more of their currency to buy the more-expensive US dollar in order to purchase gold (the precious metal’s benchmark price is denominated in US dollars), those expensive price tags then make gold less appealing.

    ECONS 101: Demand falls when prices go up.


Here’s a chart showing how much the US dollar has risen this year, as measures by the DXY (the benchmark index used to measure the US dollar’s overall performance against its G10 peers) which is now at its highest levels since 2002.

READ MORE:


So where to next for gold?

At least gold bulls can take heart from the price action since mid-2020, whereby forays below $1700 have proved short-lived.

As you can see on the weekly chart below, quite a few notable support levels can be seen in a wide range between $1660.03 – $1685.15.

Gold’s 200-week simple moving average (SMA) also hovers in this region ($1676 at the time of writing). This major technical indicator potentially offering support as well.

In other words, gold may not have that much further to fall, provided these support levels close by do hold up.


However, once you strip away the wild price swings at the onset of the global pandemic, there appears to be little by way of major support before hurtling down to sub-$1600 levels.

Alternatively, one could employ the price action from back in the 2011-2013 period to draw support levels.

Though bear in mind, support levels from a decade ago are less relevant to today’s markets, given the substantially different market and macroeconomic environment that we currently find ourselves (e.g. US inflation being at its highest in over 40 years).


Overall, gold’s safe haven status has clearly been eroded by the Fed’s ongoing rate-hiking cycle.

Despite the still-raging war in the Ukraine, along with rising fears of a looming global recession, the precious metal’s traditional role as a way to preserve investors’ wealth has been found lacking, in light of the downward pressures stemming from rising US yields and the dollar.


Ultimately, gold’s immediate fortunes will likely depend on how high markets expect the Fed to send interest rates.

As things stand, markets are forecasting that US interest rates will peak at 4.4% by March, from the 2.5% currently (before next week’s highly-anticipated FOMC rate decision).

If markets believe that the Fed has to send interest rates even higher past 4.4% in order to subdue the inflation beast, that should heap more downward pressure on gold prices.


Forex-Time-LogoArticle by ForexTime

ForexTime Ltd (FXTM) is an award winning international online forex broker regulated by CySEC 185/12 www.forextime.com

Japanese Candlesticks Analysis 15.09.2022 (EURUSD, USDJPY, EURGBP)

Article By RoboForex.com

EURUSD, “Euro vs US Dollar”

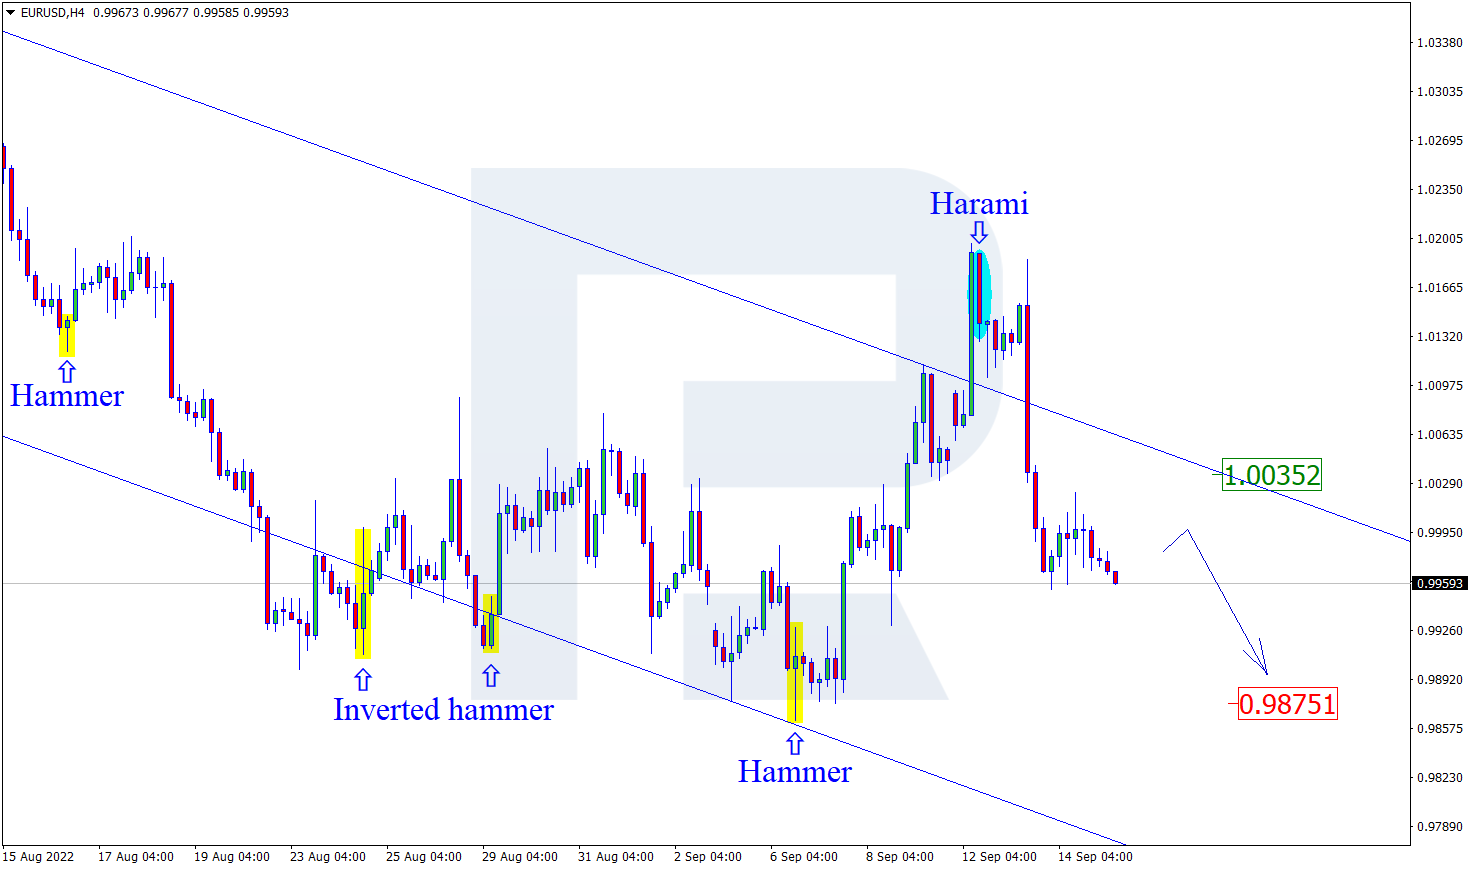
On H4, at the resistance level, the pair has formed a reversal pattern Harami. The quotes can go by the signal in a descending impulse, possibly aiming at 0.9875. However, the price may grow to 1.0035 and bounce off this level, continuing the downtrend after the correction.

EURUSD
Risk Warning: the result of previous trading operations do not guarantee the same results in the future

USDJPY, “US Dollar vs Japanese Yen”

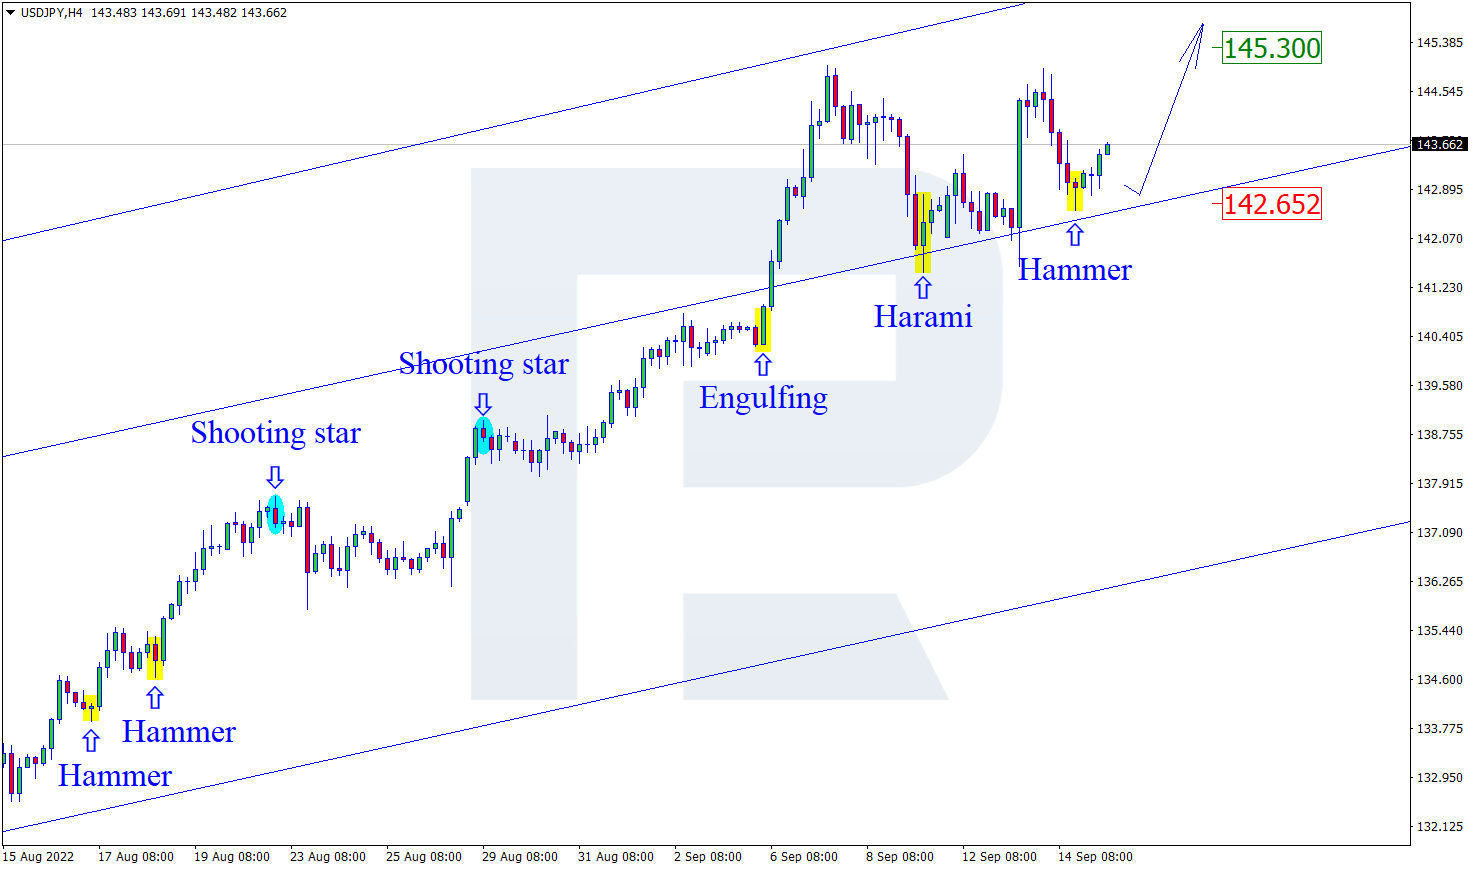
On H4, at a pullback, the pair has formed a reversal pattern Hammer. Going by the signal, the pair has formed an ascending impulse. The goal of growth is still 145.30. However, the price may still pull back to 142.65 and continue the uptrend after the correction to the support level.

USDJPY
Risk Warning: the result of previous trading operations do not guarantee the same results in the future

EURGBP, “Euro vs Great Britain Pound”

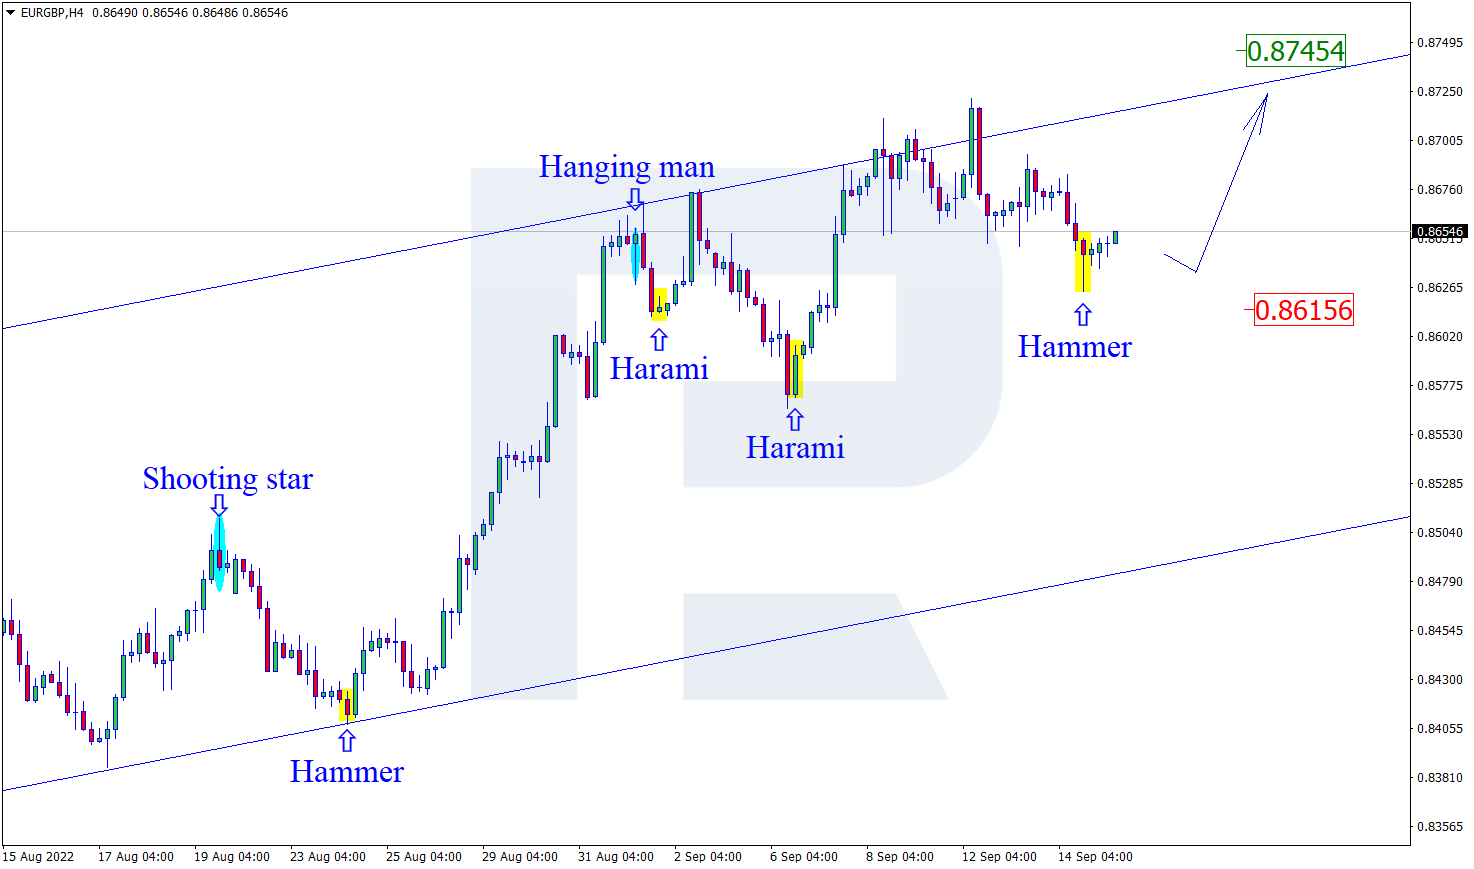
On H4, at a pullback near the support level, the pair has formed a reversal pattern Hammer. The signal of the pattern may now provoke an impulse of growth. The goal of the impulse may still be 0.8745. Upon testing it and breaking through it, the price may continue the uptrend. However, a correction to 0.8615 before continuing the uptrend should not be excluded.

EURGBP

Article By RoboForex.com

Attention!
Forecasts presented in this section only reflect the author’s private opinion and should not be considered as guidance for trading. RoboForex LP bears no responsibility for trading results based on trading recommendations described in these analytical reviews.

The Analytical Overview of the Main Currency Pairs on 2022.09.15

By JustForex

The EUR/USD currency pair

Technical indicators of the currency pair:
  • Prev Open: 0.9965
  • Prev Close: 0.9979
  • % chg. over the last day: +0.14 %

Industrial production in the Eurozone has decreased by 2.3% over the last month. These statistics clearly indicate that the region’s economy is struggling. ECB Governing Council spokesman Francois Villeroy de Galhau said Wednesday that interest rates in the Eurozone could reach 2% by year’s end. Another Governing Council representative, Gediminas Simkus, head of Lithuania’s Central Bank, said the Central Bank should raise interest rates by at least half a point at its October meeting. ECB President Philip R. Lane indicated yesterday that, based on current estimates, the ECB should stick with further interest rate hikes over the next few meetings. The new projections call for inflation to average 8.1% in 2022, 5.5% in 2023, and 2.3% in 2024

Trading recommendations
  • Support levels: 0.9971, 0.9912
  • Resistance levels: 1.0111, 1.0162, 1.0230

From the technical point of view, the trend on the EUR/USD currency pair on the hourly time frame is bullish. But the price formed a false breakout zone above the level of 1.0111 and returned to the wide range. The MACD indicator became negative, and the sellers’ pressure intensified. Under such market conditions, it is best to look for buy trades on intraday time frames from the support level of 0.9972 or 0.9912, but with confirmation. Sell trades can be considered from the resistance levels of 1.0111 or 1.0162.

Alternative scenario: if the price breaks down through the support level of 0.9912 and fixes below, the downtrend will likely resume.

EUR/USD
News feed for 2022.09.15:
  • – Eurozone French Consumer Price Index (m/m) at 09:45 (GMT+3);
  • – US Retail Sales (m/m) at 15:30 (GMT+3);
  • – US Initial Jobless Claims (w/w) at 15:30 (GMT+3);
  • – US Philadelphia Fed Manufacturing Index (m/m) at 15:30 (GMT+3);
  • – US Industrial Production (m/m) at 16:15 (GMT+3).

The GBP/USD currency pair

Technical indicators of the currency pair:
  • Prev Open: 1.1491
  • Prev Close: 1.1538
  • % chg. over the last day: +0.41 %

The annual UK inflation rate unexpectedly fell to 9.9% due to lower fuel prices. But food prices rose as the country’s cost of living crisis continued. On a month-to-month basis, consumer prices increased by 0.5%, slightly below forecasts. Core inflation, which excludes energy, food, alcohol, and tobacco, rose by 0.8% month-over-month and to 6.3% year-over-year, in line with expectations. The Bank of England is set to announce its final monetary policy decision of the year next Thursday and is expected to choose a sharp 75 basis point interest rate hike as it helps slow inflation.

Trading recommendations
  • Support levels: 1.1503, 1.1449, 1.1400
  • Resistance levels: 1.1627, 1.1693, 1.1816, 1.1901, 1.1994, 1.2035, 1.2167

From the technical point of view, the GBP/USD currency pair trend on the hourly time frame is bullish. At the moment, the price is trading below the moving averages again, and the MACD indicator is in the negative zone. Buy trades can be considered from the support level of 1.1503 or 1.1449, but only with confirmation. Sell trades are best to look for on intraday time frames, and the nearest resistance level is 1.1627 and 1.1693.

Alternative scenario: if the price breaks down the support level of 1.1449 and fixes below it, the downtrend will likely resume.

GBP/USD
There is no news feed for today.

The USD/JPY currency pair

Technical indicators of the currency pair:
  • Prev Open: 144.54
  • Prev Close: 143.16
  • % chg. over the last day: -0.96 %

The Nikkei newspaper reported on Wednesday that the Bank of Japan conducted an interest rate check-in in apparent preparation for currency intervention, as policymakers stepped up warnings of a sharp drop in the yen. The Central Bank probably considers the recent changes in the yen’s exchange rate to be too extensive. Japanese Finance Minister Shunichi Suzuki also said that the yen’s recent moves have been “swift and one-sided,” which could prompt the government to back the currency. So far, this is all at the level of rumor and talk, which may help slow the yen’s depreciation, but is unlikely to change the trend unless dollar and UST yields fall precipitously or the Bank of Japan changes its policy.

Trading recommendations
  • Support levels: 142.88, 141.77, 141.00, 139.61, 138.78, 137.65, 136.80, 135.20
  • Resistance levels: 145.00

From the technical point of view, the medium-term trend on the currency pair USD/JPY is bullish. The price is trading at the level of moving averages. The MACD indicator has become inactive. Under such market conditions, buy trades can be sought from the support level of 142.88, but with additional confirmation. Sell deals can be considered on the intraday time frames from the level of 145.00, but only with additional confirmation, as fundamentally, USD/JPY quotes are inclined to growth.

Alternative scenario: If the price fixes below 141.00, the downtrend will likely resume.

USD/JPY
There is no news feed for today.

The USD/CAD currency pair

Technical indicators of the currency pair:
  • Prev Open: 1.3150
  • Prev Close: 1.3165
  • % chg. over the last day: +0.11 %

Canada’s Central Bank is holding interest rates at 3.25%, and it’s 0.75% higher than the US Fed. The US Central Bank is planning another 0.75% rate hike next week, which will flatten rates between the US and Canadian banks again. Thus, the imbalance in pricing will come mainly from oil prices alone since the Canadian dollar is a commodity currency. The growth of oil prices will contribute to the strengthening of the Canadian currency.

Trading recommendations
  • Support levels: 1.3053, 1.2990, 1.2958, 1.2936, 1.2900
  • Resistance levels: 1.3220

From the point of view of technical analysis, the trend on the USD/CAD currency pair is bullish. The price is trading above the moving averages, the MACD indicator is in the positive zone, and a narrow flat is forming. Under such market conditions, buy trades should be considered on the lower time frames from the support level of 1.3053 after the pullback. The best way to sell is to consider the resistance level of 1.3220, but only after an additional confirmation in the form of a false breakout.

Alternative scenario: if the price breaks down and consolidates below the 1.2990 support level, the downtrend will likely resume.

USD/CAD
There is no news feed for today.

By JustForex


This article reflects a personal opinion and should not be interpreted as an investment advice, and/or offer, and/or a persistent request for carrying out financial transactions, and/or a guarantee, and/or a forecast of future events.

The Merge is here: the most important crypto event since Bitcoin’s launch?

By George Prior 

The Ethereum Merge is a “landmark, historic moment” for the entire cryptocurrency market that will be a “major catalyst” driving prices higher in the long term, predicts the CEO of one of the world’s largest independent financial advisory, asset management and fintech organizations.

The bullish prediction from deVere Group’s Nigel Green comes as the long-awaited so-called Merge of the world’s second-largest crypto, Ethereum, has just happened.

The Merge is a major overhaul and switch over to a new operating model that will use 99.9% less energy and will reduce supply of the crypto.

He says: “The years-in-the-making Merge, a network-wide, grand scale upgrade is here.

“This is far-reaching overhaul of the most commercially important blockchain in the digital asset ecosystem is probably the most important, landmark event in crypto history, since the launch of Bitcoin.

“It transforms Ethereum from a proof-of-work to a proof-of-stake mechanism, which lowers transaction costs, enables the network to process more transactions in a shorter amount of time, and will slash energy consumption by a massive 99%.”

The deVere CEO and high-profile cryptocurrency advocate predicts that the “historic occurrence” will fuel prices across the market.

“Whilst some of the news has been priced-in already, let there be no mistake: this event will be a major catalyst driving prices higher in the long term,” he affirms.

“The slashing of energy consumption will be the main reason as it will become significantly more appealing to institutional investors, who bring with them enormous capital, expertise and reputational pull.

“Those institutional investors who have been sitting on the sidelines are now likely to move in.”

He goes on to add: “Besides having a more positive climate impact, The Merge’s effect of reducing supply, cutting costs and speeding up transactions will also appeal to both individuals and institutions.

“Due to the significance of The Merge, we expect the developments to bolster prices across the wider crypto market to some degree.”

Nigel Green has for many years spoken about the potential of Ethereum.  He has previously spoken in the media about it “being more useful than Bitcoin and having tech advantages over its better-known rival.”

He concludes: “The Merge represents a major boost not just for Ethereum but for blockchain technology itself.

“This is a momentous day for crypto.”

About:

deVere Group is one of the world’s largest independent advisors of specialist global financial solutions to international, local mass affluent, and high-net-worth clients.  It has a network of more than 70 offices across the world, over 80,000 clients and $12bn under advisement.


US wholesale inflation declines. The UK prepares energy support for business

By JustForex

According to a report from the US Bureau of Labor Statistics released Wednesday, the Producer Price Index, which reflects wholesale price levels, fell by 0.1%. Excluding food, energy, and trade services, the PPI rose by 0.2%. The PPI report fleshes out the US inflation picture and makes it not as bad as the August Consumer Price Index report. Inflation is clearly slowing as gas prices fall. But the process is slow, and inflation will likely remain well above the Fed’s target for at least a few more quarters.

At the moment, there is now a 33% chance of a 100 basis point Fed rate hike next week and a 36.1% chance of a rate hike to 4.75% by May 2023.

As the stock market closed yesterday, the Dow Jones Index (US30) increased by 0.09%, and the S&P 500 Index (US500) added 0.34%. The Technology Index NASDAQ (US100) jumped by 0.29% on Wednesday.

Equity markets in Europe were mostly down yesterday. German DAX (DE30) decreased by 1.22%, French CAC 40 (FR40) lost 0.37%, Spanish IBEX 35 (ES35) shed 0.10%, British FTSE 100 (UK100) closed yesterday down by 1.47%.

Banks in Germany reduced their holdings of banknotes and coins by a record 11 billion euros. There is plenty of reason to believe they will continue to reduce their non-interest-bearing cash reserves as the ECB interest rate will rise further in October.

The UK will unveil an energy support package for businesses next week. Thousands of businesses are facing steep increases in energy prices as many fixed-price contracts expire, raising fears that the promised support will not be delivered in time. Conversations between government officials and companies have so far failed to provide details about what unit price the government will set for companies or when it is likely to go into effect.

The prospect of using more oil to heat Europe in winter as Russia blackmails gas cuts has helped oil prices rise for the fourth time in five days. Also boosting the market was a smaller rise in US crude inventories reported by the government over the past week. The American Petroleum Institute said crude inventories rose by 6.035 million barrels on September 9.

Spot gold prices traded below a key support level of $1700 on Thursday, extending recent declines, as concerns over more aggressive Federal Reserve measures continue to weaken metals markets.

Asian markets were trading lower yesterday. Japan’s Nikkei 225 (JP225) decreased by 2.78%, Hong Kong’s Hang Seng (HK50) ended the day down by 2.48%, and Australia’s S&P/ASX 200 (AU200) ended Wednesday down by 2.58%.

The Chinese say they are increasingly feeling the rise in prices, although official data shows that the inflation rate is much lower than in the US and other countries. China’s Consumer Price Index hit a two-year high in July, rising to an annualized 2.7%. The Index slowed to an annualized 2.5% in August.

Japan’s efforts to stem the yen’s plunge with market interventions will be limited, a senior member of the country’s ruling party warned, as data showed that the currency’s recent slide has led to a record trade deficit.

A slight rise in the unemployment rate (from 3.4% to 3.5%) may prompt the Reserve Bank of Australia (RBA) to slow growth to 25 basis points at its next meeting.

New Zealand’s GDP rose by 1.7% in the last quarter. The growth drivers were air transport and transportation services. Drivers of the downturn are declines in manufacturing and construction.

S&P 500 (F) (US500)  3,946.01 +13.32  (+0.34%)

Dow Jones (US30) 31,135.09 +30.12 (+0.097%)

DAX (DE40) 13,028.00 −160.95 (−1.22%)

FTSE 100 (UK100)  7,277.30 −108.56 (−1.47%)

USD Index 109.67 −0.15 (−0.14%)

Important events for today:
  • – New Zealand GDP (q/q) at 01:45 (GMT+3);
  • – Australia Unemployment Rate (m/m) at 04:30 (GMT+3);
  • – Eurozone French Consumer Price Index (m/m) at 09:45 (GMT+3);
  • – US Retail Sales (m/m) at 15:30 (GMT+3);
  • – US Initial Jobless Claims (w/w) at 15:30 (GMT+3);
  • – US Philadelphia Fed Manufacturing Index (m/m) at 15:30 (GMT+3);
  • – US Industrial Production (m/m) at 16:15 (GMT+3);
  • – US Natural Gas Storage (w/w) at 17:30 (GMT+3).

By JustForex


This article reflects a personal opinion and should not be interpreted as an investment advice, and/or offer, and/or a persistent request for carrying out financial transactions, and/or a guarantee, and/or a forecast of future events.