
By InvestMacro
Here are the latest charts and statistics for the Commitment of Traders (COT) data published by the Commodities Futures Trading Commission (CFTC).
The latest COT data is updated through Tuesday September 13th and shows a quick view of how large traders (for-profit speculators and commercial entities) were positioned in the futures markets.
Weekly Speculator Changes led lower by Natural Gas and Gasoline
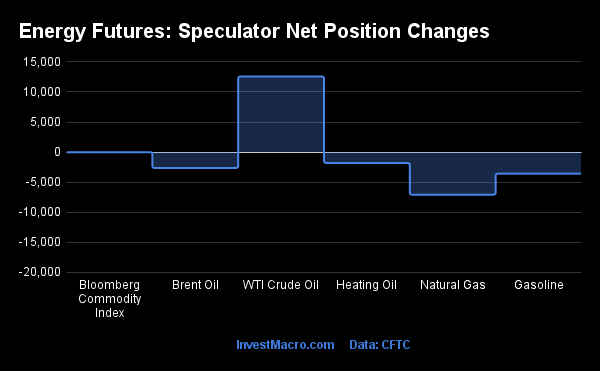
The COT energy market speculator bets were sharply lower this week as just one out of the six energy markets we cover had higher positioning this week while the other five markets had lower contracts.
Free Reports:
 Get our Weekly Commitment of Traders Reports - See where the biggest traders (Hedge Funds and Commercial Hedgers) are positioned in the futures markets on a weekly basis.
 Download Our Metatrader 4 Indicators – Put Our Free MetaTrader 4 Custom Indicators on your charts when you join our Weekly Newsletter
Leading the gains for energy markets was WTI Crude Oil with a total gain on the week of 12,579 contracts.
The energy markets leading the declines in speculator bets this week were Natural Gas (-7,077 contracts), Gasoline (-3,574 contracts) and Brent Crude Oil (-2,635 contracts) with Heating Oil (-1,796 contracts) and Bloomberg Commodity Index (-14 contracts) also having lower bets on the week.
| Sep-13-2022 | OI | OI-Index | Spec-Net | Spec-Index | Com-Net | COM-Index | Smalls-Net | Smalls-Index |
|---|---|---|---|---|---|---|---|---|
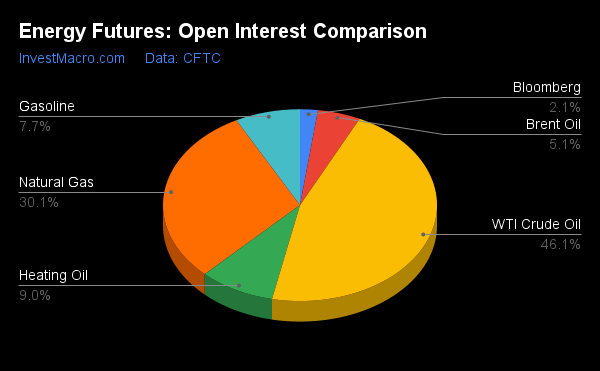
| WTI Crude | 1,498,059 | 3 | 227,057 | 4 | -244,007 | 98 | 16,950 | 28 |
| Gold | 463,674 | 3 | 97,344 | 2 | -110,938 | 99 | 13,594 | 9 |
| Silver | 135,530 | 3 | -4,640 | 9 | -2,551 | 93 | 7,191 | 4 |
| Copper | 157,900 | 0 | -18,986 | 23 | 20,512 | 80 | -1,526 | 16 |
| Palladium | 6,085 | 1 | -1,273 | 16 | 1,455 | 83 | -182 | 33 |
| Platinum | 68,574 | 36 | -1,879 | 7 | -2,051 | 93 | 3,930 | 17 |
| Natural Gas | 977,116 | 4 | -145,715 | 35 | 110,794 | 66 | 34,921 | 63 |
| Brent | 164,415 | 12 | -39,023 | 46 | 34,919 | 51 | 4,104 | 65 |
| Heating Oil | 290,916 | 31 | 16,064 | 66 | -31,353 | 38 | 15,289 | 51 |
| Soybeans | 643,018 | 15 | 92,110 | 42 | -61,424 | 68 | -30,686 | 19 |
| Corn | 1,310,411 | 6 | 294,569 | 68 | -234,179 | 39 | -60,390 | 8 |
| Coffee | 197,657 | 10 | 42,267 | 75 | -44,360 | 29 | 2,093 | 19 |
| Sugar | 751,873 | 9 | 68,330 | 51 | -79,426 | 53 | 11,096 | 22 |
| Wheat | 287,046 | 0 | -8,128 | 8 | 12,977 | 78 | -4,849 | 85 |
Strength Scores
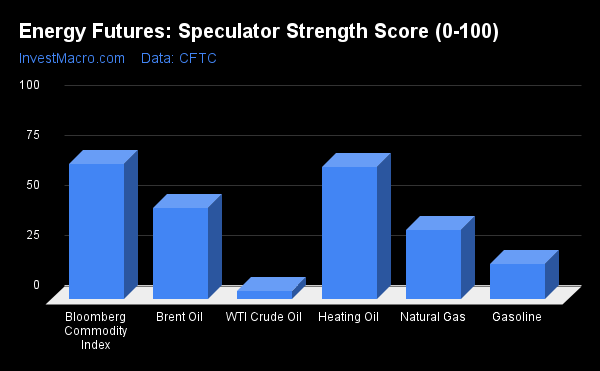
Strength Scores (a normalized measure of Speculator positions over a 3-Year range, from 0 to 100 where above 80 is extreme bullish and below 20 is extreme bearish) showed that the Bloomberg Commodity Index (67.6 percent) and Heating Oil (66.1 percent) lead the energy markets. These two markets are the only ones in energy that are above the 3-year midpoint at the current time (above 50 percent).
On the downside, WTI Crude Oil (4.3 percent) comes in at the lowest strength level followed by Gasoline (17.6 percent) and both are in bearish extreme readings (below 20 percent).
Strength Statistics:
WTI Crude Oil (4.3 percent) vs WTI Crude Oil previous week (1.0 percent)
Brent Crude Oil (45.7 percent) vs Brent Crude Oil previous week (50.1 percent)
Natural Gas (34.8 percent) vs Natural Gas previous week (37.0 percent)
Gasoline (17.6 percent) vs Gasoline previous week (21.2 percent)
Heating Oil (66.1 percent) vs Heating Oil previous week (68.7 percent)
Bloomberg Commodity Index (67.6 percent) vs Bloomberg Commodity Index previous week (67.6 percent)
Strength Trends
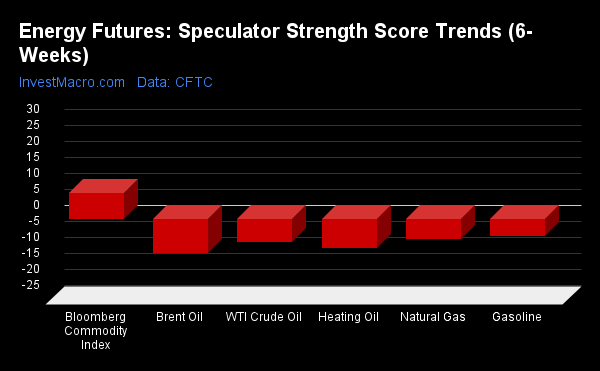
Strength Score Trends (or move index, calculates the 6-week changes in strength scores) show that the Bloomberg Commodity Index (8.4 percent) leads the past six weeks trends for energy this week and is the only positive mover in the latest trends data.
Brent Crude Oil (-10.5 percent) leads the downside trend scores currently and is followed by Heating Oil (-8.8 percent), WTI Crude Oil (-7.0 percent), Natural Gas (-6.2 percent) and Gasoline (-5.2 percent).
Strength Trend Statistics:
WTI Crude Oil (-7.0 percent) vs WTI Crude Oil previous week (-11.8 percent)
Brent Crude Oil (-10.5 percent) vs Brent Crude Oil previous week (8.6 percent)
Natural Gas (-6.2 percent) vs Natural Gas previous week (-6.1 percent)
Gasoline (-5.2 percent) vs Gasoline previous week (3.8 percent)
Heating Oil (-8.8 percent) vs Heating Oil previous week (-1.2 percent)
Bloomberg Commodity Index (8.4 percent) vs Bloomberg Commodity Index previous week (20.1 percent)
Individual Markets:
WTI Crude Oil Futures:
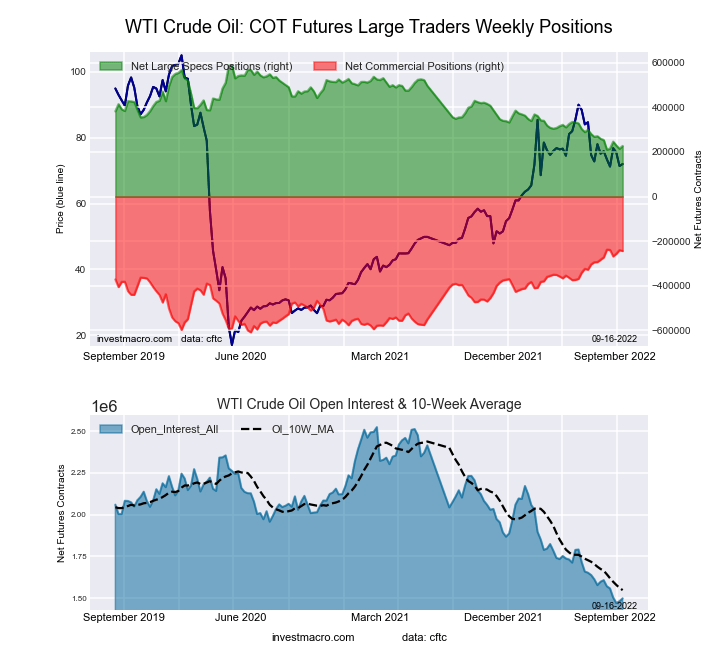 The WTI Crude Oil Futures large speculator standing this week reached a net position of 227,057 contracts in the data reported through Tuesday. This was a weekly gain of 12,579 contracts from the previous week which had a total of 214,478 net contracts.
This week’s current strength score (the trader positioning range over the past three years, measured from 0 to 100) shows the speculators are currently Bearish-Extreme with a score of 4.3 percent. The commercials are Bullish-Extreme with a score of 98.4 percent and the small traders (not shown in chart) are Bearish with a score of 28.3 percent.
| WTI Crude Oil Futures Statistics | SPECULATORS | COMMERCIALS | SMALL TRADERS |
| – Percent of Open Interest Longs: | 22.7 | 40.1 | 5.1 |
| – Percent of Open Interest Shorts: | 7.6 | 56.4 | 3.9 |
| – Net Position: | 227,057 | -244,007 | 16,950 |
| – Gross Longs: | 340,716 | 600,618 | 75,790 |
| – Gross Shorts: | 113,659 | 844,625 | 58,840 |
| – Long to Short Ratio: | 3.0 to 1 | 0.7 to 1 | 1.3 to 1 |
| NET POSITION TREND: | |||
| – Strength Index Score (3 Year Range Pct): | 4.3 | 98.4 | 28.3 |
| – Strength Index Reading (3 Year Range): | Bearish-Extreme | Bullish-Extreme | Bearish |
| NET POSITION MOVEMENT INDEX: | |||
| – 6-Week Change in Strength Index: | -7.0 | 7.8 | -3.6 |
Brent Crude Oil Futures:
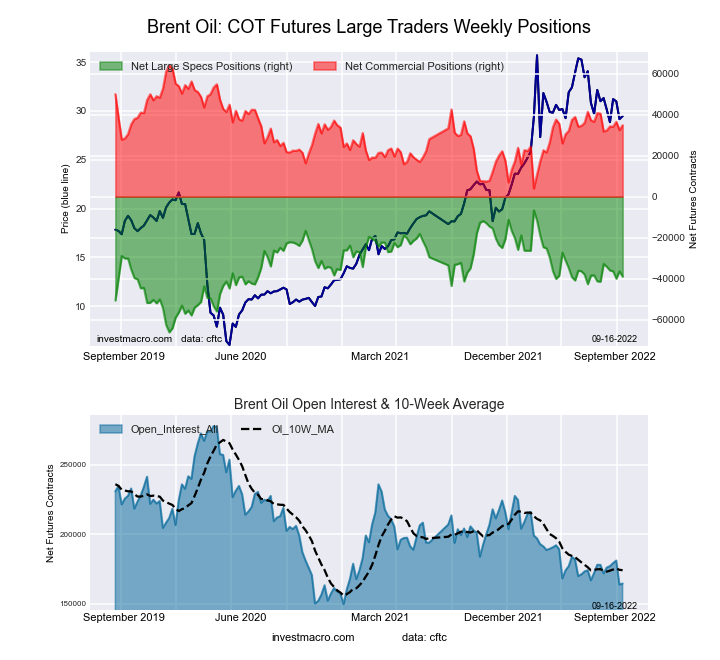 The Brent Crude Oil Futures large speculator standing this week reached a net position of -39,023 contracts in the data reported through Tuesday. This was a weekly fall of -2,635 contracts from the previous week which had a total of -36,388 net contracts.
This week’s current strength score (the trader positioning range over the past three years, measured from 0 to 100) shows the speculators are currently Bearish with a score of 45.7 percent. The commercials are Bullish with a score of 51.3 percent and the small traders (not shown in chart) are Bullish with a score of 64.7 percent.
| Brent Crude Oil Futures Statistics | SPECULATORS | COMMERCIALS | SMALL TRADERS |
| – Percent of Open Interest Longs: | 16.7 | 53.7 | 5.8 |
| – Percent of Open Interest Shorts: | 40.4 | 32.5 | 3.3 |
| – Net Position: | -39,023 | 34,919 | 4,104 |
| – Gross Longs: | 27,455 | 88,321 | 9,542 |
| – Gross Shorts: | 66,478 | 53,402 | 5,438 |
| – Long to Short Ratio: | 0.4 to 1 | 1.7 to 1 | 1.8 to 1 |
| NET POSITION TREND: | |||
| – Strength Index Score (3 Year Range Pct): | 45.7 | 51.3 | 64.7 |
| – Strength Index Reading (3 Year Range): | Bearish | Bullish | Bullish |
| NET POSITION MOVEMENT INDEX: | |||
| – 6-Week Change in Strength Index: | -10.5 | 5.1 | 42.7 |
Natural Gas Futures:
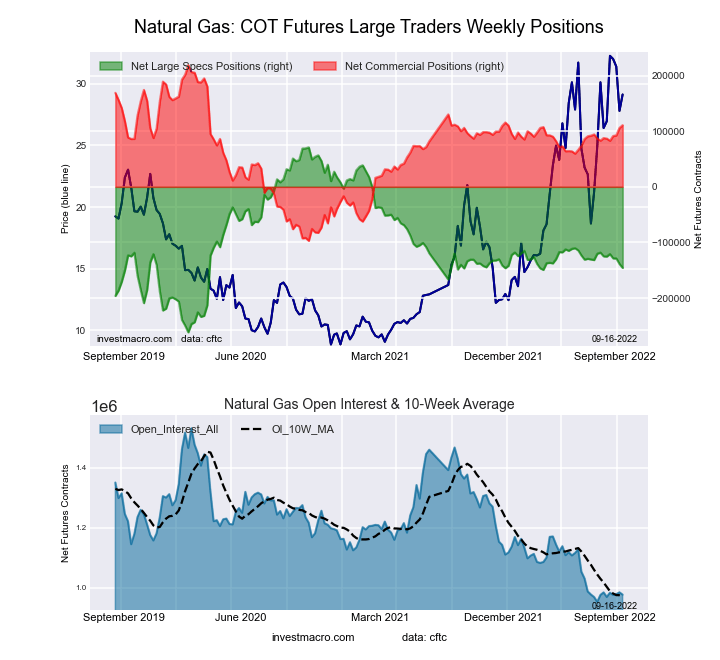 The Natural Gas Futures large speculator standing this week reached a net position of -145,715 contracts in the data reported through Tuesday. This was a weekly lowering of -7,077 contracts from the previous week which had a total of -138,638 net contracts.
This week’s current strength score (the trader positioning range over the past three years, measured from 0 to 100) shows the speculators are currently Bearish with a score of 34.8 percent. The commercials are Bullish with a score of 65.8 percent and the small traders (not shown in chart) are Bullish with a score of 62.8 percent.
| Natural Gas Futures Statistics | SPECULATORS | COMMERCIALS | SMALL TRADERS |
| – Percent of Open Interest Longs: | 16.0 | 42.8 | 6.9 |
| – Percent of Open Interest Shorts: | 30.9 | 31.5 | 3.3 |
| – Net Position: | -145,715 | 110,794 | 34,921 |
| – Gross Longs: | 155,945 | 418,580 | 67,120 |
| – Gross Shorts: | 301,660 | 307,786 | 32,199 |
| – Long to Short Ratio: | 0.5 to 1 | 1.4 to 1 | 2.1 to 1 |
| NET POSITION TREND: | |||
| – Strength Index Score (3 Year Range Pct): | 34.8 | 65.8 | 62.8 |
| – Strength Index Reading (3 Year Range): | Bearish | Bullish | Bullish |
| NET POSITION MOVEMENT INDEX: | |||
| – 6-Week Change in Strength Index: | -6.2 | 7.3 | -5.8 |
Gasoline Blendstock Futures:
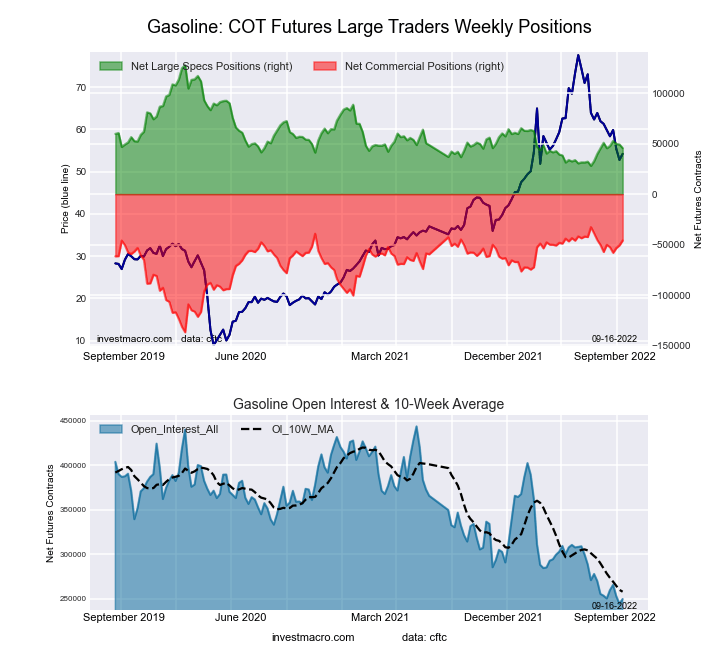 The Gasoline Blendstock Futures large speculator standing this week reached a net position of 45,592 contracts in the data reported through Tuesday. This was a weekly lowering of -3,574 contracts from the previous week which had a total of 49,166 net contracts.
This week’s current strength score (the trader positioning range over the past three years, measured from 0 to 100) shows the speculators are currently Bearish-Extreme with a score of 17.6 percent. The commercials are Bullish-Extreme with a score of 87.3 percent and the small traders (not shown in chart) are Bearish-Extreme with a score of 14.9 percent.
| Nasdaq Mini Futures Statistics | SPECULATORS | COMMERCIALS | SMALL TRADERS |
| – Percent of Open Interest Longs: | 30.5 | 48.6 | 7.2 |
| – Percent of Open Interest Shorts: | 12.2 | 67.0 | 7.1 |
| – Net Position: | 45,592 | -45,909 | 317 |
| – Gross Longs: | 76,103 | 121,491 | 18,029 |
| – Gross Shorts: | 30,511 | 167,400 | 17,712 |
| – Long to Short Ratio: | 2.5 to 1 | 0.7 to 1 | 1.0 to 1 |
| NET POSITION TREND: | |||
| – Strength Index Score (3 Year Range Pct): | 17.6 | 87.3 | 14.9 |
| – Strength Index Reading (3 Year Range): | Bearish-Extreme | Bullish-Extreme | Bearish-Extreme |
| NET POSITION MOVEMENT INDEX: | |||
| – 6-Week Change in Strength Index: | -5.2 | 10.9 | -41.0 |
#2 Heating Oil NY-Harbor Futures:
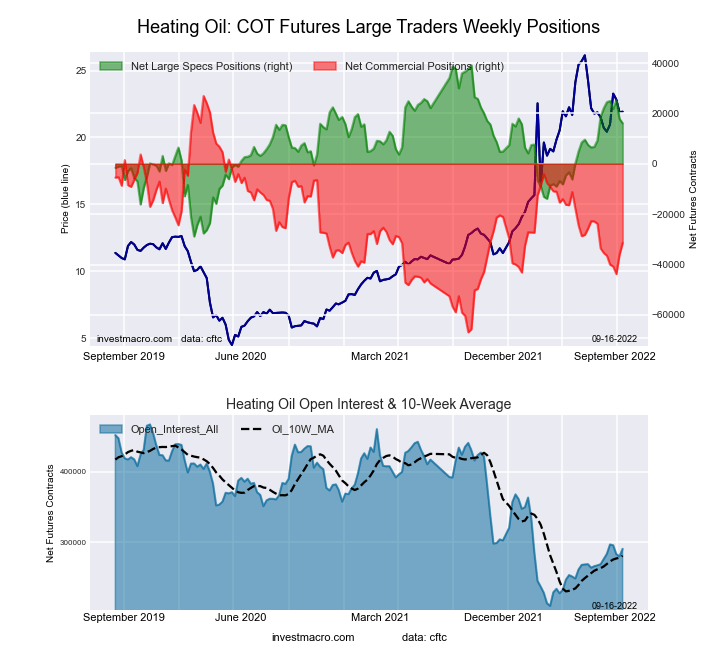 The #2 Heating Oil NY-Harbor Futures large speculator standing this week reached a net position of 16,064 contracts in the data reported through Tuesday. This was a weekly reduction of -1,796 contracts from the previous week which had a total of 17,860 net contracts.
This week’s current strength score (the trader positioning range over the past three years, measured from 0 to 100) shows the speculators are currently Bullish with a score of 66.1 percent. The commercials are Bearish with a score of 37.9 percent and the small traders (not shown in chart) are Bullish with a score of 51.3 percent.
| Heating Oil Futures Statistics | SPECULATORS | COMMERCIALS | SMALL TRADERS |
| – Percent of Open Interest Longs: | 14.1 | 55.0 | 14.2 |
| – Percent of Open Interest Shorts: | 8.6 | 65.8 | 9.0 |
| – Net Position: | 16,064 | -31,353 | 15,289 |
| – Gross Longs: | 41,005 | 160,000 | 41,349 |
| – Gross Shorts: | 24,941 | 191,353 | 26,060 |
| – Long to Short Ratio: | 1.6 to 1 | 0.8 to 1 | 1.6 to 1 |
| NET POSITION TREND: | |||
| – Strength Index Score (3 Year Range Pct): | 66.1 | 37.9 | 51.3 |
| – Strength Index Reading (3 Year Range): | Bullish | Bearish | Bullish |
| NET POSITION MOVEMENT INDEX: | |||
| – 6-Week Change in Strength Index: | -8.8 | 4.3 | 6.8 |
Bloomberg Commodity Index Futures:
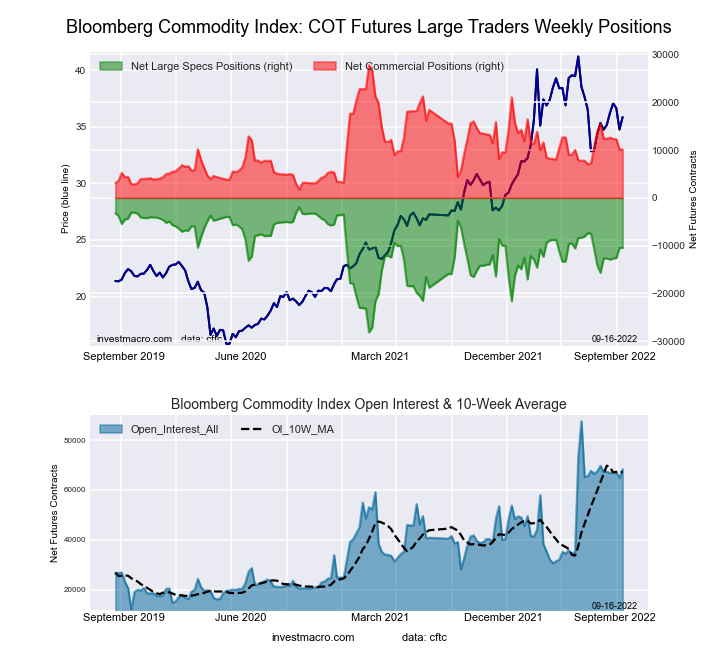 The Bloomberg Commodity Index Futures large speculator standing this week reached a net position of -10,434 contracts in the data reported through Tuesday. This was a weekly decline of -14 contracts from the previous week which had a total of -10,420 net contracts.
This week’s current strength score (the trader positioning range over the past three years, measured from 0 to 100) shows the speculators are currently Bullish with a score of 67.6 percent. The commercials are Bearish with a score of 32.2 percent and the small traders (not shown in chart) are Bearish with a score of 21.8 percent.
| Bloomberg Index Futures Statistics | SPECULATORS | COMMERCIALS | SMALL TRADERS |
| – Percent of Open Interest Longs: | 26.9 | 70.4 | 0.7 |
| – Percent of Open Interest Shorts: | 42.2 | 55.6 | 0.2 |
| – Net Position: | -10,434 | 10,122 | 312 |
| – Gross Longs: | 18,402 | 48,090 | 447 |
| – Gross Shorts: | 28,836 | 37,968 | 135 |
| – Long to Short Ratio: | 0.6 to 1 | 1.3 to 1 | 3.3 to 1 |
| NET POSITION TREND: | |||
| – Strength Index Score (3 Year Range Pct): | 67.6 | 32.2 | 21.8 |
| – Strength Index Reading (3 Year Range): | Bullish | Bearish | Bearish |
| NET POSITION MOVEMENT INDEX: | |||
| – 6-Week Change in Strength Index: | 8.4 | -8.7 | 3.1 |
Article By InvestMacro – Receive our weekly COT Reports by Email
*COT Reports: The COT data, released weekly to the public each Friday, is updated through the most recent Tuesday (data is 3 days old) and shows a quick view of how large speculators or non-commercials (for-profit traders) were positioned in the futures markets.
The CFTC categorizes trader positions according to commercial hedgers (traders who use futures contracts for hedging as part of the business), non-commercials (large traders who speculate to realize trading profits) and nonreportable traders (usually small traders/speculators) as well as their open interest (contracts open in the market at time of reporting). See CFTC criteria here.

- Geopolitical and macroeconomic conditions continue to pressure market sentiment Jul 20, 2026
- USD/JPY Poised to Continue Gains as Expensive Oil and Lack of Support Weigh on Yen Jul 20, 2026
- COT Metals Charts: Weekly Speculator Bets led by Copper & Steel Jul 18, 2026
- COT Bonds Charts: Weekly Speculator Bets led by 2-Year, SOFR 3M & 5-Year Bonds Jul 18, 2026
- COT Energy Charts: Weekly Speculator Bets led by Brent Oil & Heating Oil Jul 18, 2026
- COT Soft Commodities Charts: Weekly Speculator Bets led by Wheat, Corn & Soybean Meal Jul 18, 2026
- The Bank of Canada kept its interest rate unchanged. Platinum prices reached a three‑week high Jul 16, 2026
- Stock indices rose after the release of US inflation data. China’s GDP slowed sharply Jul 15, 2026
- GBP/USD Awaits Political News: What Will Happen Next Jul 15, 2026
- USD/JPY Holds at Highs: Pressure Lingers on Yen Jul 14, 2026