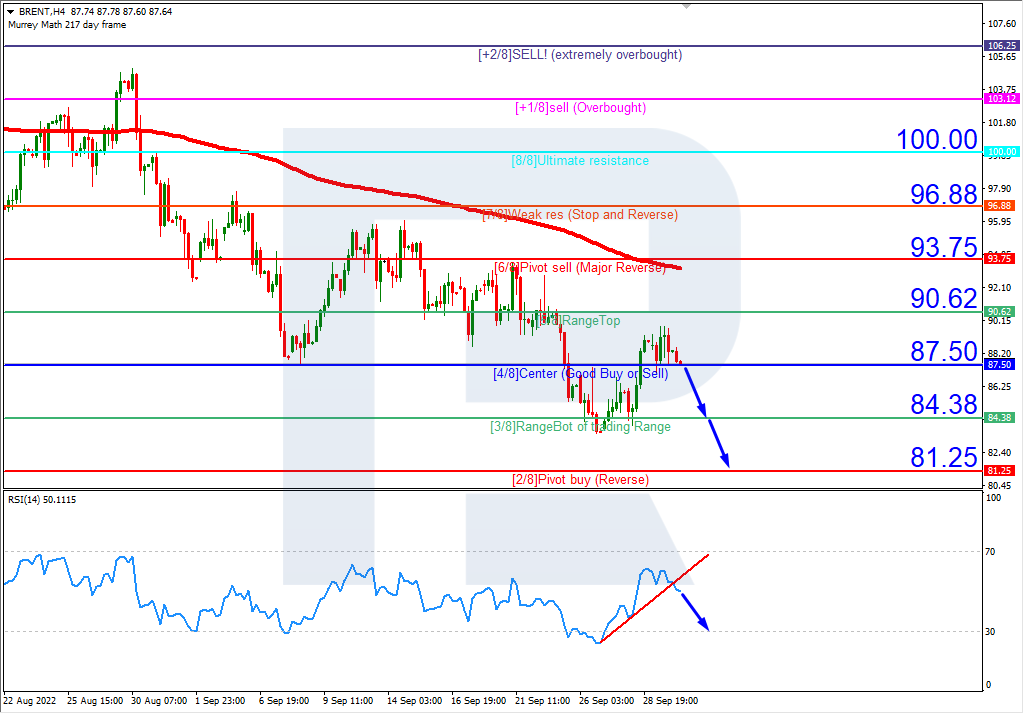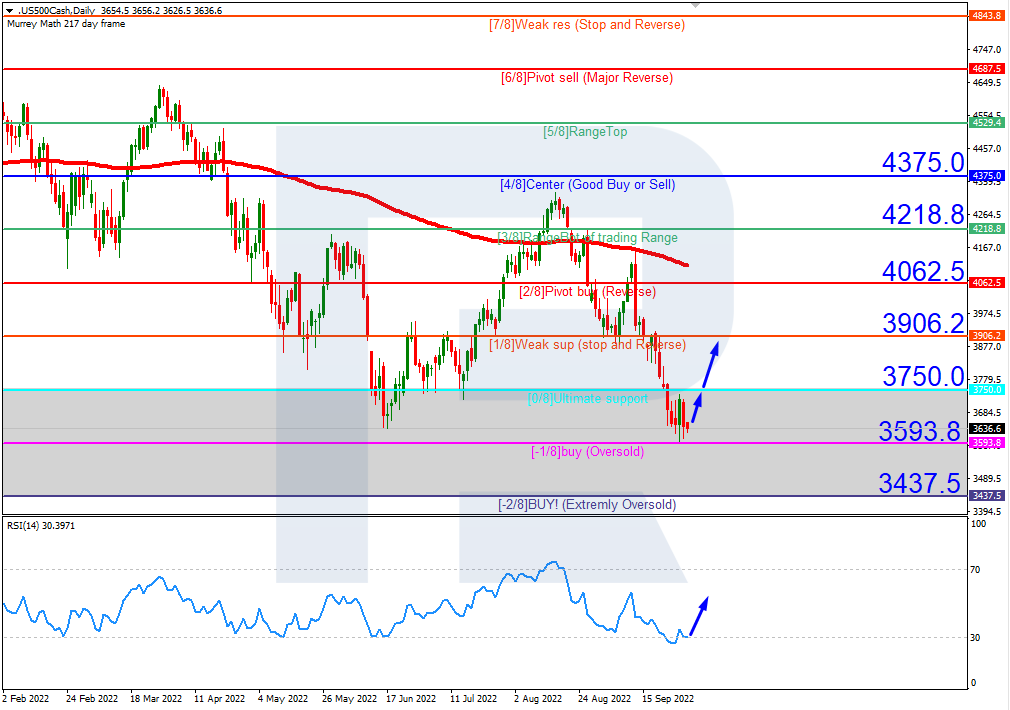
On H4, the quotes are in the overbought area. A breakaway of 8/8 downwards should be expected, followed by a falling to the support level of 6/8. The scenario can be cancelled by rising over the resistance level of +1/8, in which case the growth might continue to +2/8.
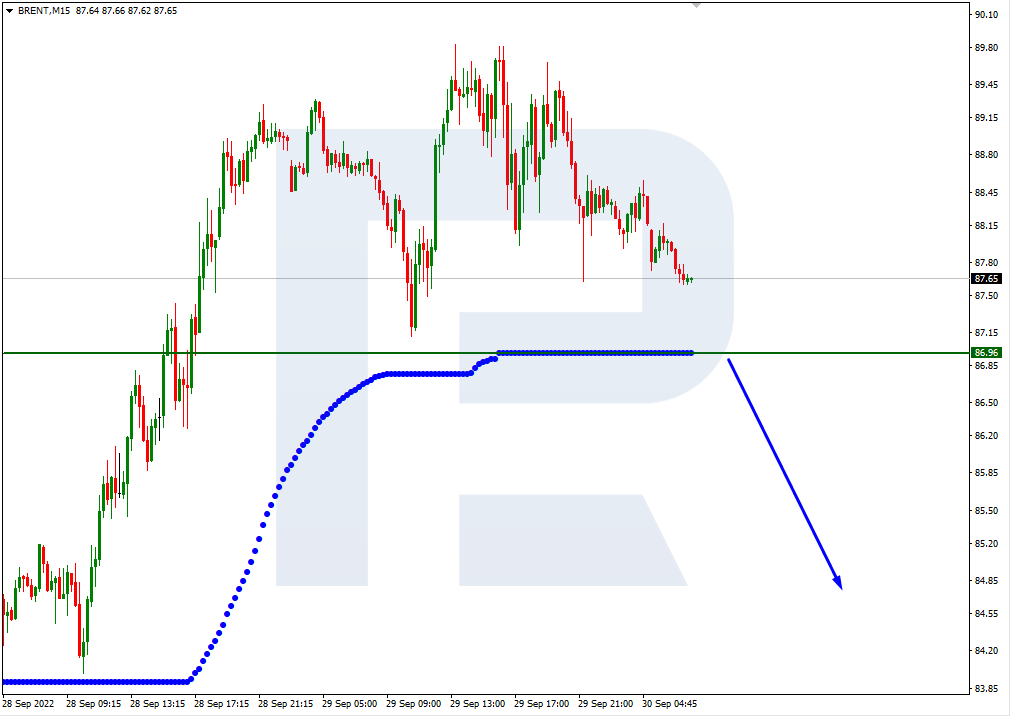
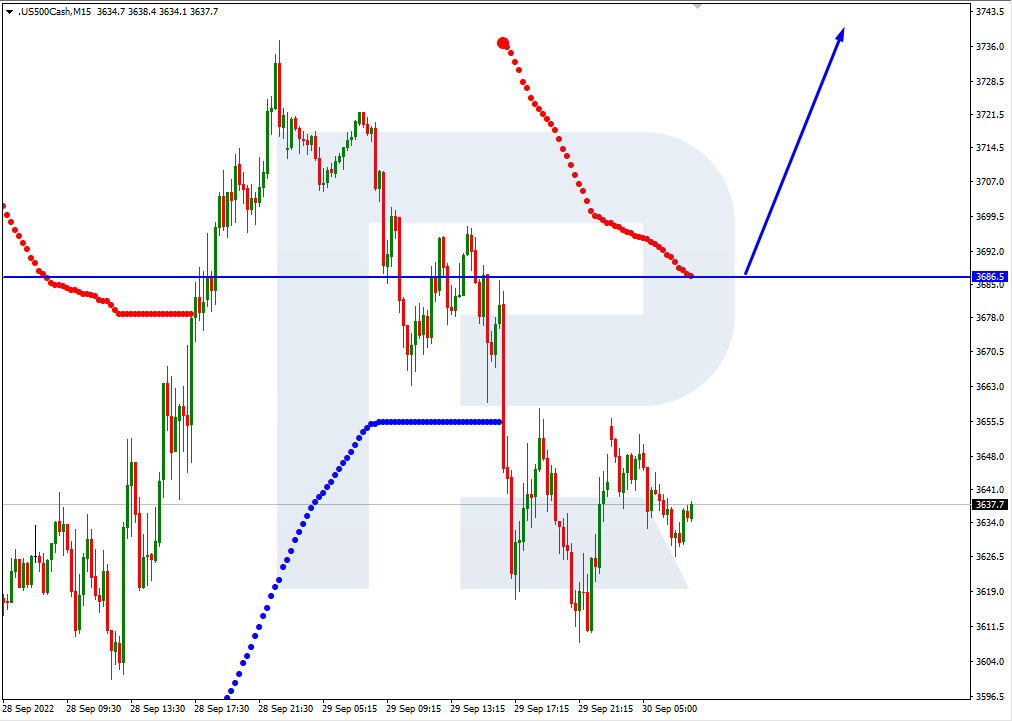
On M15, falling can be additionally confirmed by a breakaway of the lower border of VoltyChannel.
USDCAD, “US Dollar vs Canadian Dollar”
On H4, the quotes are nearing the overbought area. A test of 8/8 is expected, a bounce off it, and falling to the support level of 6/8. The scenario can be cancelled by rising over the resistance level of 8/8. This will catalyse growth to +1/8.
On M15, a breakaway of the lower border of VoltyChannel will increase the probability of falling to 6/8 on H4.
Attention! Forecasts presented in this section only reflect the author’s private opinion and should not be considered as guidance for trading. RoboForex LP bears no responsibility for trading results based on trading recommendations described in these analytical reviews.
The BTC has experienced a new decline. On Wednesday, the leading cryptocurrency is balancing near 20,303 USD though yesterday it rose to 22,780 USD.
Yesterday the USD reversed abruptly after the US inflation statistics came out. The CPI in the US in August turned out to be 8.3% y/y while the forecast level had been 8.1%. Base inflation leaped up to the high of March, 6.3% y/y.
After such statistics were published, market expectations of the interest rate of the US Fed worsened quite a bit. Investors are now 86% sure that the rate will grow by 75 base points in September. There is even a forecast about growth by 100 base points at once, but the probability of such an event is just 14%.
Over the nearest two days, investors will try to play back the losses. If this does not happen, the bears will be heading for 20,000 USD and then – to 18,000 USD. For growth to become possible again, the BTC needs to return above 22,500 USD.
Terra Classic: new uptrend
The Terra Classic token (LUNC) yesterday turned out to be the only crypto out of the Top 30 list that demonstrated growth. While other digital assets were selling, the token grew by 20%, reversing the decline that started on weekend.
North Island Ventures starts new fund
An investment company North Island Ventures that invests in crypto announced a launch of a new fund. It will be sized 125 million USD. The company plans to invest the money in new crypto and Web3 companies and protocols at early stages.
Binance will distribute tokens of Ethereum PoW fork
The Binance crypto exchange plans to distribute among ETH holders the tokens of the Ethereum PoW fork after The Merge update comes in force. The fork tokens will be deposited as 1 to 1. Withdrawal will become available a bit later.
Attention! Forecasts presented in this section only reflect the author’s private opinion and should not be considered as guidance for trading. RoboForex LP bears no responsibility for trading results based on trading recommendations described in these analytical reviews.
Germany’s Consumer Price Index showed 7.9% YoY after 7.5% in July. Inflation has been above 7% for more than six months. The main reason for the high inflation is still an increase in energy and food prices. The annualized inflation rate in Spain has declined from 10.7% to 10.5%. The US Consumer Price Index increased by 0.1% last month, with core inflation up to 0.6%, against expectations of 0.3%. Thus, US inflation showed no signs of slowing, which caused a sharp flow of money into the dollar index, on expectations that the US Federal Reserve will continue to raise interest rates aggressively.
Trading recommendations
Support levels: 0.9971, 0.9912.
Resistance levels: 1.0111, 1.0162, 1.0230
From the technical point of view, the trend on the EUR/USD currency pair on the hourly time frame is bullish. But the price formed a false breakout zone above the level of 1.0111 and returned to the wide range. The MACD indicator became negative, and the sellers’ pressure intensified. Under such market conditions, it is best to look for buy trades on intraday time frames from the support level of 0.9971, but with confirmation. Sell trades can be considered from resistance levels of 1.0111 or 1.0162.
Alternative scenario: if the price breaks down through the support level of 0.9912 and fixes below, the downtrend will likely resume.
News feed for 2022.09.14:
– Eurozone Industrial Production (m/m) at 12:00 (GMT+3);
– US Producer Price Index (m/m) at 15:30 (GMT+3).
The GBP/USD currency pair
Technical indicators of the currency pair:
Prev Open: 1.1676
Prev Close: 1.1491
% chg. over the last day: -1.61 %
UK labor market data showed that average payrolls, including bonuses, rose from 5.2% to 5.5%, jobless claims increased by 6,300, and the unemployment rate fell from 3.8% to 3.6%. Total UK jobs rose by 290,000 for the quarter to a record 35.8 million, exceeding the December 2019 pre-coronavirus level for the first time. Thus, the UK labor market remains strong, opening room for the Bank of England to be more aggressive. The question is whether the Bank of England will act more aggressively under a new prime minister.
From the technical point of view, the trend on the GBP/USD currency pair on the hourly time frame is bullish. At the moment, the price is trading below the moving averages again, and the MACD indicator is in the negative zone. Buy trades can be considered from the support level of 1.1503, but only with confirmation. Sell trades are best to look for on intraday time frames, and the nearest resistance level is 1.1627 and 1.1693.
Alternative scenario: if the price breaks down the support level of 1.1449 and fixes below it, the downtrend will likely resume.
News feed for 2022.09.14:
– UK Consumer Price Index (m/m) at 09:00 (GMT+3).
The USD/JPY currency pair
Technical indicators of the currency pair:
Prev Open: 142.82
Prev Close: 144.52
% chg. over the last day: +1.19 %
The situation on the USD/JPY currency pair remains the same. Japan’s Central Bank keeps interest rates ultra-low and its monetary policy ultra-soft, while the US Federal Reserve is in a cycle of monetary tightening, raising interest rates, and reducing the balance sheet. This divergent policy has already sent the USD/JPY quotes to a 24-year high. Analysts expect the quotes will continue to rise as no changes are expected in the near term.
Trading recommendations
Support levels: 142.86, 141.77, 141.00, 139.61, 138.78, 137.65, 136.80, 135.20
Resistance levels: 145.00
From the technical point of view, the medium-term trend on the currency pair USD/JPY is bullish. The price is trading at the level of moving averages. The MACD indicator has become positive, but the buyers’ pressure remains. Under such market conditions, buy trades can be sought from the support level of 142.86, but with additional confirmation. Sell deals can be considered on the intraday time frames from the level of 145.00, but only with additional confirmation, as fundamentally, USD/JPY quotes are inclined to growth.
Alternative scenario: If the price fixes below 141.00, the downtrend will likely resume.
News feed for 2022.09.14:
– Japan Industrial Production (m/m) at 07:30 (GMT+3).
The USD/CAD currency pair
Technical indicators of the currency pair:
Prev Open: 1.2976
Prev Close: 1.3173
% chg. over the last day: +1.52 %
Macroeconomic forecasts continue to reflect a relatively higher growth rate in Canada compared to the US this year and next year. Analysts expect the Bank of Canada rate to peak at 3.75% this year, slightly higher than the (revised) forecast of 3.5%. The USD/CAD exchange rate is forecast at 1.30 at the end of the year and 1.25 at the end of next year.
Trading recommendations
Support levels: 1.3053, 1.2990, 1.2958, 1.2936, 1.2900
Resistance levels: 1.3169, 1.3220
From the point of view of technical analysis, the trend on the USD/CAD currency pair is bullish. The price is trading above the moving averages, the MACD indicator is in the positive zone, and signs of bullish pressure remain. Under such market conditions, buy trades should be considered on the lower time frames from the support level of 1.3053 after the pullback, as the price has strongly deviated from the averages. For sell deals, it is best to consider the resistance level of 1.3169 or 1.3220, but only after the additional confirmation.
Alternative scenario: if the price breaks down and consolidates below the 1.2990 support level, the downtrend will likely resume.
This article reflects a personal opinion and should not be interpreted as an investment advice, and/or offer, and/or a persistent request for carrying out financial transactions, and/or a guarantee, and/or a forecast of future events.
Inflationary pressures in the United States failed to decline significantly last month, despite falling gas prices. This is a sign that the Federal Reserve still has much work to do to restore price stability and provide long-term relief to US households. According to the US Bureau of Labor Statistics, the Consumer Price Index increased by 0.1% on a seasonally adjusted basis after stabilizing in July, exceeding consensus forecasts. On an annualized basis, the consumer price index fell to 8.3% from 8.5%. Economists polled by Bloomberg had expected inflation to fall to 8.1%. Core inflation (excluding food and energy prices) rose by 0.6% last month. On an annualized basis, core inflation rose from 5.9% to 6.3%.
Treasury bond yields jumped sharply after the CPI data, with the two-year rate soaring 21 basis points to about 3.78%, the highest level since October 2007. The yield on the benchmark 10-year bond increased by 10 basis points to 3.46%, while the dollar strengthened against major currencies and US stocks fell. S&P 500 stocks fell the hardest as high-priced stocks suffered from a sharp rise in US Treasury yields.
As the stock market closed yesterday, the Dow Jones Index (US30) decreased by 3.94%, and the S&P 500 Index (US500) lost 4.32%. The NASDAQ Technology Index (US100) decreased by 3.53% on Tuesday.
According to analysts, the Fed is going to raise rates another 75 basis points next week, and the question is, will the Fed eventually raise rates to 4.5% or higher? This is keeping the whole market in suspense since rates are still low with this inflation.
Despite the widespread market expectation of a further 75 basis point hike, Prince – a global economist and advocate of economic reform – said the Fed would likely deviate from its hawkish trajectory in three steps as the gap between wealthy investors and institutions and the “real economy” widens. By first reducing the rate hikes to 50 basis points and then neutralizing policy, Prins expects the Fed to begin to reverse course as the US has posted two consecutive quarters of negative GDP growth.
Equity markets in Europe also fell yesterday. German DAX (DE30) fell by 1.59%, French CAC 40 (FR40) decreased by 1.39%, Spanish IBEX 35 (ES35) lost 1.59%, British FTSE 100 (UK100) closed down by 1.17%.
The Dutch Cabinet plans aid for energy bills. One million households in the Netherlands are facing financial problems due to rising energy prices. About 600,000 of these households have never experienced financial difficulties before. Now, these households have had to deal with debt counseling to get rid of these debts, which will cost the government dearly.
Germany’s Consumer Price Index was 7.9% annually, after 7.5% in July. The inflation rate has been above 7% for over six months. The main reason for the high inflation is still an increase in energy and food prices. The German economy minister Habek said yesterday that Germany would have to go into recession next year. Spain’s annual inflation rate has fallen from 10.7% to 10.5%.
The European Union wants to cap revenues from cheaper power producers; impose an excess profits tax on fossil fuel companies, and impose mandatory consumption cuts. Commission President Ursula von der Leyen’s plans have yet to be finalized and eventually approved by other states, and there are deep divisions over how to deal with the crisis. Already, the most controversial idea – limiting the price of imported Russian gas – has been postponed until further negotiations.
Oil prices fell nearly 1% on Tuesday, reversing earlier gains. US Consumer Prices unexpectedly rose in August, giving the US Federal Reserve another chance to raise interest rates sharply next week.
Asian markets were trading higher yesterday. Japan’s Nikkei 225 (JP225) gained 0.25%, Hong Kong’s Hang Seng (HK50) ended the day down by 0.18%, and Australia’s S&P/ASX 200 (AU200) ended Tuesday up to 0.65%.
S&P 500 (F) (US500) 3,932.69 −177.72 (−4.32%)
Dow Jones (US30) 31,104.97 −1,276.37 (−3.94%)
DAX (DE40) 13,188.95 −213.32 (−1.59%)
FTSE 100 (UK100) 7,385.86 −87.17 (−1.17%)
USD Index 109.89 +1.57 (+1.45%)
Important events for today:
– Japan Industrial Production (m/m) at 07:30 (GMT+3);
– UK Consumer Price Index (m/m) at 09:00 (GMT+3);
– Eurozone Industrial Production (m/m) at 12:00 (GMT+3);
This article reflects a personal opinion and should not be interpreted as an investment advice, and/or offer, and/or a persistent request for carrying out financial transactions, and/or a guarantee, and/or a forecast of future events.
To refresh your memory, I kept the main paths untouched and added new crucial highlights.
The idea of the upcoming breakout of the Falling Wedge pattern (blue converging trendlines) was posted right on time on the Blog as it played out instantly. Indeed, the Bullish Divergence of the RSI indicator with the price chart played out as planned supporting the breakup of the pattern’s resistance.
The majority of readers got it right choosing the red path as a primary scenario. The price action has been amazingly accurate in the 61.8% Fibonacci retracement area where the price failed to overcome the barrier and reversed to the downside from the minor top of $4,325 following the red zigzag.
I added the 52-week simple moving average (purple) to show you how strong the double resistance was at the $4,347-$4,349 level.
The next support is located in the valley in June at $3,637.
After the minor top has been established, we can make a calculated projection of the downside target. It is located at $3,143, where the current leg down would travel the same distance as the previous leg down.
This time, I also added the time target (orange) based on the earlier move, which took 23 bars to unfold. It falls on the end of January 2023. The Fed might take a break lifting the interest rate then. More often than not the time it takes second leg to emerge doesn’t match with the initial move. However, it is still good to have this benchmark.
The $4,325 mark has turned to be a resistance now as the index could still build a more complex structure to the upside reviving the green path.
Now let me reveal the reason behind the title of this post in the next chart.
Source: TradingView
This is this comparison chart of the gold/silver ratio (red) and the S&P 500 index (blue). The idea is simple; the red line shows the risk-off mode when it moves up as safe-haven gold becomes more valuable than the industrial silver. The risk-on mode is active in the opposite direction and the S&P 500 index starts to grow.
There is a long period of unconventional monetary policy that interrupted the link when both gold/silver ratio and the index has been growing. However, we could still distinct several local areas where this opposite correlation works very well in spite of the large uptrend. Since 2020, this link is back to normal with visible crossovers and opposite extremes.
The S&P 500 index is clearly on the edge now as it has been very close to crossing the red line down lately.
We can see that the gold/silver ratio has a lot of room for further growth to retest the all-time high of 113 oz. It could be a 24% rise of the ratio.
The risk-off mode would reach its climax then putting a huge pressure on the stock market. The relevant drop of 24% in the S&P 500 could hit the $3,090 mark, which coincides with the downside target calculated in the first chart of the index above.
Disclosure: This contributor has no positions in any stocks mentioned in this article. This article is the opinion of the contributor themselves. The above is a matter of opinion provided for general information purposes only and is not intended as investment advice. This contributor is not receiving compensation (other than from INO.com) for their opinion.
The pair is testing the upper border of the Cloud. The quotes are above the Cloud, which indicates an uptrend. A test of the lower border of the Cloud at 1.1510 is expected, followed by growth to 1.2025. One more signal confirming the growth will be a bounce off the upper border of the bearish channel. The scenario can be cancelled by a breakaway of the lower border of the Cloud and securing under 1.1445, which will mean further falling to 1.1355.
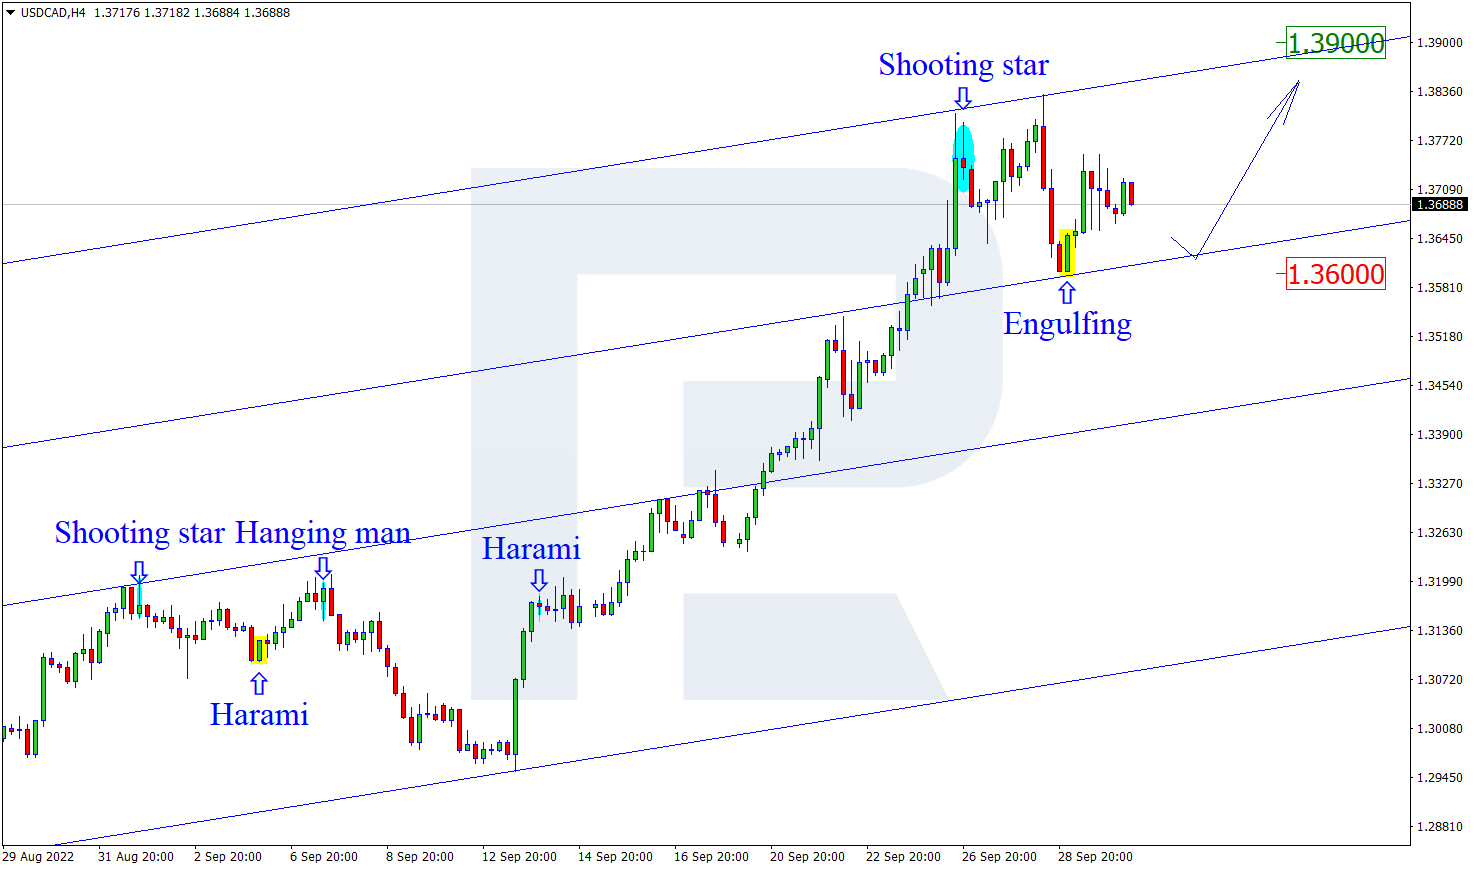
USDCAD, “US Dollar vs Canadian Dollar”
The pair is pushing off the Tenkan-Sen line, going under the Ichimoku Cloud, which means the prevalence of a downtrend. A test of the lower border of the Cloud is expected at 1.3040, followed by falling to 1.2765. An additional signal confirming the decline will be a bounce off the upper border of the descending channel. The scenario can be cancelled by a breakaway of the upper border of the Cloud and securing above 1.3175, which will entail further growth to 1.3265.
NZDUSD, “New Zealand Dollar vs US Dollar”
The pair is getting ready to break through the Cloud. The pair is going inside the Cloud, indicating a flat. A test of the lower border of the Cloud is expected at 0.6075, followed by growth to 0.6295. Growth of the pair will be signaled by a bounce off the upper border of the descending channel. The scenario can be cancelled by a breakaway of the lower border of the Cloud and securing under 0.6020, which will entail further falling to 0.5925.
Attention! Forecasts presented in this section only reflect the author’s private opinion and should not be considered as guidance for trading. RoboForex LP bears no responsibility for trading results based on trading recommendations described in these analytical reviews.
At a pullback, near the support area, gold has formed a Harami reversal pattern. The pair is going by the pattern by an ascending impulse. The goal of growth might be 1740.00. However, the quotes might fall to 1710.50 before growing.
NZDUSD, “New Zealand Dollar vs US Dollar”
On H4 near the resistance area the pair has formed a Harami reversal pattern. Currently, going by the signal, the pair might end up in a descending impulse. The goal of the decline might be 0.5965. After a breakaway of the support level, the pair might continue the downtrend. However, the price might still grow to 0.6205 before declining.
GBPUSD, “Great Britain Pound vs US Dollar”
On H4, at the support level, the pair has formed a reversal Engulfing pattern. The pair is now going by the pattern in an ascending impulse. The goal of growth might be the resistance level at 1.1845, and if the price manages to break through it, the pair will have a chance for an uptrend. However, the price might fall to 1.1650 before growing to the resistance level.
Attention! Forecasts presented in this section only reflect the author’s private opinion and should not be considered as guidance for trading. RoboForex LP bears no responsibility for trading results based on trading recommendations described in these analytical reviews.
The European Central Bank started working on its quantitative easing (QT) program. Policymakers will potentially announce it formally at the ECB’s October meeting. There are a lot of speeches planned by ECB officials this week, so traders need to watch for new hints regarding the next steps in interest rate hikes. Special attention should be paid to the EU energy meeting. The euro rose to a three-week high against the dollar as European Central Bank officials are in favor of further aggressive tightening of monetary policy.
Trading recommendations
Support levels: 1.0111, 1.0016, 0.9971, 0.9912
Resistance levels: 1.0230
From the technical point of view, the trend on the EUR/USD currency pair on the hourly time frame has changed to bullish. The price has consolidated above the priority change level and is trading above the moving averages. The MACD indicator has become positive, but the buying pressure remains. Under such market conditions, buy trades are best sought on intraday time frames from the support level of 1.0111. Sell trades can be considered from the resistance levels of 1.0230, but only after an additional confirmation in the form of a false breakout of the level and reverse initiative.
Alternative scenario: if the price breaks down through the support level of 0.9912 and fixes below, the downtrend will likely resume.
News feed for 2022.09.013:
– Eurozone German Consumer Price Index (m/m) at 09:00 (GMT+3);
– Eurozone Spanish Consumer Price Index (m/m) at 10:00 (GMT+3);
– Eurozone German ZEW Economic Sentiment (m/m) at 12:00 (GMT+3);
– Eurozone ZEW Economic Sentiment (m/m) at 12:00 (GMT+3);
– US Consumer Price Index (m/m) at 15:30 (GMT+3).
The GBP/USD currency pair
Technical indicators of the currency pair:
Prev Open: 1.1640
Prev Close: 1.1679
% chg. over the last day: +0.33 %
UK GDP rose by 0.2% last month. At the same time, industrial production decreased by 0.3%. GDP growth is small, but it’s positive. But on the other hand, falling economic indicators are still negatively affecting the British currency. The new British government has confirmed the independence of the Bank of England but hinted that the Bank of England should not be so aggressive in tightening as it will only worsen the already large number of problems in the economy.
From the technical point of view, the GBP/USD currency pair trend on the hour timeframe has changed to bullish. At the moment, the price is trading above the moving averages, and the MACD indicator is in the positive zone. Buy trades can be considered from the support level of 1.1623, but only with confirmation. It is best to look for sell deals on intraday time frames, and the nearest resistance level is 1.1816.
Alternative scenario: if the price breaks down the support level of 1.1449 and fixes below it, the downtrend will likely resume.
News feed for 2022.09.013:
– UK GDP (q/q) at 09:00 (GMT+3);
– UK Average Earnings Index (m/m) at 09:00 (GMT+3);
– UK Claimant Count Change (m/m) at 09:00 (GMT+3);
– UK Unemployment Rate (m/m) at 09:00 (GMT+3).
The USD/JPY currency pair
Technical indicators of the currency pair:
Prev Open: 142.11
Prev Close: 142.82
% chg. over the last day: +0.49 %
The Japanese Finance Ministry has repeatedly and strongly expressed its dissatisfaction with the yen depreciation this year, but the Central Bank is independent and is legally obliged to monitor inflation and the economy, not the exchange rate. So the Bank of Japan will not raise interest rates or adjust its stimulus policy to support the yen. Japan’s economic weakness gives the Bank of Japan little reason to cancel monetary stimulus. The central bank intends to maintain ultra-low interest rates and a dovish policy at its meeting on September 21 and 22. When the Ministry of Finance expresses its dissatisfaction with the yen’s fall, it is said to hint that it may intervene in the market to support the currency. This is done to make traders cautious when selling the yen, a kind of verbal intervention.
Trading recommendations
Support levels: 141.77, 141.00, 139.61, 138.78, 137.65, 136.80, 135.20
Resistance levels: 144.05, 145.00
From the technical point of view, the medium-term trend on the currency pair USD/JPY is bullish. The price is trading at the level of moving averages, and a narrow balance is being formed. The MACD indicator has become inactive. Under such market conditions, buy trades can be sought from the support level of 141.77 or 141.00, but with additional confirmation. Sell positions can be searched for on the intraday time frames from the level of 144.05, but only with an additional confirmation because, fundamentally, USD/JPY quotes are inclined to grow.
Alternative scenario: If the price fixes below 141.00, the downtrend will likely resume.
There is no news feed for today.
The USD/CAD currency pair
Technical indicators of the currency pair:
Prev Open: 1.3029
Prev Close: 1.2983
% chg. over the last day: -0.35 %
The Canadian dollar continues to strengthen as the dollar index is down ahead of important US inflation data, while oil prices are rising on the back of the Iran nuclear deal being stalled again. All of these factors support the Canadian currency, which is a commodity currency. However, with new blockages in China due to falling demand, oil prices might drop in the coming days, which might negatively affect the Canadian currency.
Trading recommendations
Support levels: 1.2990, 1.2958, 1.2936, 1.2900
Resistance levels: 1.3108, 1.3220
From the point of view of technical analysis, the trend on the USD/CAD currency pair is bullish. The price is now trading below the moving averages, the MACD indicator has become negative and the price has consolidated below the priority change level. But it should be noted that at the moment, it looks like the formation of a false breakdown, as the price is consolidating below the level. Under such market conditions, buy trades should be considered on the lower time frames from the support level of 1.2990 if the price returns above the level. For sell deals, it is best to consider the resistance level of 1.3108, but only after the additional confirmation.
Alternative scenario: if the price breaks down and consolidates below the 1.2990 support level, the downtrend will likely resume.
This article reflects a personal opinion and should not be interpreted as an investment advice, and/or offer, and/or a persistent request for carrying out financial transactions, and/or a guarantee, and/or a forecast of future events.
The US stock indices rose ahead of key inflation data, which is expected to show a further cooling in consumer prices. At the close of the stock market yesterday, the Dow Jones Index (US30) increased by 0.72%, and the S&P 500 Index (US500) added 1.07%. Technology Index NASDAQ (US100) gained 1.34% on Monday.
The US will publish an important inflation report today. Analysts forecast that the consumer price index will show a decline for the second month in a row. The expectation of lower inflation has already put pressure on the US dollar in recent days.
According to the Federal Reserve Bank of New York’s monthly survey of consumer expectations released Monday, expectations for US inflation for the three years ahead fell to 2.8% in August from 3.2% the previous month and 3.6% in June. The one-year-ahead inflation forecast fell to 5.7% from 6.2%. Consumers now expect 2% inflation versus 2.3% on the five-year horizon. The US inflation expectations for gas price increases have also declined, and households now expect them to be flat one year from now. The US central banks, aiming for 2% inflation, are rapidly raising interest rates to curb the highest inflation in nearly 40 years. They are expected to hold their third consecutive 75 basis point hike when they meet next week.
Equity markets in Europe mostly rose yesterday. Germany’s DAX (DE30) gained 2.40%, France’s CAC 40 (FR40) gained 1.95%, Spain’s IBEX 35 Index (ES35) jumped by 2.01%, and Britain’s FTSE 100 (UK100) closed up 1.66%.
According to ECB Vice President Luis de Guindos, the European Central Bank’s massive interest rate hike last week was designed to keep inflation expectations anchored. The ECB followed the Federal Reserve in choosing a massive move, with some officials signaling that they are open to a repeat of this step when they next meet in October. ECB policymakers see growing risks that the central bank will have to raise its key interest rate to 2% or more to curb record Eurozone inflation.
In the oil market, the Iran nuclear deal has again stalled, pushing oil prices higher. Also, it should be noted that OPEC+ countries decided to cut oil production starting in October in order to keep oil prices from falling significantly. And all this is because from October, the “low season” begins for oil when oil prices tend to go down. Analysts at ANZ believe that the outlook for oil still looks challenging as Chinese authorities are likely to tighten restrictions ahead of the Communist Party meeting in October.
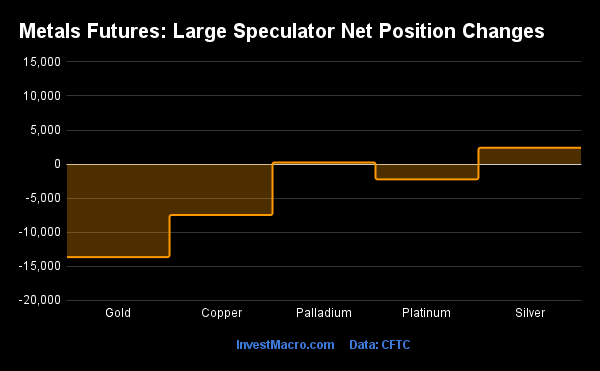
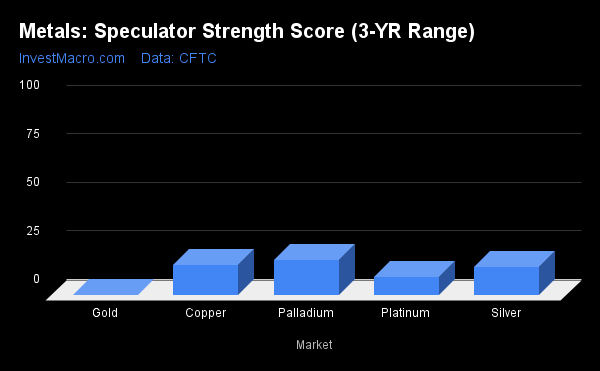
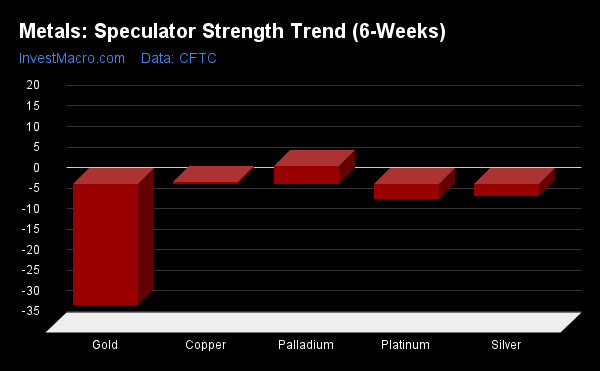
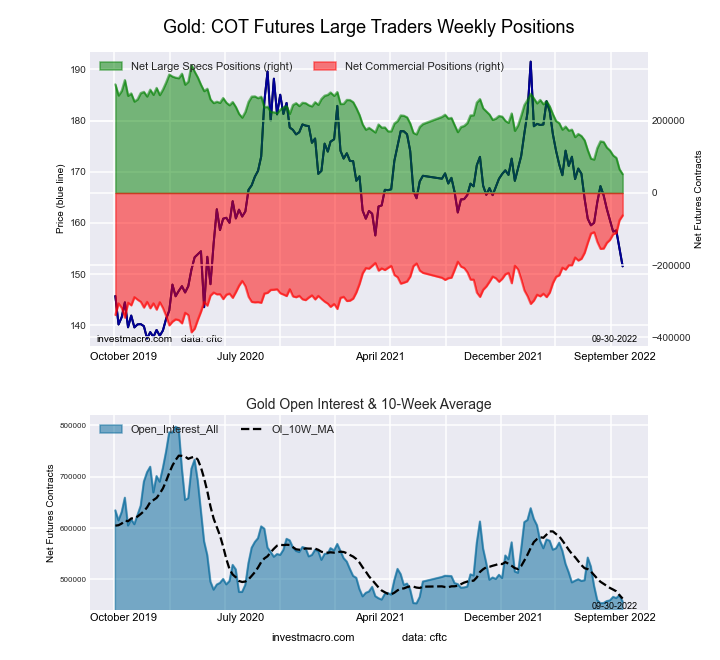
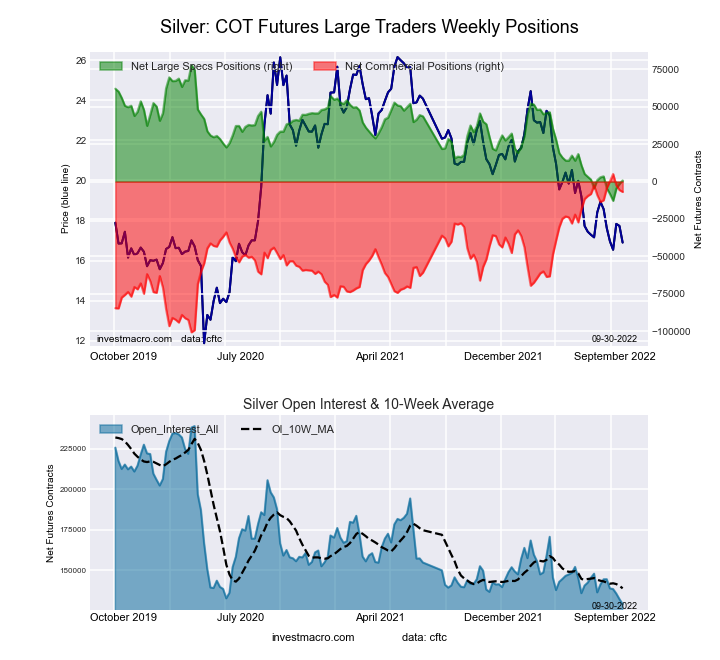
Gold and silver prices continue to rise as the dollar index, and government bond yields fall. But it should be noted that the current growth is temporary because, at the moment, there are no fundamental factors for gold and silver price growth, as the US Federal Reserve is in the cycle of tightening monetary policy.
Asian markets traded higher last week. Japan’s Nikkei 225 (JP225) gained 1.16% yesterday, Hong Kong’s Hang Seng (HK50) gained 2.69% for the day, and Australia’s S&P/ASX 200 (AU200) was up 1.02% on Monday.
Wholesale inflation in Japan reached 9% in August. Wholesale prices increased by 0.2% in August compared to the previous month.
In Australia, business confidence rose to 10 index points. The report indicates employment growth and improved trading conditions in most sectors. Only the construction sector remains problematic.
S&P 500 (F) (US500) 4,110.69 +43.33 (+1.07%)
Dow Jones (US30) 32,383.18 +231.47 (+0.72%)
DAX (DE40) 13,402.27 +314.06 (+2.40%)
FTSE 100 (UK100) 7,473.03 +121.96 (+1.66%)
USD Index 108.34 −0.67 (−0.61%)
Important events for today:
– Australia NAB Business Confidence (m/m) at 04:30 (GMT+3);
– UK Average Earnings Index (m/m) at 09:00 (GMT+3);
– UK Claimant Count Change (m/m) at 09:00 (GMT+3);
– UK Unemployment Rate (m/m) at 09:00 (GMT+3);
– Eurozone German Consumer Price Index (m/m) at 09:00 (GMT+3);
– Eurozone Spanish Consumer Price Index (m/m) at 10:00 (GMT+3);
– Eurozone German ZEW Economic Sentiment (m/m) at 12:00 (GMT+3);
– Eurozone ZEW Economic Sentiment (m/m) at 12:00 (GMT+3);
This article reflects a personal opinion and should not be interpreted as an investment advice, and/or offer, and/or a persistent request for carrying out financial transactions, and/or a guarantee, and/or a forecast of future events.
Cryptocurrencies might still be a very long way from their highs of 2021, but some of the major ones have staged some decent recoveries in the past couple of months. Notably ether (ETH), the second largest cryptocurrency after bitcoin, is trading at almost US$1,700 (£1,463) at the time of writing, having dropped as low as US$876 in mid-June.
Ether, which was created by Canadian/Russian programmer Vitalik Buterin, is the cryptocurrency used for transactions on Ethereum, the leading platform on which developers can applications using blockchain technology.
Blockchains are online ledgers that run without been controlled by any single company. Much of these applications revolve around smart contracts, which are automated contracts that remove the need for intermediaries such as lawyers and are seen as having huge potential for the future.
One of the main catalysts for ether’s rebound has been the Ethereum merge, a huge project to change the way the underlying blockchain operates. Where transactions on Ethereum are currently validated using an energy-intensive system known as proof-of-work (PoW), in which lots of very powerful computers compete to solve complex mathematical puzzles, from around September 15 it will shift to a new system known as proof of stake (PoS).
PoS basically means that transactions on the blockchain will be validated not by all these computations but by a network of investors whose commitment is demonstrated by the fact that they own at least 32 ether (yours for about US$54,000).
The idea is that this gives them an economic incentive to enhance the security of the network, and are therefore very unlikely to try and sabotage it. Whereas bitcoin transactions all depend on PoW, lots of newer cryptocurrencies use PoS, including Ethereum rivals such as Solana and Cardano.
Going green
When the Ethereum merge takes place, power consumption on the blockchain will be reduced by 99%. Since it is currently the most used blockchain in terms of transactions, this will save a huge amount of electricity each year, corresponding to Chile’s power consumption.
As a result of the merge, some analysts expect ether to overtake bitcoin as the leading crypto in terms of the total value of all the coins (in crypto circles this is referred to as the “flippening”). Ether is currently worth just over US$204 billion, while bitcoin is worth US$396 billion.
Until now, cryptocurrencies and bitcoin in particular have suffered from a bad reputation. Bitcoin was initially conceived with the egalitarian goal of allowing investors access to a financial system with no need for banks and with money that isn’t controlled by countries. It has been championed for its ability to enable billions of people without bank accounts to transact online, and to facilitate things like microfinance and ultra-cheap cross-border trading.
Yet bitcoin has come to be associated with environmental degradation and criminal activities. The mainstream media has endlessly linked the leading cryptocurrency – and by extension the whole space – with money laundering, online drug dealing, Ponzi schemes and exchange hacking.
One major consequence has been that major financial institutions like investment banks and pension funds have been cautious of ploughing money into this space, despite the leap forward in technology that blockchains represent.
But if the most widely adopted crypto platform successfully shifts to PoW in the coming days, many believe that this will overcome the biggest institutional objection and see much more money flowing into the space (there are already early signs, such as Fidelity’s new crypto fund for retail investors). This is likely to accelerate the global regulatory framework that would minimise undesirable activities.
By closing down the environmental objections to crypto, other advantages to ether are likely to come to the fore. The merge will offer a return to investors in the form of rewards in exchange for locking up their money for a period of time (“staking”).
Although you need to stake 32 ether to become one of the network’s validators, numerous companies have set up systems to enable smaller investors to pool their money so that they can participate. For example, Binance, the world’s largest crypto exchange, offers investors 6% annual percentage yield for pooled staking on ether.
Staking will therefore create a win-win situation with guaranteed returns and a very liquid system that makes it easy for people to move their money in and out of ether. This will further enhance the appeal of ether and PoS cryptos in general.
This could help to accentuate other positives around crypto, another of which is humanitarian donations. When Russia invaded Ukraine, for instance, the Ukrainian government called for donations in bitcoin and ether to support its efforts against invaders. This quickly attracted substantial amounts of money.
Tonga was similarly successful with a campaign after its volcanic eruption earlier this year. By being able to cross borders easily and cheaply, cryptocurrencies are the ideal vehicle for international donations.
Lingering uncertainties
All that said, it is uncertain how the Ethereum blockchain will function after the merge in terms of transaction speeds and costs. One major problem with Ethereum in the past has been that transactions have been ludicrously expensive, sometimes running to thousands of US dollars at peak times in 2021.
The developers of the Ethereum Foundation do not expect the merge to make a big difference in these respects (currently “gas” fees are averaging between US$1 and US$4 per transaction depending on which platform you are using). Much more important is likely to be another shift in ethereum’s journey to “Ethereum 2.0” known as sharding, which is due to happen in 2023.
We will also have to wait and see how smooth the merge is. Synchronisation and update bugs could see problems such as validators disconnected from the blockchain. Negative stories like these could see investors staying away for fear of instability.
But on the whole, while the merge will not be a miraculous event, it could help improve the image of cryptocurrencies and attract institutional and retail investors. At a time when sustainable investing is increasingly high priority, the ether merge and its attractive returns have the potential to put ether at the top of the list.