Source: Streetwise Reports (3/28/23)
The start of Q2 is fast approaching and one thing has not change for asset manager Chen Lin: he’s still bullish on silver and precious metals.
The start of Q2 is fast approaching, and one thing has not changed for asset manager Chen Lin: he’s still bullish on silver and precious metals.
The author of the What is Chen Buying? What is Chen Selling? newsletter told Streetwise Reports that several companies have him “excited” about future possibilities right now.
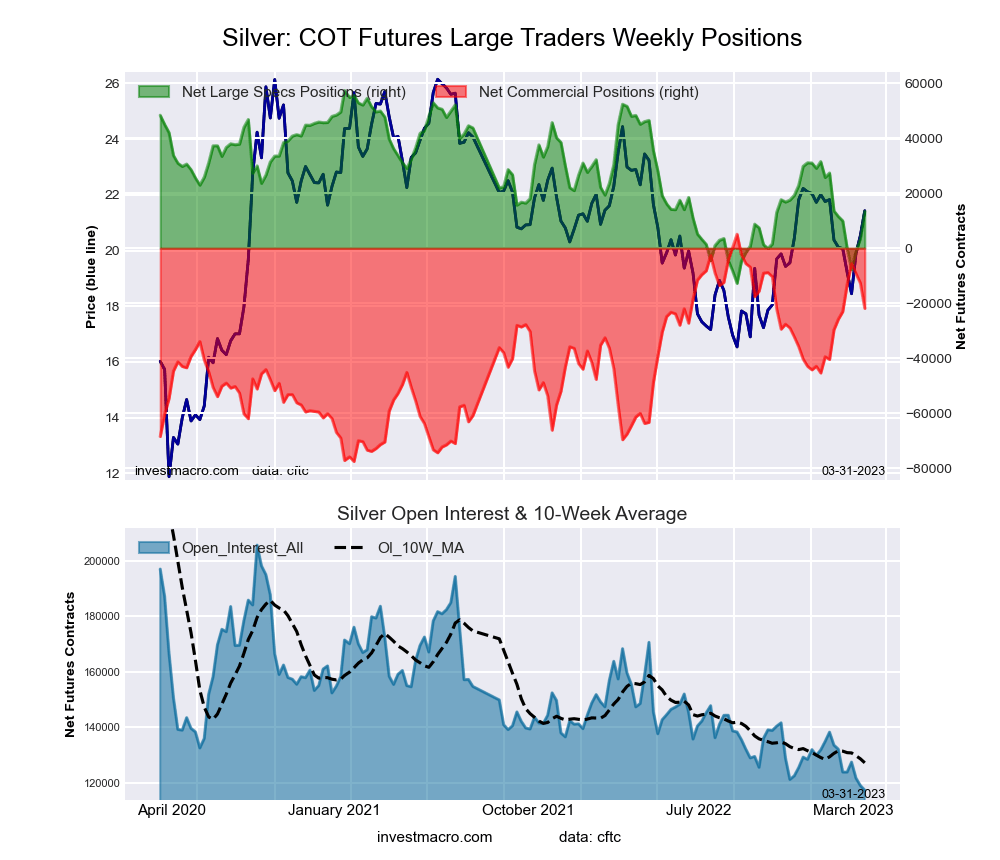
Silver is great at coating electrical contacts, and it’s an important element in solar technology. Almost all computers, phones, cars, and appliances contain the metal. Because of this growing demand, the Silver Institute predicted global demand for silver would reach a new high of 1.21 billion ounces in 2022, up 16% from the preceding year.
“Physical investment (in silver) in 2022 (was) on track to jump by 18% to 329 (million ounces) Moz, which would also be a new record,” the report said.
Silver prices have gone up US$3 an ounce since March 7; Chen said he thinks it’s just “the beginning.”
While one of the companies Chen recommends will be familiar to his readers, there are some surprises, including a country you might not associate with precious metal mining.
First Majestic Silver Corp.
What has Chen so excited?
First Majestic Silver Corp. (FR:TSX; AG:NYSE; FMV:FSE) recently announced it was suspending all mining activities at its Jerritt Canyon Gold Mine in Nevada.
The company said it had been focused on increasing mining rates there to feed the processing plant at a minimum of 3,000 tonnes per day but has never hit that threshold since buying the project about two years ago.
The news of the suspension sent First Majestic’s stock sinking 24% in one day.
Chen said he knew Jarrett Canyon was an issue for the company and has “been waiting for this day for a long time.”
“It’s a good opportunity,” Chen said. “Today is a happy day, and I will start loading up on First Majestic.”
| Retail: 66% |
| Institutions: 32% |
| Insiders & Management: 2% |
| Strategic Investors: 0% |
66%
32%
*Share Structure as of 3/27/2023
While the mine accounted for 21% of the company’s revenue in 2022, First Majestic still has three other major properties: San Dimas, Santa Elena, and La Encantada in Mexico. It also recorded record annual revenue in 2022 and just renewed a share repurchase program.
“They have free cash flow,” Chen said. “It was just a mistake to buy Jarett Canyon.”
A research note by Jefferson Research on March 24 rated its cash flow “strong.”
First Majestic said it still intends to process about 45,000 tonnes of above-ground stockpiles through the plant at Jerritt Canyon and will continue exploration activities at the site.
“The company will continue exploring both near-mine and prospective regional greenfield targets to grow Jerritt Canyon’s resources, which we believe will significantly enhance the economics for the eventual restart of operations,” First Majestic said.
According to Yahoo Finance, about 2% of First Majestic is held by insiders, and 32% is held by institutions. The rest is retail.
Insider shareholders include President and Chief Executive Officer Keith Neumeyer, who owns 1.56% or 4.1 million shares, Reuters said. Top institutional owners include Van Eck Associates Corp. with 9.99% or 26.27 million shares and the Vanguard Group Inc. with 3% or 7.88 million shares.
It has a market cap of US$1.74 million with 263 million shares outstanding, 256.2 million of them free-floating. It trades in a 52-week range of US$14.59 and US$5.53.
i-80 Gold Corp.
Another precious metal stock Chen likes in the second quarter is i-80 Gold Corp. (IAU:TSX; IAUCF:OTCQX), which is focused on its five projects in northern Nevada: Lone Tree, Ruby Hill, Granite Creek, McCoy-Cove, and Buffalo Mountain. Its stated goal is to achieve mid-tier gold producer status.
The stock moved as high as CA$3.52 in February but sank to CA$2.97 on March 7 when news broke that major shareholder Equinox Gold Corp. (EQX:TSX; EQX:NYSE.A) was selling CA$32 million in shares in a private placement. Equinox’s ownership went from about 25% to about 20%.
However, the company has recently made discoveries at its Ruby Hill project and graduated to producer status at Granite Creek.
| Institutions: 49% |
| Retail: 28% |
| Insiders & Management: 23% |
| Strategic Investors: 0% |
49%
28%
23%
*Share Structure as of 3/27/2023
“It makes a very good opportunity now,” Chen said. “And they continue making the discoveries of very high-grade gold, silver, and base metals in the middle of Nevada. I like the price.”
The stock had risen to CA$3.11 per share by Monday morning.
The company, which started trading on the New York Stock Exchange last May, said it had gold sales of more than 21,000 ounces in 2022, increased the size of Granite Creek by more than 500 hectares, and completed a total of more than 240,000 feet of drilling.
The National Bank of Canada was neutral on i-80 Gold’s fourth-quarter 2022 results released recently, saying there were “no surprises.” It gave the company an outperform rating with a CA$5.50 target.
About 23% of the company is held by insiders, and about 49% is held by institutions, according to Yahoo Finance. The rest is retail.
The top insider shareholder is Chief Executive Officer and Director Ewan Downie, with 2.24% or 5.53 million shares, Reuters said. Top institutional shareholders include Equinox with 19.98% or 49.24 million shares, Sprott Asset Management LP with 8.45% or 20.81 million shares, and Orion Resources Partners (USA) LP with 8.24% or 20.3 million shares.
It has a market cap of US$548 million with 246.4 million shares outstanding, 169.69 million of them free-floating. It trades in a 52-week range of US$3.18 and US$1.52.
Cerro de Pasco Resources Inc.
Chen also has high hopes for Cerro de Pasco Resources Inc. (CNSX:CDPR; OTCMKTS:GPPRF), focused on the development of the El Metalurgista mining concession in Peru.
It recently announced that it had signed a memorandum of understanding with Volcan Compania Minera to collaborate in the first phase of exploring the Quiulacocha Tailings Project at the site.
Glencore International Plc (GLNCY:OTCMKTS) is providing a US$2 million loan to cover the costs of the first phase of the project, including geophysical studies, sonic drilling, laboratory testing, mineralogy studies, resource estimation, and economic assessment.
| Retail: 59% |
| Insiders & Management: 23% |
| Institutions: 18% |
| Strategic Investors: 0% |
59%
23%
18%
*Share Structure as of 3/27/2023
Volcan will allow Cerro de Pasco rights to process materials through its processing plants.
The Glencore loan is unusual, Chen said. The Peruvian government is also collaborating by giving the company a special designation.
“Glencore is really interested in their deposits,” Chen said. “We should have some very exciting results coming out in the fall.”
The stock was at CA$0.105 on Monday afternoon.
“Right now is the best time to buy the stock in the past five years,” Chen said. “Once people wake up, I expect the stock will have a huge performance.”
About 23% of the company is owned by insiders, according to Yahoo Finance, and 18% is held by institutions. The rest is retail.
According to Reuters, top institutional holders include LH Financial Services Corp., with 18.37% or 52.89 million shares, and Gordaldo Ltd. With 10.82% or 31.15 million shares. Executive Chairman Steven Zadka leads insiders with 8.72% or 25.1 million shares.
Cerro de Pasco has a market cap of CA$30.2 million with 287.9 million shares outstanding, 222.88 million of them free-floating. It trades in a 52-week range of CA$0.28 and CA$0.07.
Irving Resources Inc.
Another company that has Chen’s attention is Irving Resources Inc. (IRV:CSE; IRVRF:OTCQX), a Canadian explorer going after gold and silver in Japan.
The country is known for some of the highest-grade gold mines in the world, and there are dozens of past-producing epithermal mines, Irving Resources said. But Japan shut down most of its gold production to focus on base metals during World War II, and little exploration has occurred since then.
Few mines there have seen modern-day exploration techniques like drilling, the company said.
Chen said he plans to visit the mines there with renowned geologist Quinton Hennigh, who is a director and technical advisor for the company, next month.
“It should be a very exciting story,” he said.
| Retail: 65% |
| Strategic Investors: 24% |
| Insiders & Management: 10% |
| Institutions: 1% |
65%
24%
10%
*Share Structure as of 3/27/2023
Earlier this month, Irving announced it had discovered a new high-grade vein system in a newly drilled hole near the historic Hokuryu mine at its flagship Omui project in Hokkaido.
The company encountered veins extending 33 meters and grading 1.35 grams per tonne gold (g/t Au) and 15.45 g/t silver (Ag).
Irving Resources said it has started an aggressive exploration program for this year, testing multiple new drill targets and vein extensions at Omui.
Newmont Corp. (NEM:NYSE) owns 18.34% of the company, Irving said, while Japan Gold Corp. (JG:TSX.V) is partnering with Barrick Gold Corp. (ABX:TSX; GOLD:NYSE).
“So, the largest mining companies are very interested in Japan,” Chen said.
The company said management and directors own about 10%, and strategic investors Newmont and Sumitomo Corp. (8053:TKY; SSUMF:OTCPK) own 18% and 6%, respectively. Yahoo Finance said about 1% is owned institutions. The rest is retail.
According to Reuters, top insiders include President and Chief Executive Officer Akiko Levinson with 4.78% or 3.46 million shares and Hennigh with 3.14% or 2.27 million shares.
Irving Resources has a market cap of CA$85.5 million with 72.4 million shares outstanding, 41 million of them free-floating. It trades in a 52-week range of CA$1.84 and CA$0.63.
First Tellurium Corp.
Finally, Chen recommended a company he’s picked before, First Tellurium Corp. (FTEL:CSE).
Tellurium is another element important to the new green economy, as it is critical to solar panels and lithium batteries. It has also been used to vulcanize rubber, tint glass, and manufacture rewritable CDs and DVDs.
First Tellurium’s Deer Horn property in British Columbia is known to have the only positive Preliminary Economic Assessment (PEA) for a tellurium project (Te) in North America. It’s named by First Solar as one of only four world-class Te projects.
“There’s a very decent chance tellurium will breakout this year, because First Solar is using 60 to 70% of worldwide production to make a solar panel,” Chen said. “Their production has grown rapidly.”
| Retail: 89% |
| Management/Insiders: 11% |
| Institutions: 0% |
| Strategic Investors: 0% |
89%
11%
*Share Structure as of 3/27/2023
Recent International Energy Agency (IEA) forecasts show that solar photovoltaic (solar PV) technology will generate more power by 2027 than any other source.
Deer Horn also has a large silver resource, the company said. Silver is another important element in solar panels.
“We have a very attractive mix of precious and green metals, including copper porphyry mineralization, in a time of strong metals markets,” First Tellurium President and Chief Executive Officer Tyron Docherty said.
According to the company, 11% of First Tellurium is owned by management and insiders. Docherty owns 10.50% or 7.63 million shares, Director Josef Anthony Steve Fogarassy has 1.38% or 1 million shares, and Director Lyle Allen Schwabe has 0.77% or 0.56 million shares. There are no institutional investors, and the rest is retail.
The company has a market cap of CA$11.6 million, with 72.7 million shares outstanding, 63.46 of them free-floating. It trades in a 52-week range of CA$0.255 and CA$0.085.
Sign up for our FREE newsletter
Disclosures:
1) Steve Sobek wrote this article for Streetwise Reports LLC. He or members of his household own securities of the following companies mentioned in the article: None. He or members of his household are paid by the following companies mentioned in this article: None.
2) The following companies mentioned in this article are billboard sponsors of Streetwise Reports: None. Click here for important disclosures about sponsor fees. The information provided above is for informational purposes only and is not a recommendation to buy or sell any security. As of the date of this article, an affiliate of Streetwise Reports has a consulting relationship with: First Tellurium Corp. Please click here for more information.
3) The article does not constitute investment advice. Each reader is encouraged to consult with his or her individual financial professional and any action a reader takes as a result of information presented here is his or her own responsibility. By opening this page, each reader accepts and agrees to Streetwise Reports’ terms of use and full legal disclaimer. This article is not a solicitation for investment. Streetwise Reports does not render general or specific investment advice and the information on Streetwise Reports should not be considered a recommendation to buy or sell any security. Streetwise Reports does not endorse or recommend the business, products, services or securities of any company mentioned on Streetwise Reports.
4) From time to time, Streetwise Reports LLC and its directors, officers, employees or members of their families, as well as persons interviewed for articles and interviews on the site, may have a long or short position in securities mentioned. Directors, officers, employees or members of their immediate families are prohibited from making purchases and/or sales of those securities in the open market or otherwise from the time of the decision to publish an article until three business days after the publication of the article. The foregoing prohibition does not apply to articles that in substance only restate previously published company releases. As of the date of this article, officers and/or employees of Streetwise Reports LLC (including members of their household) own securities of First Majestic Silver Corp. and First Tellurium Corp., companies mentioned in this article.


