
By InvestMacro
Here are the latest charts and statistics for the Commitment of Traders (COT) reports data published by the Commodities Futures Trading Commission (CFTC).
The latest COT data is updated through Tuesday February 21st and shows a quick view of how large traders (for-profit speculators and commercial hedgers) were positioned in the futures markets.
*** This data is still a few weeks behind the current data because the CFTC up-to-date data has been delayed due to a cybersecurity event that happened in early February to ION Cleared Derivatives (a subsidiary of ION Markets). This hack of ION has created a problem for the large trader positions to be reported and reconciled. The CFTC has back-filled some data over the past few weeks and will get the data back up to date in the coming weeks.
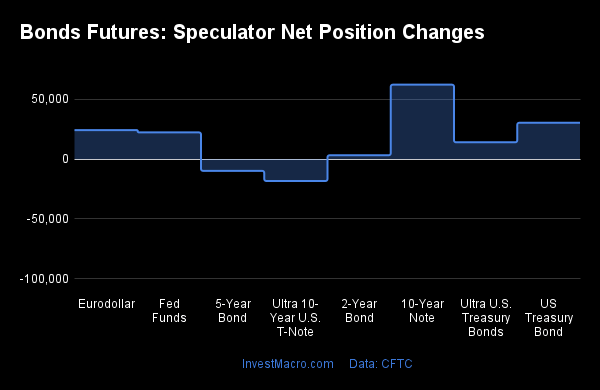
Weekly Speculator Changes led by 10-Year Bonds & US Treasury Bonds
Free Reports:
 Get our Weekly Commitment of Traders Reports - See where the biggest traders (Hedge Funds and Commercial Hedgers) are positioned in the futures markets on a weekly basis.
 Sign Up for Our Stock Market Newsletter – Get updated on News, Charts & Rankings of Public Companies when you join our Stocks Newsletter
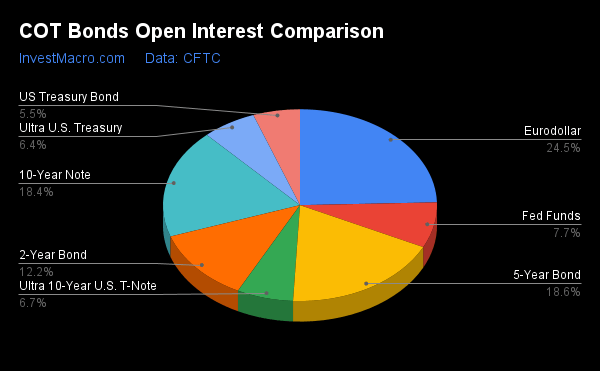
The COT bond market speculator bets were higher through February 21st as six out of the eight bond markets we cover had higher positioning while the other two markets had lower speculator contracts.
Leading the gains for the bond markets was the 10-Year Bonds (62,275 contracts) with the US Treasury Bonds (30,404 contracts), the Fed Funds (22,320 contracts), the Ultra Treasury Bonds (14,048 contracts), Eurodollar (24,267 contracts) and the 2-Year Bonds (3,194 contracts) also showing positive weeks.
The bond markets with declines in speculator bets for the week were the Ultra 10-Year Bonds (-18,345 contracts) and the 5-Year Bonds (-9,858 contracts) also registering lower bets on the week.
| Feb-21-2023 | OI | OI-Index | Spec-Net | Spec-Index | Com-Net | COM-Index | Smalls-Net | Smalls-Index |
|---|---|---|---|---|---|---|---|---|
| Eurodollar | 5,785,434 | 0 | -1,008,528 | 35 | 1,260,816 | 64 | -252,288 | 49 |
| FedFunds | 1,810,074 | 73 | -90,024 | 29 | 104,969 | 73 | -14,945 | 44 |
| 2-Year | 2,884,053 | 71 | -693,492 | 0 | 657,116 | 100 | 36,376 | 68 |
| Long T-Bond | 1,307,317 | 86 | -154,816 | 34 | 125,285 | 55 | 29,531 | 86 |
| 10-Year | 4,335,634 | 88 | -500,660 | 11 | 590,357 | 92 | -89,697 | 59 |
| 5-Year | 4,387,851 | 84 | -599,249 | 16 | 631,381 | 84 | -32,132 | 72 |
Strength Scores led by Eurodollar & US Treasury Bonds
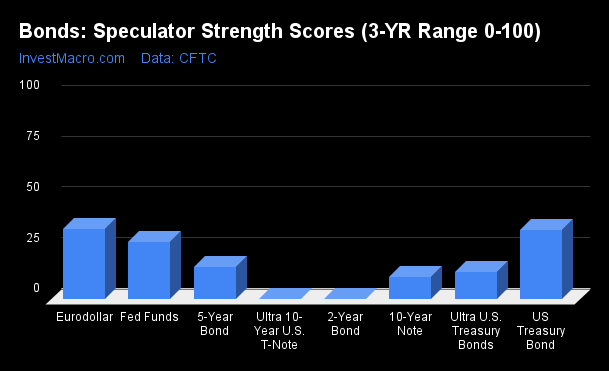
COT Strength Scores (a normalized measure of Speculator positions over a 3-Year range, from 0 to 100 where above 80 is Extreme-Bullish and below 20 is Extreme-Bearish) showed that the Eurodollar (35 percent) and the US Treasury Bonds (34 percent) led the bond markets through February 21st. The Fed Funds (29 percent) comes in as the next highest in the weekly strength scores.
On the downside, the Ultra 10-Year Bonds (0 percent), 2-Year Bonds (0 percent), 10-Year Bonds (11 percent), Ultra US Treasury Bond (13.4 percent) and the 5-Year Bond (16.1 percent) came in at the lowest strength levels and were in Extreme-Bearish territory (below 20 percent).
Strength Statistics:
Fed Funds (28.5 percent) vs Fed Funds previous week (25.8 percent)
2-Year Bond (0.4 percent) vs 2-Year Bond previous week (0.0 percent)
5-Year Bond (16.1 percent) vs 5-Year Bond previous week (17.3 percent)
10-Year Bond (11.1 percent) vs 10-Year Bond previous week (3.0 percent)
Ultra 10-Year Bond (0.0 percent) vs Ultra 10-Year Bond previous week (4.4 percent)
US Treasury Bond (34.2 percent) vs US Treasury Bond previous week (24.3 percent)
Ultra US Treasury Bond (13.4 percent) vs Ultra US Treasury Bond previous week (7.1 percent)
Eurodollar (34.6 percent) vs Eurodollar previous week (34.1 percent)
Fed Funds & 5-Year Bonds top the 6-Week Strength Trends
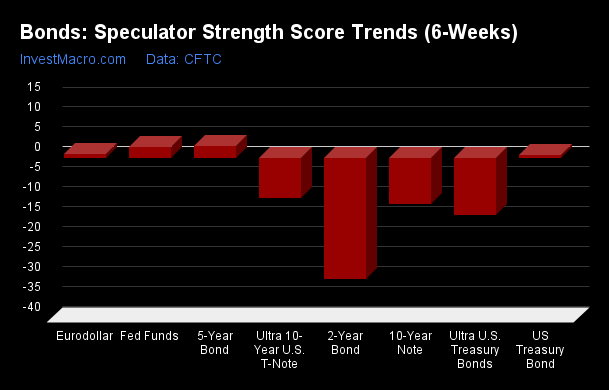
COT Strength Score Trends (or move index, calculates the 6-week changes in strength scores) showed that the Fed Funds (3 percent) and the 5-Year Bonds (3 percent) led the past six weeks trends for bonds through February 21st. The Eurodollar (1 percent) is the next highest positive movers in the latest trends data.
The 2-Year Bonds (-30 percent) leads the downside trend scores currently with the Ultra Treasury Bonds (-14 percent) and the 10-Year Bonds (-12 percent) following next with lower trend scores.
Strength Trend Statistics:
Fed Funds (2.8 percent) vs Fed Funds previous week (-0.5 percent)
2-Year Bond (-30.3 percent) vs 2-Year Bond previous week (-22.3 percent)
5-Year Bond (2.9 percent) vs 5-Year Bond previous week (7.7 percent)
10-Year Bond (-11.6 percent) vs 10-Year Bond previous week (-23.4 percent)
Ultra 10-Year Bond (-10.0 percent) vs Ultra 10-Year Bond previous week (-2.0 percent)
US Treasury Bond (0.8 percent) vs US Treasury Bond previous week (-5.2 percent)
Ultra US Treasury Bond (-14.2 percent) vs Ultra US Treasury Bond previous week (-23.4 percent)
Eurodollar (0.9 percent) vs Eurodollar previous week (-0.9 percent)
Individual Bond Markets:
3-Month Eurodollars Futures:
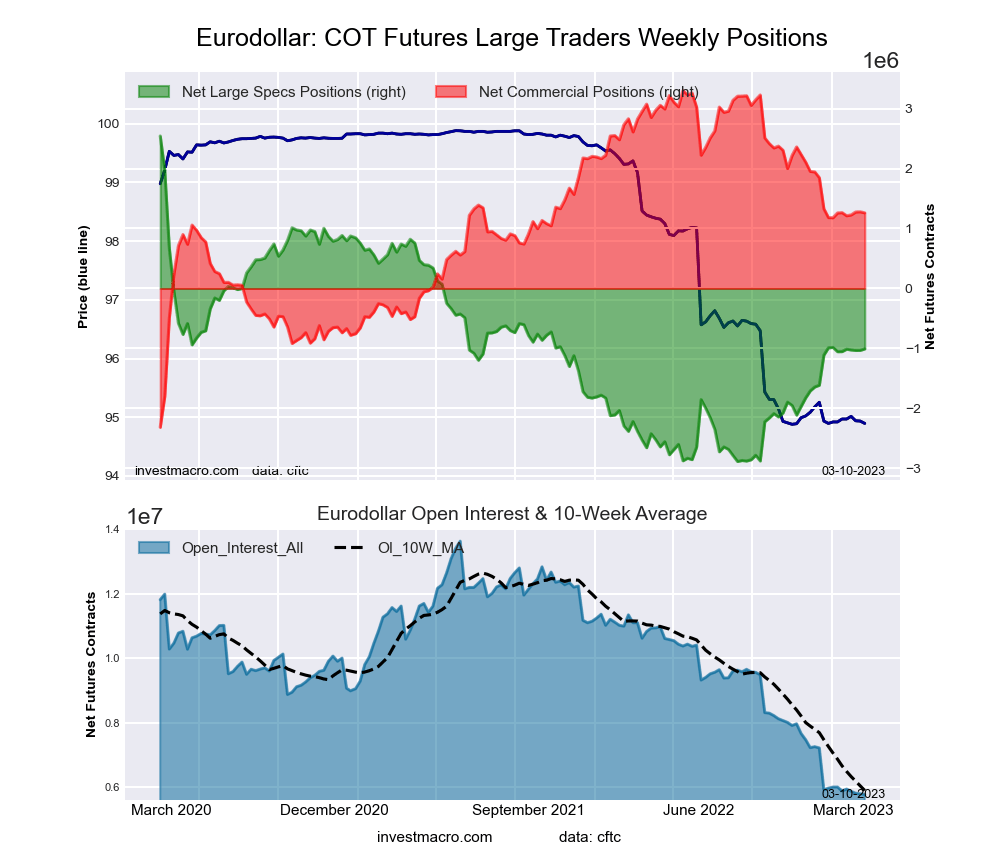 The 3-Month Eurodollars large speculator standing the week came in at a net position of -1,008,528 contracts in the data reported through Tuesday February 21st. This was a weekly advance of 24,267 contracts from the previous week which had a total of -1,032,795 net contracts.
The week’s current strength score (the trader positioning range over the past three years, measured from 0 to 100) shows the speculators are currently Bearish with a score of 34.6 percent. The commercials are Bullish with a score of 63.7 percent and the small traders (not shown in chart) are Bearish with a score of 48.9 percent.
| 3-Month Eurodollars Statistics | SPECULATORS | COMMERCIALS | SMALL TRADERS |
| – Percent of Open Interest Longs: | 9.7 | 67.8 | 4.6 |
| – Percent of Open Interest Shorts: | 27.1 | 46.1 | 8.9 |
| – Net Position: | -1,008,528 | 1,260,816 | -252,288 |
| – Gross Longs: | 561,343 | 3,925,149 | 263,818 |
| – Gross Shorts: | 1,569,871 | 2,664,333 | 516,106 |
| – Long to Short Ratio: | 0.4 to 1 | 1.5 to 1 | 0.5 to 1 |
| NET POSITION TREND: | |||
| – Strength Index Score (3 Year Range Pct): | 34.6 | 63.7 | 48.9 |
| – Strength Index Reading (3 Year Range): | Bearish | Bullish | Bearish |
| NET POSITION MOVEMENT INDEX: | |||
| – 6-Week Change in Strength Index: | 0.9 | 0.0 | -10.8 |
30-Day Federal Funds Futures:
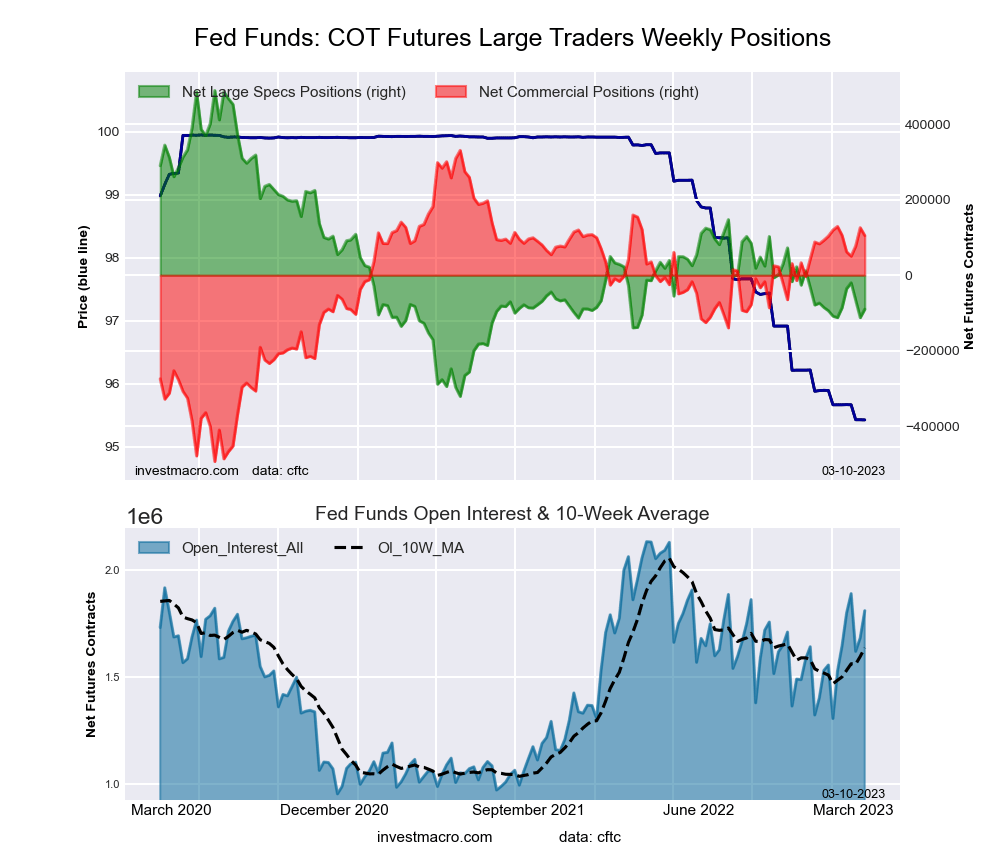 The 30-Day Federal Funds large speculator standing the week came in at a net position of -90,024 contracts in the data reported through Tuesday February 21st. This was a weekly increase of 22,320 contracts from the previous week which had a total of -112,344 net contracts.
The week’s current strength score (the trader positioning range over the past three years, measured from 0 to 100) shows the speculators are currently Bearish with a score of 28.5 percent. The commercials are Bullish with a score of 72.6 percent and the small traders (not shown in chart) are Bearish with a score of 44.1 percent.
| 30-Day Federal Funds Statistics | SPECULATORS | COMMERCIALS | SMALL TRADERS |
| – Percent of Open Interest Longs: | 8.1 | 75.0 | 2.0 |
| – Percent of Open Interest Shorts: | 13.1 | 69.2 | 2.9 |
| – Net Position: | -90,024 | 104,969 | -14,945 |
| – Gross Longs: | 146,386 | 1,357,910 | 36,925 |
| – Gross Shorts: | 236,410 | 1,252,941 | 51,870 |
| – Long to Short Ratio: | 0.6 to 1 | 1.1 to 1 | 0.7 to 1 |
| NET POSITION TREND: | |||
| – Strength Index Score (3 Year Range Pct): | 28.5 | 72.6 | 44.1 |
| – Strength Index Reading (3 Year Range): | Bearish | Bullish | Bearish |
| NET POSITION MOVEMENT INDEX: | |||
| – 6-Week Change in Strength Index: | 2.8 | -2.9 | 5.1 |
2-Year Treasury Note Futures:
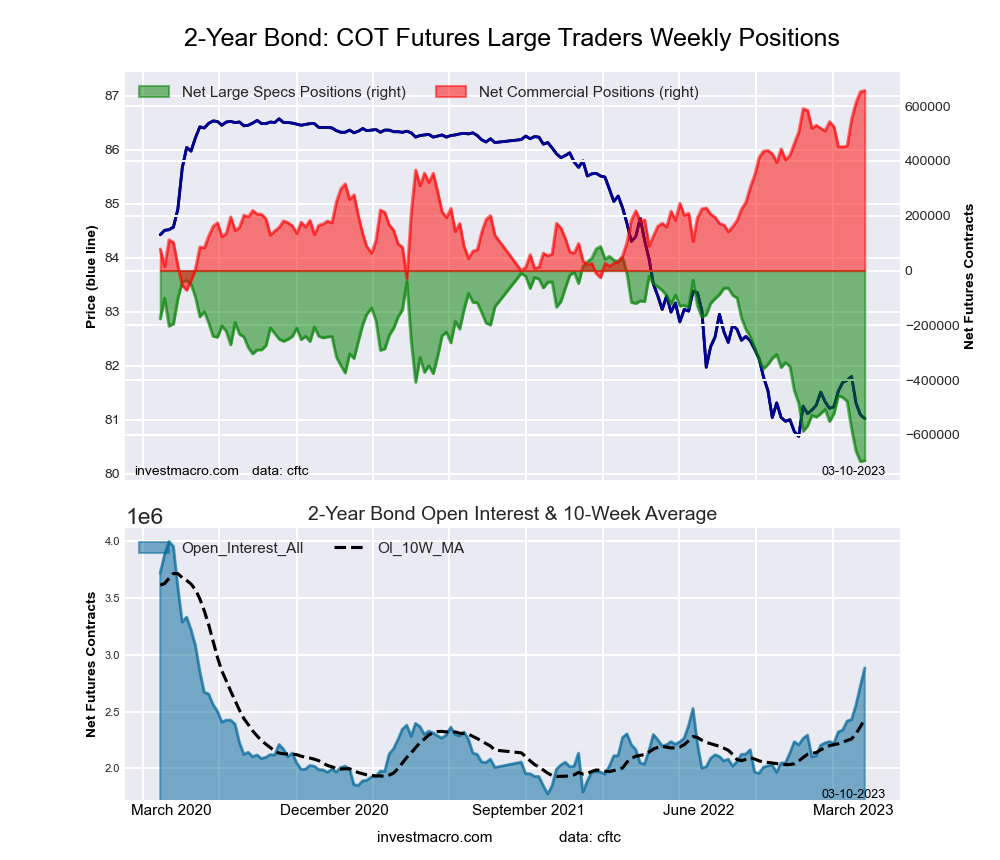 The 2-Year Treasury Note large speculator standing the week came in at a net position of -693,492 contracts in the data reported through Tuesday February 21st. This was a weekly increase of 3,194 contracts from the previous week which had a total of -696,686 net contracts.
The week’s current strength score (the trader positioning range over the past three years, measured from 0 to 100) shows the speculators are currently Bearish-Extreme with a score of 0.4 percent. The commercials are Bullish-Extreme with a score of 100.0 percent and the small traders (not shown in chart) are Bullish with a score of 68.3 percent.
| 2-Year Treasury Note Statistics | SPECULATORS | COMMERCIALS | SMALL TRADERS |
| – Percent of Open Interest Longs: | 6.7 | 79.4 | 11.3 |
| – Percent of Open Interest Shorts: | 30.8 | 56.6 | 10.0 |
| – Net Position: | -693,492 | 657,116 | 36,376 |
| – Gross Longs: | 193,928 | 2,288,617 | 325,019 |
| – Gross Shorts: | 887,420 | 1,631,501 | 288,643 |
| – Long to Short Ratio: | 0.2 to 1 | 1.4 to 1 | 1.1 to 1 |
| NET POSITION TREND: | |||
| – Strength Index Score (3 Year Range Pct): | 0.4 | 100.0 | 68.3 |
| – Strength Index Reading (3 Year Range): | Bearish-Extreme | Bullish-Extreme | Bullish |
| NET POSITION MOVEMENT INDEX: | |||
| – 6-Week Change in Strength Index: | -30.3 | 28.1 | 14.6 |
5-Year Treasury Note Futures:
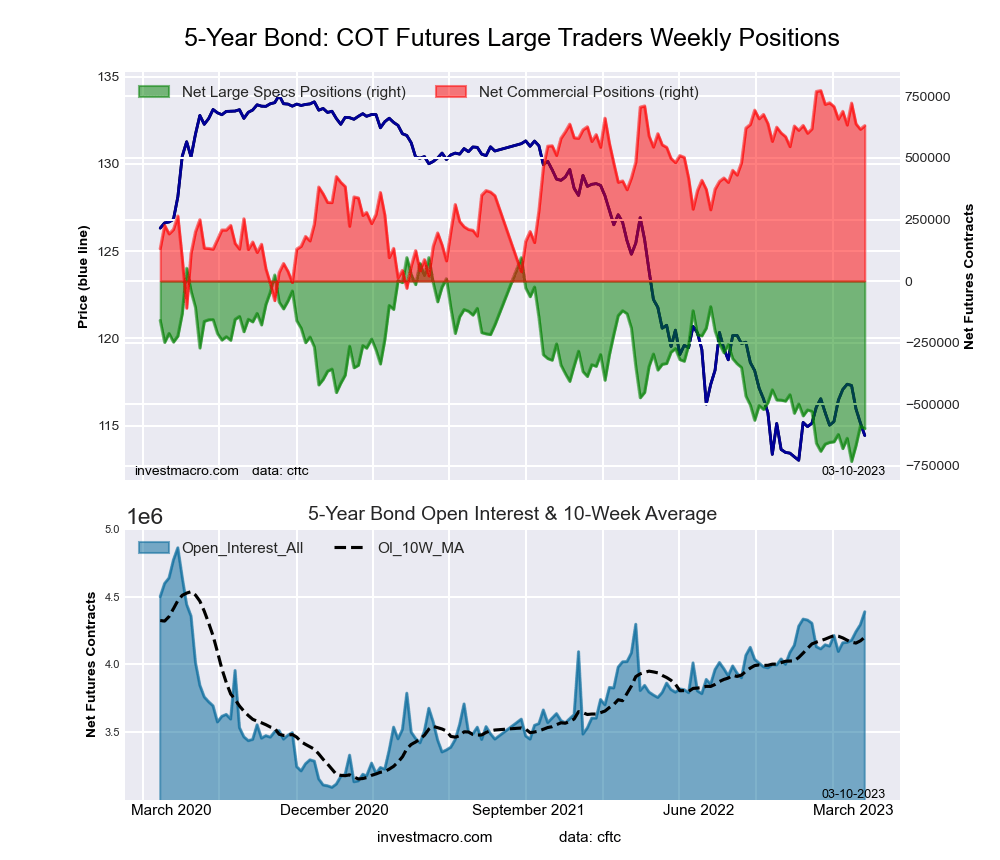 The 5-Year Treasury Note large speculator standing the week came in at a net position of -599,249 contracts in the data reported through TuesdayFebruary 21st. This was a weekly decrease of -9,858 contracts from the previous week which had a total of -589,391 net contracts.
The week’s current strength score (the trader positioning range over the past three years, measured from 0 to 100) shows the speculators are currently Bearish-Extreme with a score of 16.1 percent. The commercials are Bullish-Extreme with a score of 83.9 percent and the small traders (not shown in chart) are Bullish with a score of 72.2 percent.
| 5-Year Treasury Note Statistics | SPECULATORS | COMMERCIALS | SMALL TRADERS |
| – Percent of Open Interest Longs: | 7.6 | 80.5 | 9.2 |
| – Percent of Open Interest Shorts: | 21.2 | 66.2 | 9.9 |
| – Net Position: | -599,249 | 631,381 | -32,132 |
| – Gross Longs: | 331,329 | 3,534,403 | 401,556 |
| – Gross Shorts: | 930,578 | 2,903,022 | 433,688 |
| – Long to Short Ratio: | 0.4 to 1 | 1.2 to 1 | 0.9 to 1 |
| NET POSITION TREND: | |||
| – Strength Index Score (3 Year Range Pct): | 16.1 | 83.9 | 72.2 |
| – Strength Index Reading (3 Year Range): | Bearish-Extreme | Bullish-Extreme | Bullish |
| NET POSITION MOVEMENT INDEX: | |||
| – 6-Week Change in Strength Index: | 2.9 | -3.0 | 0.6 |
10-Year Treasury Note Futures:
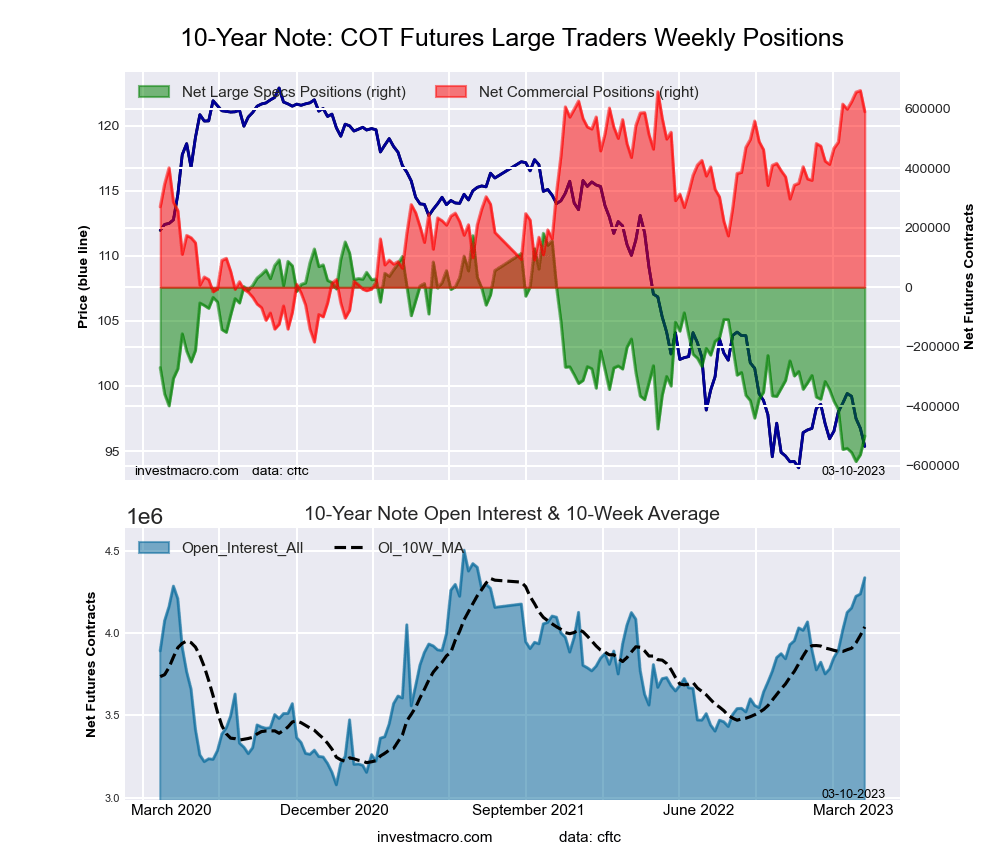 The 10-Year Treasury Note large speculator standing the week came in at a net position of -500,660 contracts in the data reported through Tuesday February 21st. This was a weekly rise of 62,275 contracts from the previous week which had a total of -562,935 net contracts.
The week’s current strength score (the trader positioning range over the past three years, measured from 0 to 100) shows the speculators are currently Bearish-Extreme with a score of 11.1 percent. The commercials are Bullish-Extreme with a score of 91.6 percent and the small traders (not shown in chart) are Bullish with a score of 58.8 percent.
| 10-Year Treasury Note Statistics | SPECULATORS | COMMERCIALS | SMALL TRADERS |
| – Percent of Open Interest Longs: | 9.8 | 77.0 | 9.8 |
| – Percent of Open Interest Shorts: | 21.3 | 63.4 | 11.9 |
| – Net Position: | -500,660 | 590,357 | -89,697 |
| – Gross Longs: | 423,167 | 3,337,222 | 425,774 |
| – Gross Shorts: | 923,827 | 2,746,865 | 515,471 |
| – Long to Short Ratio: | 0.5 to 1 | 1.2 to 1 | 0.8 to 1 |
| NET POSITION TREND: | |||
| – Strength Index Score (3 Year Range Pct): | 11.1 | 91.6 | 58.8 |
| – Strength Index Reading (3 Year Range): | Bearish-Extreme | Bullish-Extreme | Bullish |
| NET POSITION MOVEMENT INDEX: | |||
| – 6-Week Change in Strength Index: | -11.6 | 12.0 | -3.0 |
Ultra 10-Year Notes Futures:
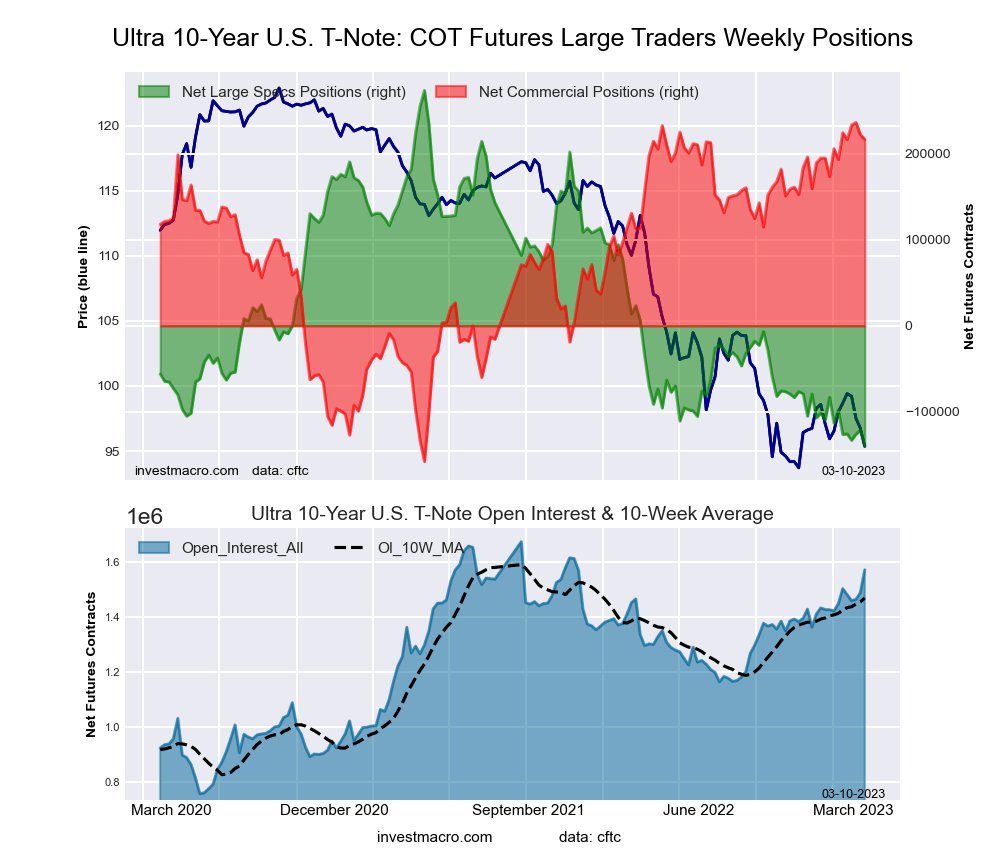 The Ultra 10-Year Notes large speculator standing the week came in at a net position of -139,776 contracts in the data reported through Tuesday February 21st. This was a weekly decline of -18,345 contracts from the previous week which had a total of -121,431 net contracts.
The week’s current strength score (the trader positioning range over the past three years, measured from 0 to 100) shows the speculators are currently Bearish-Extreme with a score of 0.0 percent. The commercials are Bullish-Extreme with a score of 95.0 percent and the small traders (not shown in chart) are Bullish with a score of 75.8 percent.
| Ultra 10-Year Notes Statistics | SPECULATORS | COMMERCIALS | SMALL TRADERS |
| – Percent of Open Interest Longs: | 9.7 | 74.7 | 13.2 |
| – Percent of Open Interest Shorts: | 18.6 | 60.9 | 18.1 |
| – Net Position: | -139,776 | 216,868 | -77,092 |
| – Gross Longs: | 152,355 | 1,175,266 | 207,505 |
| – Gross Shorts: | 292,131 | 958,398 | 284,597 |
| – Long to Short Ratio: | 0.5 to 1 | 1.2 to 1 | 0.7 to 1 |
| NET POSITION TREND: | |||
| – Strength Index Score (3 Year Range Pct): | 0.0 | 95.0 | 75.8 |
| – Strength Index Reading (3 Year Range): | Bearish-Extreme | Bullish-Extreme | Bullish |
| NET POSITION MOVEMENT INDEX: | |||
| – 6-Week Change in Strength Index: | -10.0 | 6.0 | 11.9 |
US Treasury Bonds Futures:
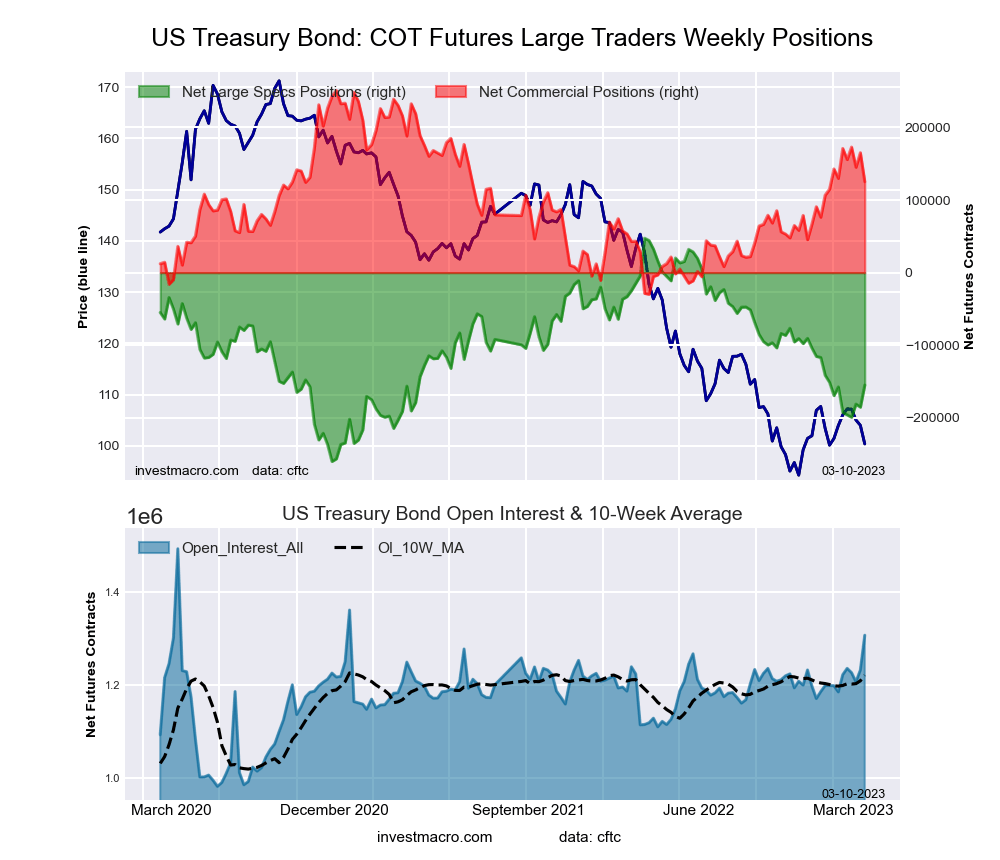 The US Treasury Bonds large speculator standing the week came in at a net position of -154,816 contracts in the data reported through Tuesday February 21st. This was a weekly boost of 30,404 contracts from the previous week which had a total of -185,220 net contracts.
The week’s current strength score (the trader positioning range over the past three years, measured from 0 to 100) shows the speculators are currently Bearish with a score of 34.2 percent. The commercials are Bullish with a score of 55.3 percent and the small traders (not shown in chart) are Bullish-Extreme with a score of 86.1 percent.
| US Treasury Bonds Statistics | SPECULATORS | COMMERCIALS | SMALL TRADERS |
| – Percent of Open Interest Longs: | 6.6 | 74.3 | 15.5 |
| – Percent of Open Interest Shorts: | 18.5 | 64.7 | 13.2 |
| – Net Position: | -154,816 | 125,285 | 29,531 |
| – Gross Longs: | 86,475 | 971,509 | 202,158 |
| – Gross Shorts: | 241,291 | 846,224 | 172,627 |
| – Long to Short Ratio: | 0.4 to 1 | 1.1 to 1 | 1.2 to 1 |
| NET POSITION TREND: | |||
| – Strength Index Score (3 Year Range Pct): | 34.2 | 55.3 | 86.1 |
| – Strength Index Reading (3 Year Range): | Bearish | Bullish | Bullish-Extreme |
| NET POSITION MOVEMENT INDEX: | |||
| – 6-Week Change in Strength Index: | 0.8 | -1.6 | 1.7 |
Ultra US Treasury Bonds Futures:
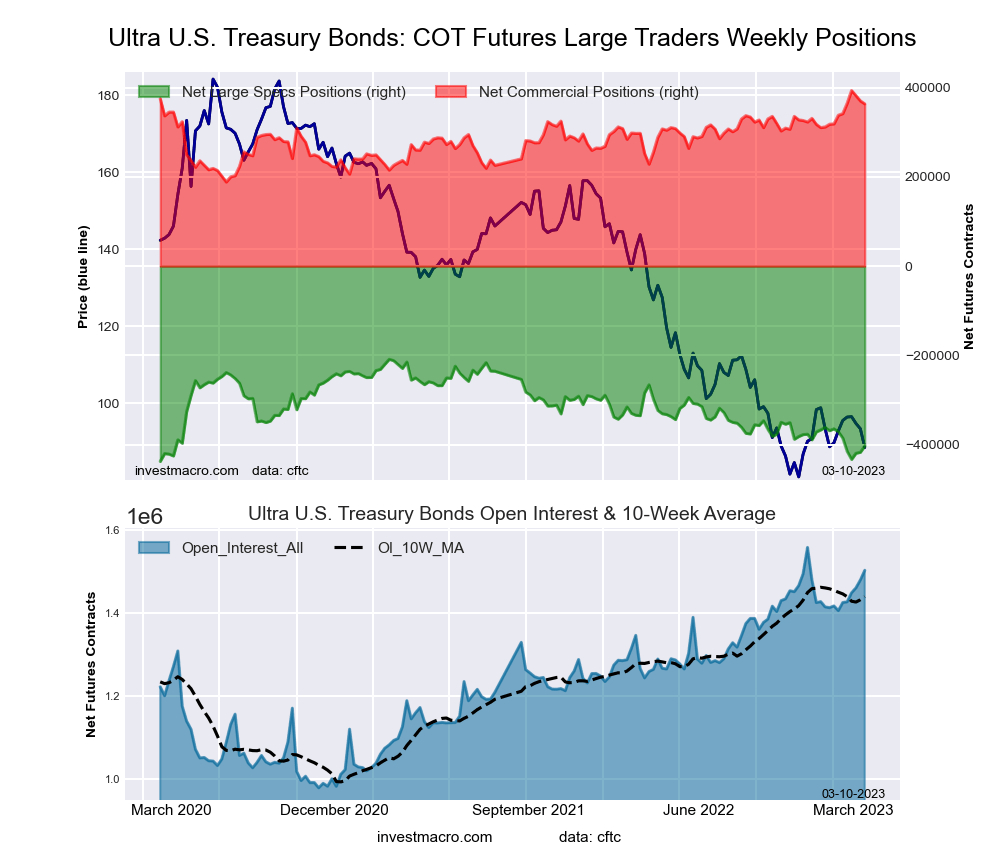 The Ultra US Treasury Bonds large speculator standing the week came in at a net position of -403,372 contracts in the data reported through Tuesday February 21st. This was a weekly lift of 14,048 contracts from the previous week which had a total of -417,420 net contracts.
The week’s current strength score (the trader positioning range over the past three years, measured from 0 to 100) shows the speculators are currently Bearish-Extreme with a score of 13.4 percent. The commercials are Bullish-Extreme with a score of 85.4 percent and the small traders (not shown in chart) are Bullish with a score of 68.3 percent.
| Ultra US Treasury Bonds Statistics | SPECULATORS | COMMERCIALS | SMALL TRADERS |
| – Percent of Open Interest Longs: | 5.4 | 81.8 | 12.0 |
| – Percent of Open Interest Shorts: | 32.3 | 57.6 | 9.4 |
| – Net Position: | -403,372 | 363,974 | 39,398 |
| – Gross Longs: | 81,167 | 1,228,622 | 180,433 |
| – Gross Shorts: | 484,539 | 864,648 | 141,035 |
| – Long to Short Ratio: | 0.2 to 1 | 1.4 to 1 | 1.3 to 1 |
| NET POSITION TREND: | |||
| – Strength Index Score (3 Year Range Pct): | 13.4 | 85.4 | 68.3 |
| – Strength Index Reading (3 Year Range): | Bearish-Extreme | Bullish-Extreme | Bullish |
| NET POSITION MOVEMENT INDEX: | |||
| – 6-Week Change in Strength Index: | -14.2 | 12.5 | 5.5 |
Article By InvestMacro – Receive our weekly COT Newsletter
*COT Report: The COT data, released weekly to the public each Friday, is updated through the most recent Tuesday (data is 3 days old) and shows a quick view of how large speculators or non-commercials (for-profit traders) were positioned in the futures markets.
The CFTC categorizes trader positions according to commercial hedgers (traders who use futures contracts for hedging as part of the business), non-commercials (large traders who speculate to realize trading profits) and nonreportable traders (usually small traders/speculators) as well as their open interest (contracts open in the market at time of reporting). See CFTC criteria here.

- COT Metals Charts: Weekly Speculator Bets see small gains for Silver & Gold Jul 12, 2026
- COT Bonds Charts: Speculator Bets led by SOFR 3-Months & 2-Year Bonds Jul 12, 2026
- COT Energy Charts: Weekly Speculator Changes led by Brent Oil Jul 12, 2026
- COT Soft Commodities Charts: Weekly Speculator Changes led by Sugar, Corn & Soybeans Jul 12, 2026
- The US and European stock indices are rising again amid renewed investor interest in the AI industry. Jul 10, 2026
- USD/JPY Falls as Yen Recovers Weekly Losses Jul 10, 2026
- Crude oil prices surged sharply by 7% in reaction to the rapid escalation of the conflict in the Middle East Jul 9, 2026
- Middle East Tensions Weigh on Gold Jul 9, 2026
- Pound Awaits Tighter Policy from Bank of England Jul 8, 2026
- The United States carried out airstrikes on Iran after Iran’s attacked tankers in the Strait of Hormuz. The RBNZ raised the interest rate to 2.5% Jul 8, 2026