By Dan Steinbock
In view of the Fed, American banking crisis is over. Yet, US and European banks face the most acute stress since 2008 and 2011, respectively. Global economy is exposed to new headwinds.
Last week, as the Federal Reserve pushed ahead with its 10th rate hike since last March, its chairman Jerome Powell declared that the period of U.S. bank failures had come to an end. That’s why Powell assured Americans, “There were three large banks, really from the very beginning, that were at the heart of the stress that we saw in early March — the severe period of stress. Those have now all been resolved, and all the depositors have been protected.”
In other words, the failures of Silicon Valley Bank, Signature Bank and First Republic Bank mark the end, not the spread of the banking crisis. As Powell added, the most recent failure of First Republic, and its subsequent sale to JPMorgan Chase, “kind of draws a line under that period.”
Obviously, such ideas are plain silly. U.S. banking crisis is not over; it has entered a new stage. And it continues to spread.
As dominoes fall
Nearly half (48%) of Americans are concerned about the safety of their bank deposits, according to a Gallup poll last week. Distressingly, the survey results resemble the aftermath of the Lehman Brothers’ collapse.
Recently, Lawrence McDonald, former vice-president at Lehman Brothers, projected that the banking crisis could derail another 50 regional lenders in America if the US fiscal and monetary authorities fail to take steps to resolve structural challenges.
In the U.S. and European banking sector, the rollercoaster ride began in early March, with three weeks of substantial volatility. First, two major US regional banks (Silicon Valley Bank [SVB] and Signature Bank) failed. Then, one of the 30 global systemically important banks, the Switzerland-based Credit Suisse, lost its autonomy after a government-facilitated takeover by UBS.
In the process, market and depositor confidence dissipated in key parts of the sector, with adverse repercussions in investor and consumer confidence.
To prevent the situation from affecting more banks, global industry regulators – including the Federal Reserve, the Bank of Canada, Bank of England, Bank of Japan, European Central Bank, and Swiss National Bank – were compelled to intervene and provide extraordinary liquidity.
How could it all happen – again?
Bank analysts would say that the lead-up period saw many banks invest their reserves in US Treasury securities. So, when the Fed sharply tightened financial conditions last year to rein in surging inflation, companies found it challenging to raise cash, which triggered deposit outflows.
To meet those outflows, SVB sold its long-term Treasuries at great loss. As a capital raise to cover the losses fell apart, a huge run on deposits ensued leading to the largest bank failure since the 2008 financial crisis. What compounded challenges was several banks’ exposure to the bursting cryptocurrency bubble. These events sparked a broad migration of deposits from the banking sector to money market funds while migrating to global systemically important banks, thus forcing some banks to source liquidity from the Fed – the mistakes of which had compounded the challenges in the first place.
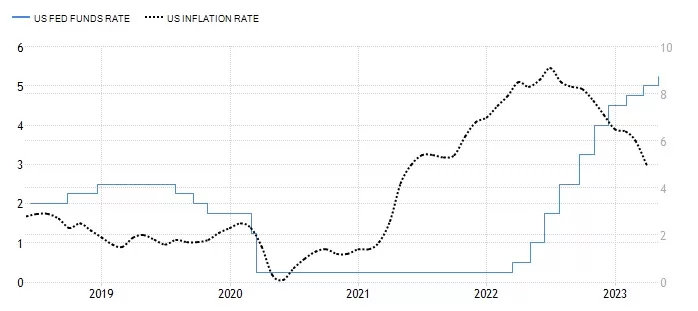
After mid-year 2021, when inflation started to climb rapidly, the Fed shunned a timely response. Instead, its chairman downplayed the threat of soaring prices calling them “transitionary.” The stunning complacency proved costly. By mid-2022, US inflation peaked at 9.1%; a four-decade high. And it remains around 5%, more than twice the 2% target. That’s too why the Fed raised the fed funds rate by 25bps to a range of 5%-5.25% in its May meeting.
If the Fed’s monetary pain wasn’t enough, the White House’s foreign policy has contributed to runaway inflation and elevated uncertainty. After years of trade protectionism, the global pandemic and depression, the net effect of the high-cost US/NATO-led proxy war against Russia in Ukraine has been a lethal mix of a global energy crisis and the meltdown of the global food system.
The spread effects
The elusive calm until the demise of First Republic Bank did not reflect the end of the crisis, but its steady progress. As Mohamed El-Erian, chief economic advisor at Allianz, put it last week. “Now we have stage two, where banks that are not particularly badly managed they have issues but they’re not particularly badly managed – are suddenly vulnerable.” In other words, “the cancer within [these banks] is starting to spread.”
As credit conditions are tightening, the risks of further contraction rise with banking contagion. Structural vulnerabilities remain huge. In parallel with the demise of SVB in March, one consequential study indicated that almost 200 more banks may be vulnerable to the type of risk that caused the collapse of SVB. These banks across the US could fail if half of their depositors quickly withdraw their funds. Even insured depositors — those with $250,000 or less in the bank — could have problems getting their cash if these institutions face the kind of run that SVB experienced.
According to the co-author of the study, a banking expert at Stanford University, half of US lenders are underwater: “Let’s not pretend that this is just about Silicon Valley Bank and First Republic,” he said recently. “A lot of the US banking system is potentially insolvent.” Presumably, some 2,315 banks across the US are currently sitting on assets worth less than their liabilities.
Still worse, the lingering banking crisis occurs at a time, when the White House is engaged in the largest war funding in decades and the Congress has wasted half a year failing to agree on a debt limit.
U.S. default risk as an “economic and financial catastrophe”
A week ago, US Treasury Secretary Janet Yellen warned that the US will run out of cash by June 1 if Congress fails to raise or suspend the debt ceiling. She urged Congress to act “as soon as possible” to address the $31.4 trillion limit. President Biden has called a meeting of congressional leaders on the matter on May 9.
The US hit the statutory limit already last December. Since then, Yellen has repeatedly warned that “failure to raise U.S. debt ceiling would lead to “economic and financial catastrophe.” Unsurprisingly, the Biden administration is under mounting pressure to reconcile the conflicting demands.
Historically, the debt ceiling has been raised, extended or revised 78 times since 1960. If this time is different, it will have significant and adverse global repercussions. If, however, a new debt limit arrangement will be achieved, it can only happen by taking more debt. In this case, Washington will delay its default by buying time, which will make the eventual US debt crisis worse.
The economic fundamentals and safety nets that prevailed in 2008 have been largely exhausted. The West is navigating in perilous waters with leaking lifeboats.
About the Author:
Dr. Dan Steinbock is an internationally recognized strategist of the multipolar world and the founder of Difference Group. He has served at the India, China and America Institute (USA), Shanghai Institutes for International Studies (China) and the EU Center (Singapore). For more, see https://www.differencegroup.net


