COT Speculator Extremes: Peso, 2-Year, 5-Year & SP500 lead weekly Bullish & Bearish Positions

By InvestMacro

The latest update for the weekly Commitment of Traders (COT) report was released by the Commodity Futures Trading Commission (CFTC) on Friday for data ending on May 9th.

This weekly Extreme Positions report highlights the Most Bullish and Most Bearish Positions for the speculator category. Extreme positioning in these markets can foreshadow strong moves in the underlying market.

To signify an extreme position, we use the Strength Index (also known as the COT Index) of each instrument, a common method of measuring COT data. The Strength Index is simply a comparison of current trader positions against the range of positions over the previous 3 years. We use over 80 percent as extremely bullish and under 20 percent as extremely bearish. (Compare Strength Index scores across all markets in the data table or cot leaders table)


Speculators or Non-Commercials Notes:

Speculators, classified as non-commercial traders by the CFTC, are made up of large commodity funds, hedge funds and other significant for-profit participants. The Specs are generally regarded as trend-followers in their behavior towards price action – net speculator bets and prices tend to go in the same directions. These traders often look to buy when prices are rising and sell when prices are falling. To illustrate this point, many times speculator contracts can be found at their most extremes (bullish or bearish) when prices are also close to their highest or lowest levels.

These extreme levels can be dangerous for the large speculators as the trade is most crowded, there is less trading ammunition still sitting on the sidelines to push the trend further and prices have moved a significant distance. When the trend becomes exhausted, some speculators take profits while others look to also exit positions when prices fail to continue in the same direction. This process usually plays out over many months to years and can ultimately create a reverse effect where prices start to fall and speculators start a process of selling when prices are falling.


Here Are This Week’s Most Bullish Speculator Positions:

Mexican Peso


The Mexican Peso speculator position comes in as the most bullish extreme standing this week. The Mexican Peso speculator level is currently at a 100.0 percent score of its 3-year range.

The six-week trend for the percent strength score totaled 15.5 this week. The overall net speculator position was a total of 70,032 net contracts this week with a boost of 12,322 contract in the weekly speculator bets.


Cocoa Futures

The Cocoa Futures speculator position comes next in the extreme standings this week. The Cocoa Futures speculator level is now at a 100.0 percent score of its 3-year range.

The six-week trend for the percent strength score was 1.0 this week. The speculator position registered 62,029 net contracts this week with a weekly rise of 4,078 contracts in speculator bets.


Bloomberg Commodity Index


The Bloomberg Commodity Index speculator position comes in third this week in the extreme standings. The Bloomberg Commodity Index speculator level resides at a 99.4 percent score of its 3-year range.

The six-week trend for the speculator strength score came in at 5.9 this week. The overall speculator position was -2,101 net contracts this week with a change of -82 contracts in the weekly speculator bets.


Sugar


The Sugar speculator position comes up number four in the extreme standings this week. The Sugar speculator level is at a 88.7 percent score of its 3-year range.

The six-week trend for the speculator strength score totaled a change of 19.0 this week. The overall speculator position was 276,610 net contracts this week with a gain of 9,263 contracts in the speculator bets.


Live Cattle

The Live Cattle speculator position rounds out the top five in this week’s bullish extreme standings. The Live Cattle speculator level sits at a 87.8 percent score of its 3-year range. The six-week trend for the speculator strength score was 37.2 this week.

The speculator position was 97,837 net contracts this week with a decline of -6,949 contracts in the weekly speculator bets.


This Week’s Most Bearish Speculator Positions:

5-Year Bond


The 5-Year Bond speculator position comes in as the most bearish extreme standing this week. The 5-Year speculator level is at a 0.0 percent score of its 3-year range.

The six-week trend for the speculator strength score was -22.7 this week. The overall speculator position was -910,642 net contracts this week with a edge lower by -412 contracts in the speculator bets.


S&P500 Mini

The S&P500 Mini speculator position comes in next for the most bearish extreme standing on the week. The S&P500 speculator level is at a 0.0 percent score of its 3-year range.

The six-week trend for the speculator strength score was -24.7 this week. The speculator position was -376,023 net contracts this week with a drop of -20,612 contracts in the weekly speculator bets.


2-Year Bond


The 2-Year Bond speculator position comes in as third most bearish extreme standing of the week. The 2-Year Note speculator level resides at a 0.0 percent score of its 3-year range.

The six-week trend for the speculator strength score was -26.8 this week. The overall speculator position was -749,885 net contracts this week with a sharp decline of -116,409 contracts in the speculator bets.


Lean Hogs

The Lean Hogs speculator position comes in as this week’s fourth most bearish extreme standing. The Lean Hogs speculator level is at a 1.0 percent score of its 3-year range.

The six-week trend for the speculator strength score was -3.6 this week. The speculator position was -26,075 net contracts this week with a decrease of -6,381 contracts in the weekly speculator bets.


Ultra 10-Year U.S. T-Note


Finally, the Ultra 10-Year U.S. T-Note speculator position comes in as the fifth most bearish extreme standing for this week. The Ultra 10-Year speculator level is at a 1.4 percent score of its 3-year range.

The six-week trend for the speculator strength score was -12.2 this week. The speculator position was -211,598 net contracts this week with a change of 6,690 contracts in the weekly speculator bets.


Article By InvestMacroReceive our weekly COT Newsletter

*COT Report: The COT data, released weekly to the public each Friday, is updated through the most recent Tuesday (data is 3 days old) and shows a quick view of how large speculators or non-commercials (for-profit traders) were positioned in the futures markets.

The CFTC categorizes trader positions according to commercial hedgers (traders who use futures contracts for hedging as part of the business), non-commercials (large traders who speculate to realize trading profits) and nonreportable traders (usually small traders/speculators) as well as their open interest (contracts open in the market at time of reporting). See CFTC criteria here.

Bonds Speculators drop 2-Year & 5-Year bets to record lows

By InvestMacro

Here are the latest charts and statistics for the Commitment of Traders (COT) reports data published by the Commodities Futures Trading Commission (CFTC).

The latest COT data is updated through Tuesday May 9th and shows a quick view of how large traders (for-profit speculators and commercial hedgers) were positioned in the futures markets.

Weekly Speculator Changes led by SOFR 3-Months & 10-Year Bonds

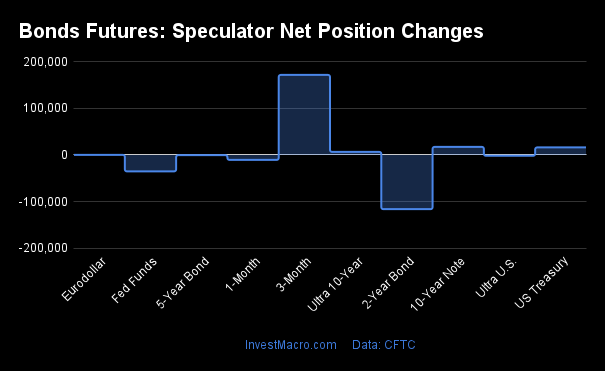
The COT bond market speculator bets were higher this week as five out of the nine bond markets we cover had higher positioning while the other four markets had lower speculator contracts.

Leading the gains for the bond markets was the SOFR 3-Months (172,071 contracts) with the 10-Year Bonds (17,449 contracts), the US Treasury Bonds (16,285 contracts), the Ultra 10-Year Bonds (6,690 contracts) and the Eurodollar (257 contracts) also showing positive weeks.

The bond markets with declines in speculator bets for the week were the 2-Year Bonds (-116,409 contracts), the Fed Funds (-35,180 contracts), the 5-Year Bonds (-412 contracts) and the Ultra Treasury Bonds (-1,713 contracts) also seeing lower bets on the week.

Speculators drop 2-Year and 5-Year Bonds bets to record lows

Highlighting the COT bonds data is this week’s record bearish speculator positioning in both the 2-Year and the 5-Year bonds.

The large speculators in the 2-Year bonds sharply added to their bearish bets for a second straight week this week and for the third time in the past four weeks. Speculators have now added a total of -253,044 contracts to the bearish position over the past four weeks alone. This weakness in sentiment has pushed the overall bearish standing to the highest level on record at a total of -749,885 contracts, according to CFTC data that goes back to 1990. This record bearish position surpassed the previous one that was recently registered on February 14th at a total of -696,686 contracts.

The 5-Year Bond speculator positions have also dropped their bets to a record low position this week and have done so for three straight weeks in succession. The 5-Year speculators have added a whopping -353,430 contracts to their net positions over the past eight weeks. This week’s record bearish position is at a total of -910,642 contracts which is the all-time low dating back to 1988, according to the CFTC.

Despite these all-time lows in both the 2-Year and 5-Years positions, their respective futures prices have not followed lower. The 2-Year futures price closed this week at 103.05 and is almost 2 percent higher than the low that was reached in early March at 101.09. Meanwhile, the 5-Year futures price closed at 110.01 this week and is approximately 4.35 percent higher than the low that was hit in October at 105.14. Overall in the longer view, the 5-Year price is down by approximately 13 percent from the highs of 2021 while the 2-Year prices are down by about 6.5 percent from 2021.

The outlook for both of these bonds will depend very much on the path forward for the benchmark interest rate controlled by the US Federal Reserve and how the economy evolves. The latest forecast for the next Fed meeting shows a high likelihood of an interest rate pause (almost 85 percent per the CME Fed tool). This pause would be a positive for bond prices while if an economic recession does take place, bond prices would likely be a place for safe haven investments. A recession could also prompt a Fed interest rate cut (bond price positive). However, further upside in inflation and followed by more Fed hikes would be a negative for bonds. The US debt ceiling is also an outlier risk event coming up that needs to be kept in mind as well.
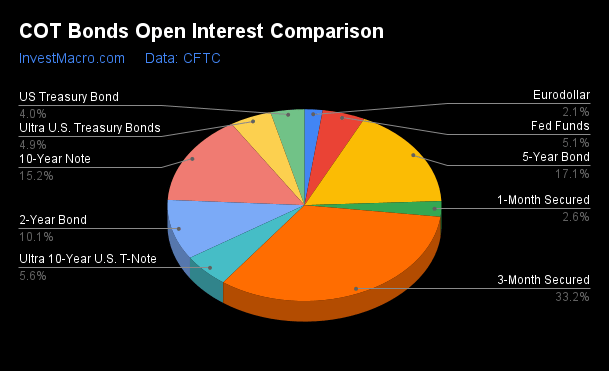

Data Snapshot of Bond Market Traders | Columns Legend
May-09-2023OIOI-IndexSpec-NetSpec-IndexCom-NetCOM-IndexSmalls-NetSmalls-Index
Eurodollar632,2420-55,1107358,41423-3,30499
FedFunds1,502,28147-75,31730104,07073-28,75335
2-Year3,007,292100-749,8850681,29110068,59489
Long T-Bond1,189,41454-73,129612,3551170,774100
10-Year4,510,018100-731,6982641,5959090,103100
5-Year5,086,319100-910,6420872,3029938,34092


Strength Scores led by Eurodollar & US Treasury Bonds

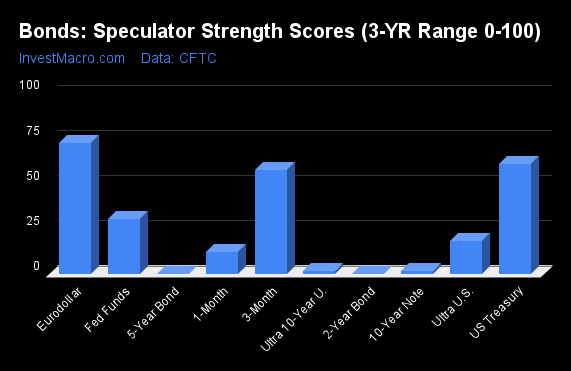
COT Strength Scores (a normalized measure of Speculator positions over a 3-Year range, from 0 to 100 where above 80 is Extreme-Bullish and below 20 is Extreme-Bearish) showed that the Eurodollar (73 percent) and the US Treasury Bonds (61 percent) lead the bond markets this week. The SOFR 3-Months (58 percent) comes in as the next highest in the weekly strength scores.

On the downside, the 5-Year Bonds (0 percent), the 2-Year Bonds (0 percent), the Ultra 10-Year Bonds (1 percent), the 10-Year Bonds (2 percent) and the Ultra US Treasury Bond (18.5 percent) come in at the lowest strength levels currently and are all in Extreme-Bearish territory (below 20 percent).

Strength Statistics:
Fed Funds (30.3 percent) vs Fed Funds previous week (34.7 percent)
2-Year Bond (0.0 percent) vs 2-Year Bond previous week (13.9 percent)
5-Year Bond (0.0 percent) vs 5-Year Bond previous week (0.0 percent)
10-Year Bond (1.9 percent) vs 10-Year Bond previous week (0.0 percent)
Ultra 10-Year Bond (1.4 percent) vs Ultra 10-Year Bond previous week (0.0 percent)
US Treasury Bond (60.8 percent) vs US Treasury Bond previous week (55.5 percent)
Ultra US Treasury Bond (18.5 percent) vs Ultra US Treasury Bond previous week (19.2 percent)
Eurodollar (72.6 percent) vs Eurodollar previous week (72.6 percent)
SOFR 3-Months (57.8 percent) vs SOFR 3-Months previous week (43.9 percent)


Eurodollar & Fed Funds top the 6-Week Strength Trends

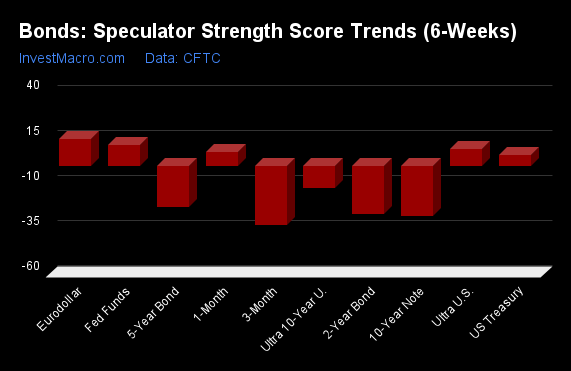
COT Strength Score Trends (or move index, calculates the 6-week changes in strength scores) showed that the Eurodollar (15 percent) and the Fed Funds (12 percent) lead the past six weeks trends for bonds. The Ultra Treasury Bonds (9 percent) and the US Treasury Bond (6 percent) are the next positive movers in the latest trends data.

The SOFR 3-Months (-33 percent) and the 10-Year Bonds (-28 percent) lead the downside trend scores currently with the 2-Year Bonds (-27 percent) and the 5-Year Bonds (-23 percent) following next with lower trend scores.

Strength Trend Statistics:
Fed Funds (11.5 percent) vs Fed Funds previous week (-1.9 percent)
2-Year Bond (-26.8 percent) vs 2-Year Bond previous week (-20.2 percent)
5-Year Bond (-22.7 percent) vs 5-Year Bond previous week (-27.7 percent)
10-Year Bond (-28.0 percent) vs 10-Year Bond previous week (-19.1 percent)
Ultra 10-Year Bond (-12.2 percent) vs Ultra 10-Year Bond previous week (-12.2 percent)
US Treasury Bond (5.9 percent) vs US Treasury Bond previous week (3.3 percent)
Ultra US Treasury Bond (9.0 percent) vs Ultra US Treasury Bond previous week (19.2 percent)
Eurodollar (14.7 percent) vs Eurodollar previous week (14.9 percent)
SOFR 3-Months (-32.9 percent) vs SOFR 3-Months previous week (-43.9 percent)


Individual Bond Markets:

3-Month Eurodollars Futures:

Eurodollar Bonds Futures COT Chart
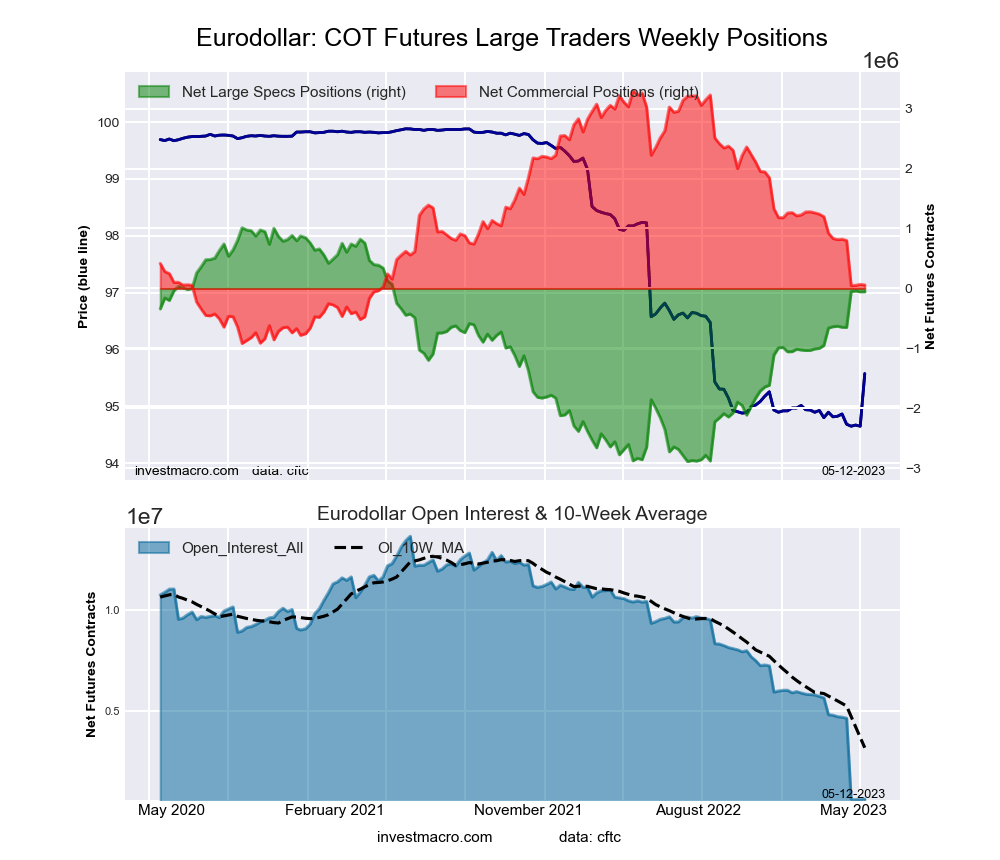
The 3-Month Eurodollars large speculator standing this week resulted in a net position of -55,110 contracts in the data reported through Tuesday. This was a weekly advance of 257 contracts from the previous week which had a total of -55,367 net contracts.

This week’s current strength score (the trader positioning range over the past three years, measured from 0 to 100) shows the speculators are currently Bullish with a score of 72.6 percent. The commercials are Bearish with a score of 23.1 percent and the small traders (not shown in chart) are Bullish-Extreme with a score of 98.5 percent.

3-Month Eurodollars StatisticsSPECULATORSCOMMERCIALSSMALL TRADERS
– Percent of Open Interest Longs:24.963.210.5
– Percent of Open Interest Shorts:33.653.911.1
– Net Position:-55,11058,414-3,304
– Gross Longs:157,203399,29766,638
– Gross Shorts:212,313340,88369,942
– Long to Short Ratio:0.7 to 11.2 to 11.0 to 1
NET POSITION TREND:
– Strength Index Score (3 Year Range Pct):72.623.198.5
– Strength Index Reading (3 Year Range):BullishBearishBullish-Extreme
NET POSITION MOVEMENT INDEX:
– 6-Week Change in Strength Index:14.7-18.038.2


Secured Overnight Financing Rate (3-Month) Futures:

SOFR 3-Months Bonds Futures COT Chart
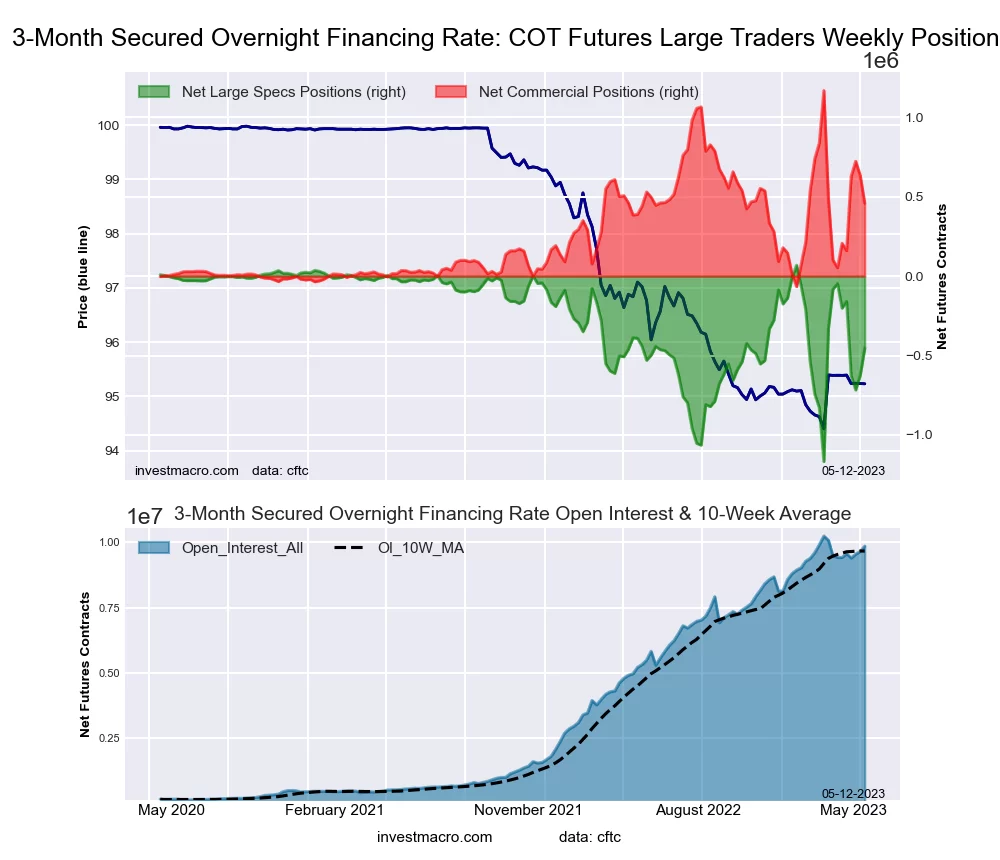
The Secured Overnight Financing Rate (3-Month) large speculator standing this week resulted in a net position of -452,828 contracts in the data reported through Tuesday. This was a weekly advance of 172,071 contracts from the previous week which had a total of -624,899 net contracts.

This week’s current strength score (the trader positioning range over the past three years, measured from 0 to 100) shows the speculators are currently Bullish with a score of 57.8 percent. The commercials are Bearish with a score of 42.5 percent and the small traders (not shown in chart) are Bullish-Extreme with a score of 85.3 percent.

SOFR 3-Months StatisticsSPECULATORSCOMMERCIALSSMALL TRADERS
– Percent of Open Interest Longs:14.362.70.4
– Percent of Open Interest Shorts:18.958.10.5
– Net Position:-452,828457,566-4,738
– Gross Longs:1,408,6336,178,97642,103
– Gross Shorts:1,861,4615,721,41046,841
– Long to Short Ratio:0.8 to 11.1 to 10.9 to 1
NET POSITION TREND:
– Strength Index Score (3 Year Range Pct):57.842.585.3
– Strength Index Reading (3 Year Range):BullishBearishBullish-Extreme
NET POSITION MOVEMENT INDEX:
– 6-Week Change in Strength Index:-32.932.80.3


30-Day Federal Funds Futures:

Federal Funds 30-Day Bonds Futures COT Chart
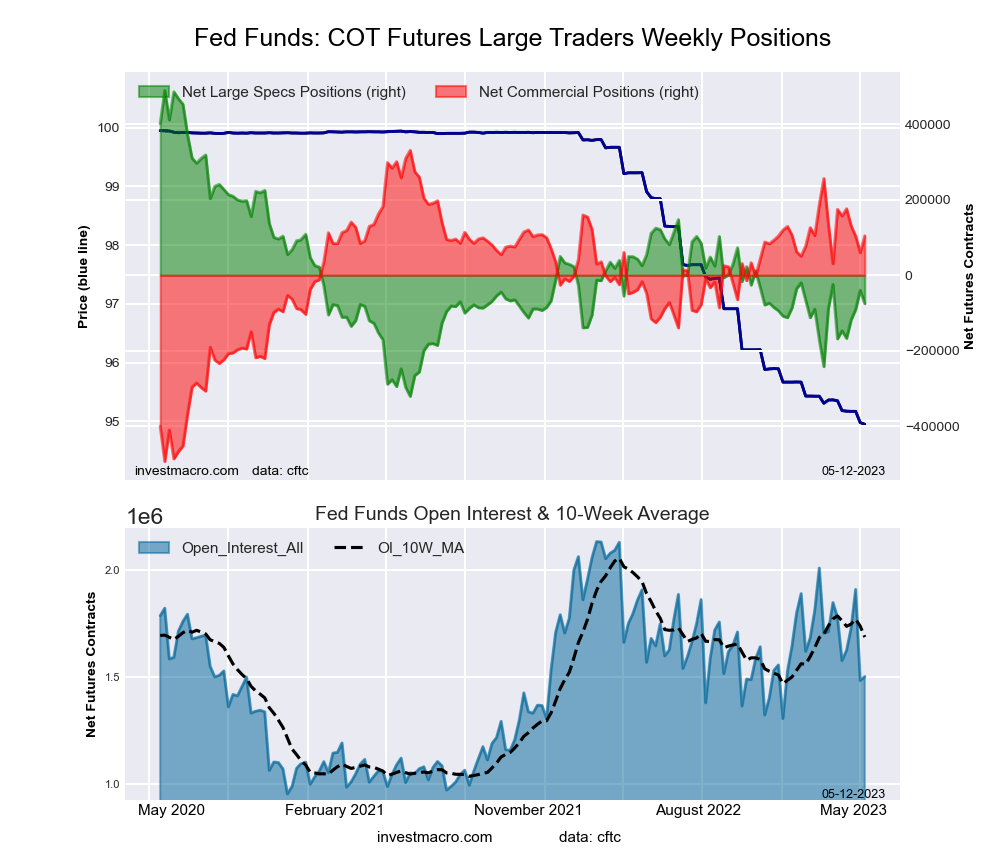
The 30-Day Federal Funds large speculator standing this week resulted in a net position of -75,317 contracts in the data reported through Tuesday. This was a weekly fall of -35,180 contracts from the previous week which had a total of -40,137 net contracts.

This week’s current strength score (the trader positioning range over the past three years, measured from 0 to 100) shows the speculators are currently Bearish with a score of 30.3 percent. The commercials are Bullish with a score of 72.5 percent and the small traders (not shown in chart) are Bearish with a score of 34.6 percent.

30-Day Federal Funds StatisticsSPECULATORSCOMMERCIALSSMALL TRADERS
– Percent of Open Interest Longs:4.078.42.3
– Percent of Open Interest Shorts:9.071.54.2
– Net Position:-75,317104,070-28,753
– Gross Longs:59,3671,178,44734,793
– Gross Shorts:134,6841,074,37763,546
– Long to Short Ratio:0.4 to 11.1 to 10.5 to 1
NET POSITION TREND:
– Strength Index Score (3 Year Range Pct):30.372.534.6
– Strength Index Reading (3 Year Range):BearishBullishBearish
NET POSITION MOVEMENT INDEX:
– 6-Week Change in Strength Index:11.5-8.5-45.8


2-Year Treasury Note Futures:

2-Year Treasury Bonds Futures COT Chart
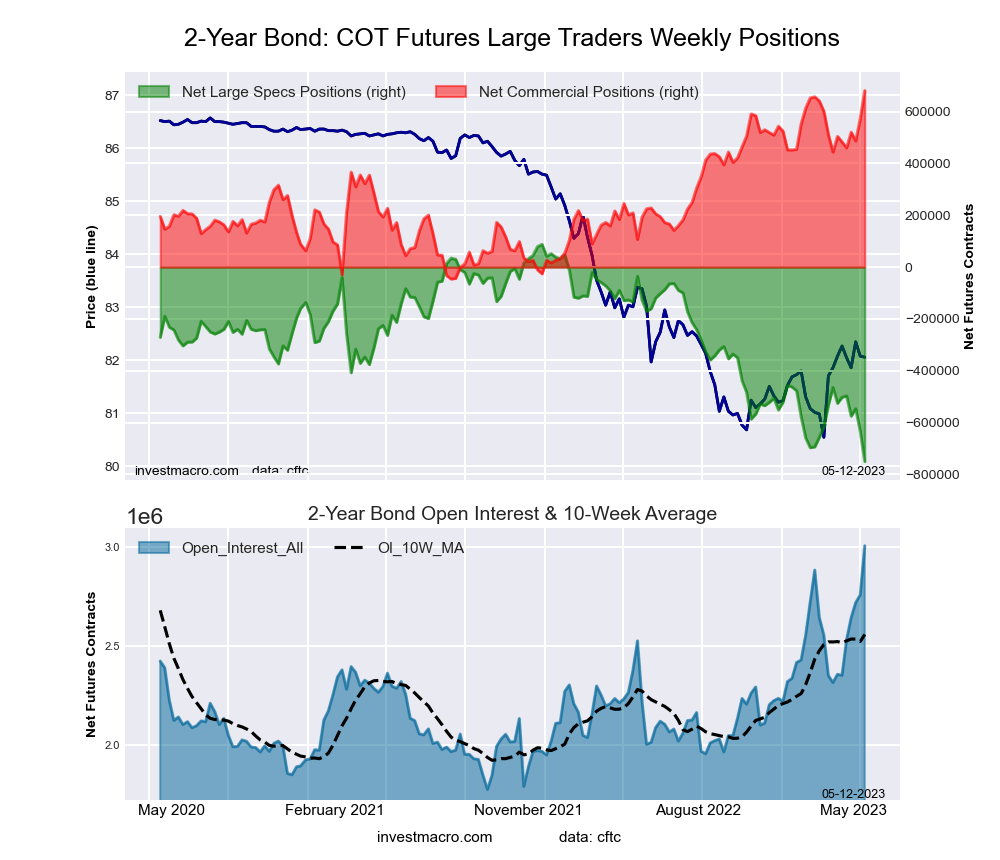
The 2-Year Treasury Note large speculator standing this week resulted in a net position of -749,885 contracts in the data reported through Tuesday. This was a weekly lowering of -116,409 contracts from the previous week which had a total of -633,476 net contracts.

This week’s current strength score (the trader positioning range over the past three years, measured from 0 to 100) shows the speculators are currently Bearish-Extreme with a score of 0.0 percent. The commercials are Bullish-Extreme with a score of 100.0 percent and the small traders (not shown in chart) are Bullish-Extreme with a score of 88.7 percent.

2-Year Treasury Note StatisticsSPECULATORSCOMMERCIALSSMALL TRADERS
– Percent of Open Interest Longs:8.882.87.4
– Percent of Open Interest Shorts:33.860.25.1
– Net Position:-749,885681,29168,594
– Gross Longs:266,0702,490,414221,650
– Gross Shorts:1,015,9551,809,123153,056
– Long to Short Ratio:0.3 to 11.4 to 11.4 to 1
NET POSITION TREND:
– Strength Index Score (3 Year Range Pct):0.0100.088.7
– Strength Index Reading (3 Year Range):Bearish-ExtremeBullish-ExtremeBullish-Extreme
NET POSITION MOVEMENT INDEX:
– 6-Week Change in Strength Index:-26.824.322.7


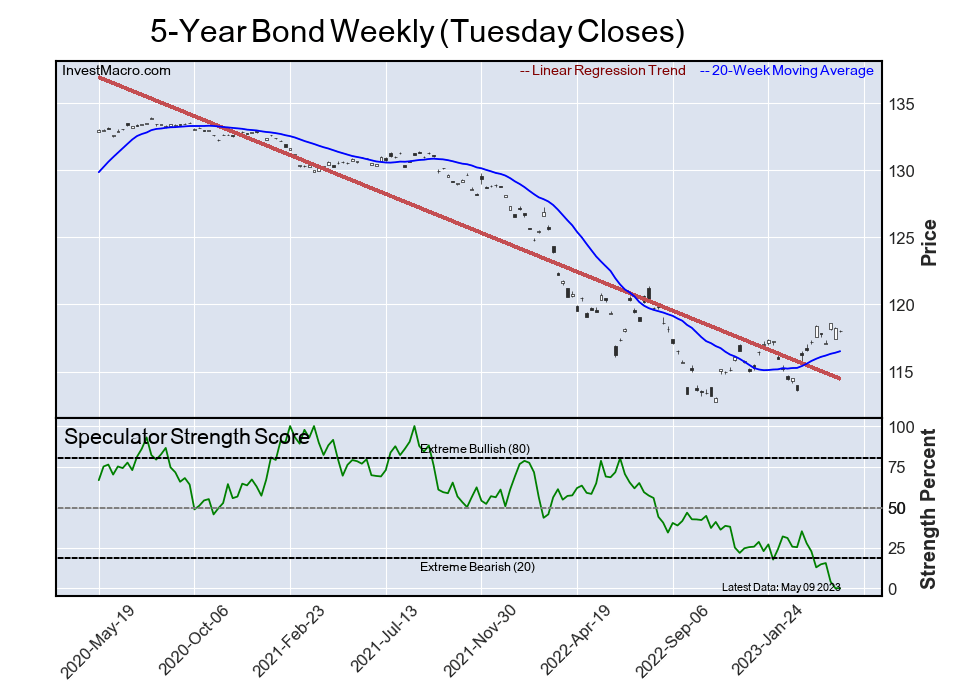
5-Year Treasury Note Futures:

5-Year Treasury Bonds Futures COT Chart
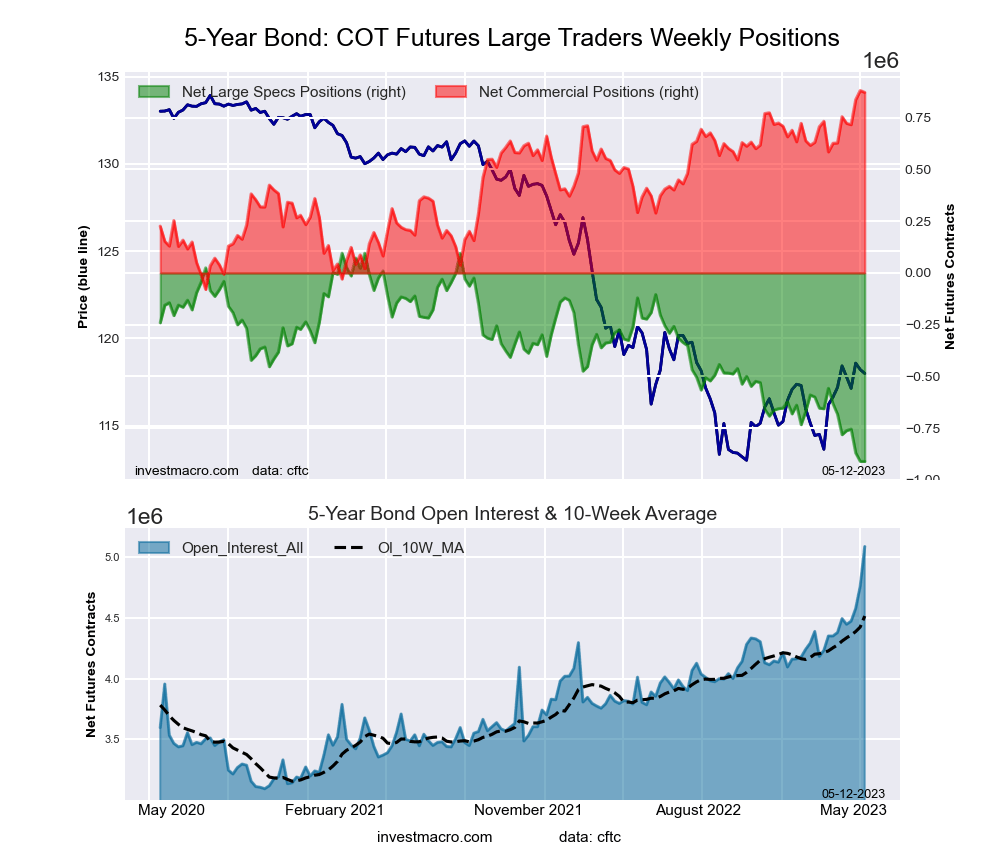
The 5-Year Treasury Note large speculator standing this week resulted in a net position of -910,642 contracts in the data reported through Tuesday. This was a weekly reduction of -412 contracts from the previous week which had a total of -910,230 net contracts.

This week’s current strength score (the trader positioning range over the past three years, measured from 0 to 100) shows the speculators are currently Bearish-Extreme with a score of 0.0 percent. The commercials are Bullish-Extreme with a score of 99.1 percent and the small traders (not shown in chart) are Bullish-Extreme with a score of 91.5 percent.

5-Year Treasury Note StatisticsSPECULATORSCOMMERCIALSSMALL TRADERS
– Percent of Open Interest Longs:9.481.57.1
– Percent of Open Interest Shorts:27.364.46.3
– Net Position:-910,642872,30238,340
– Gross Longs:477,7674,146,935361,166
– Gross Shorts:1,388,4093,274,633322,826
– Long to Short Ratio:0.3 to 11.3 to 11.1 to 1
NET POSITION TREND:
– Strength Index Score (3 Year Range Pct):0.099.191.5
– Strength Index Reading (3 Year Range):Bearish-ExtremeBullish-ExtremeBullish-Extreme
NET POSITION MOVEMENT INDEX:
– 6-Week Change in Strength Index:-22.725.4-4.3


10-Year Treasury Note Futures:

10-Year Treasury Notes Bonds Futures COT Chart
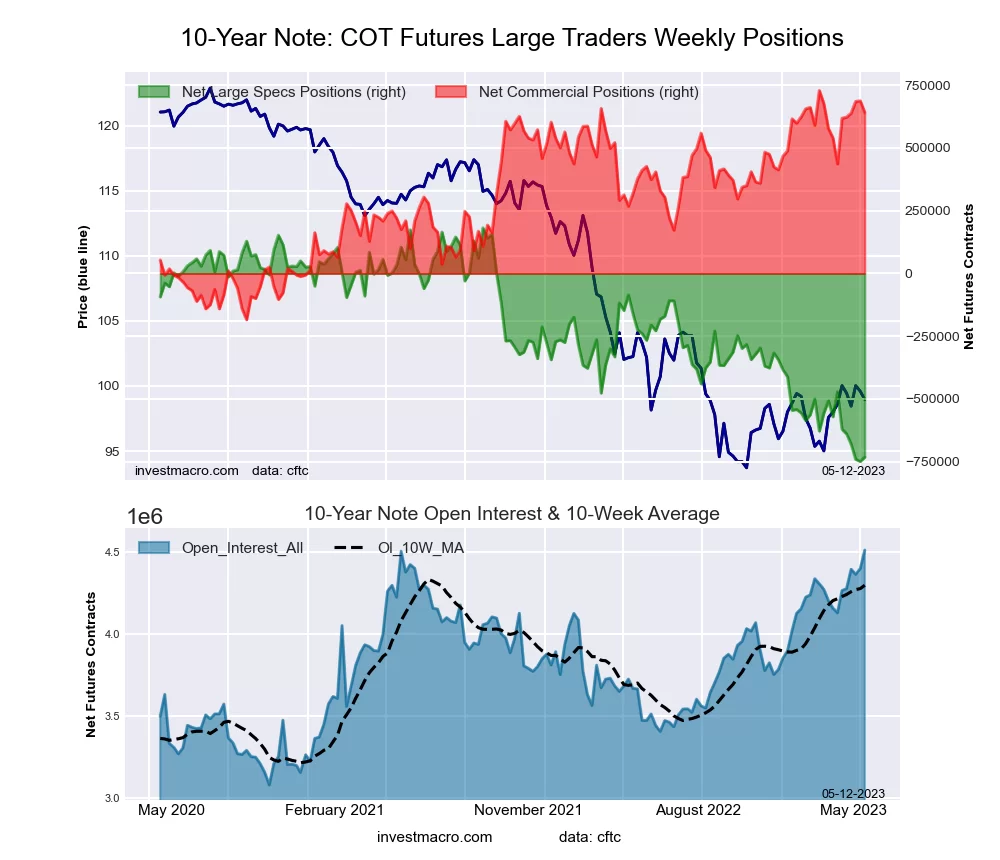
The 10-Year Treasury Note large speculator standing this week resulted in a net position of -731,698 contracts in the data reported through Tuesday. This was a weekly rise of 17,449 contracts from the previous week which had a total of -749,147 net contracts.

This week’s current strength score (the trader positioning range over the past three years, measured from 0 to 100) shows the speculators are currently Bearish-Extreme with a score of 1.9 percent. The commercials are Bullish-Extreme with a score of 90.4 percent and the small traders (not shown in chart) are Bullish-Extreme with a score of 100.0 percent.

10-Year Treasury Note StatisticsSPECULATORSCOMMERCIALSSMALL TRADERS
– Percent of Open Interest Longs:10.078.19.4
– Percent of Open Interest Shorts:26.363.97.4
– Net Position:-731,698641,59590,103
– Gross Longs:453,0773,522,275425,427
– Gross Shorts:1,184,7752,880,680335,324
– Long to Short Ratio:0.4 to 11.2 to 11.3 to 1
NET POSITION TREND:
– Strength Index Score (3 Year Range Pct):1.990.4100.0
– Strength Index Reading (3 Year Range):Bearish-ExtremeBullish-ExtremeBullish-Extreme
NET POSITION MOVEMENT INDEX:
– 6-Week Change in Strength Index:-28.022.512.9


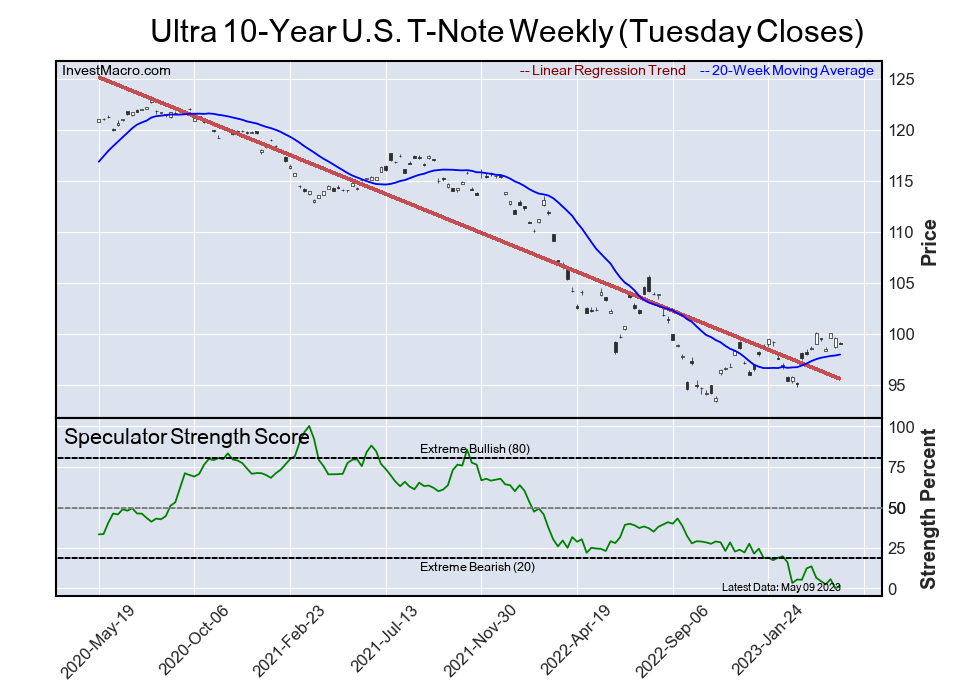
Ultra 10-Year Notes Futures:

Ultra 10-Year Treasury Notes Bonds Futures COT Chart
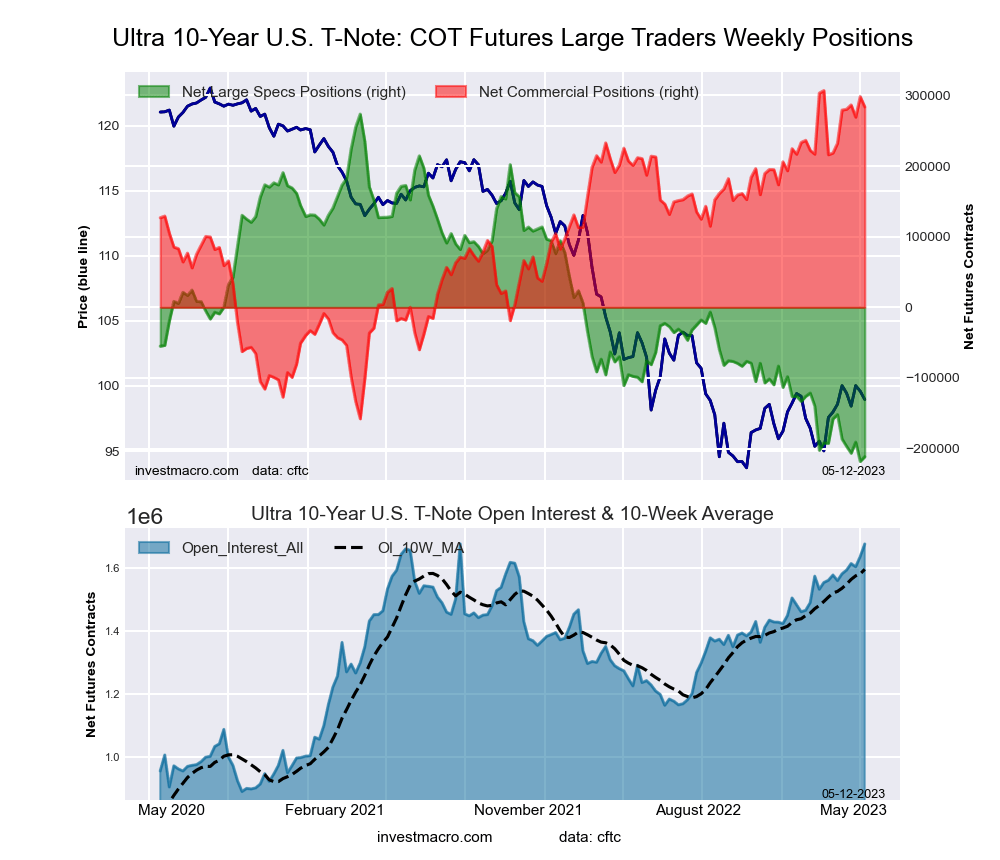
The Ultra 10-Year Notes large speculator standing this week resulted in a net position of -211,598 contracts in the data reported through Tuesday. This was a weekly advance of 6,690 contracts from the previous week which had a total of -218,288 net contracts.

This week’s current strength score (the trader positioning range over the past three years, measured from 0 to 100) shows the speculators are currently Bearish-Extreme with a score of 1.4 percent. The commercials are Bullish-Extreme with a score of 95.0 percent and the small traders (not shown in chart) are Bullish with a score of 71.1 percent.

Ultra 10-Year Notes StatisticsSPECULATORSCOMMERCIALSSMALL TRADERS
– Percent of Open Interest Longs:9.279.210.1
– Percent of Open Interest Shorts:21.962.214.4
– Net Position:-211,598283,856-72,258
– Gross Longs:154,3581,326,293169,295
– Gross Shorts:365,9561,042,437241,553
– Long to Short Ratio:0.4 to 11.3 to 10.7 to 1
NET POSITION TREND:
– Strength Index Score (3 Year Range Pct):1.495.071.1
– Strength Index Reading (3 Year Range):Bearish-ExtremeBullish-ExtremeBullish
NET POSITION MOVEMENT INDEX:
– 6-Week Change in Strength Index:-12.211.14.9


US Treasury Bonds Futures:

US Year Treasury Notes Long Bonds Futures COT Chart
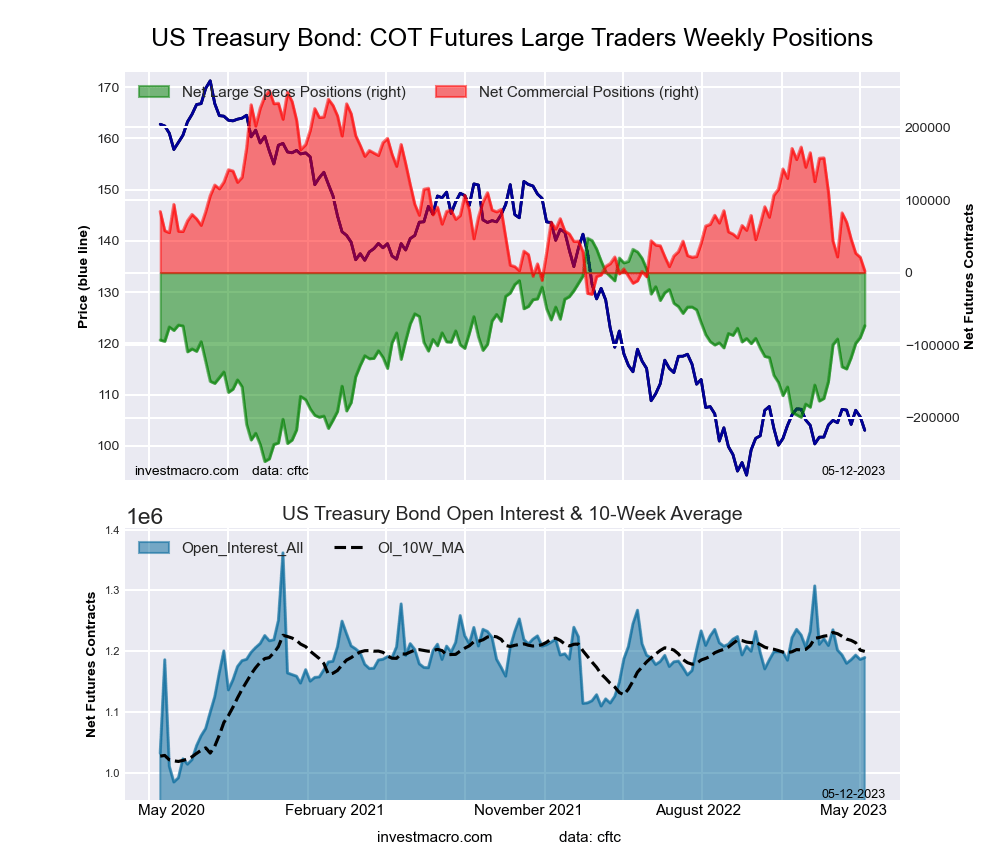
The US Treasury Bonds large speculator standing this week resulted in a net position of -73,129 contracts in the data reported through Tuesday. This was a weekly increase of 16,285 contracts from the previous week which had a total of -89,414 net contracts.

This week’s current strength score (the trader positioning range over the past three years, measured from 0 to 100) shows the speculators are currently Bullish with a score of 60.8 percent. The commercials are Bearish-Extreme with a score of 11.4 percent and the small traders (not shown in chart) are Bullish-Extreme with a score of 100.0 percent.

US Treasury Bonds StatisticsSPECULATORSCOMMERCIALSSMALL TRADERS
– Percent of Open Interest Longs:6.576.815.4
– Percent of Open Interest Shorts:12.676.69.4
– Net Position:-73,1292,35570,774
– Gross Longs:76,938913,035182,961
– Gross Shorts:150,067910,680112,187
– Long to Short Ratio:0.5 to 11.0 to 11.6 to 1
NET POSITION TREND:
– Strength Index Score (3 Year Range Pct):60.811.4100.0
– Strength Index Reading (3 Year Range):BullishBearish-ExtremeBullish-Extreme
NET POSITION MOVEMENT INDEX:
– 6-Week Change in Strength Index:5.9-6.90.8


Ultra US Treasury Bonds Futures:

Ultra US Year Treasury Notes Long Bonds Futures COT Chart
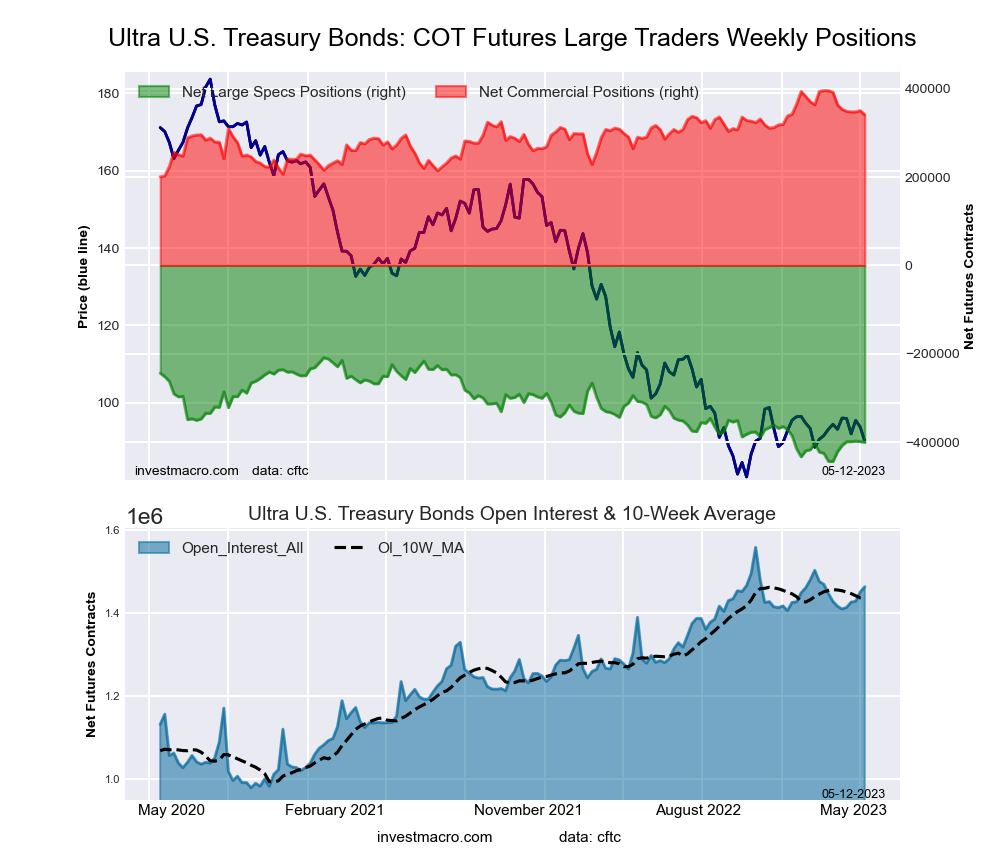
The Ultra US Treasury Bonds large speculator standing this week resulted in a net position of -400,519 contracts in the data reported through Tuesday. This was a weekly decrease of -1,713 contracts from the previous week which had a total of -398,806 net contracts.

This week’s current strength score (the trader positioning range over the past three years, measured from 0 to 100) shows the speculators are currently Bearish-Extreme with a score of 18.5 percent. The commercials are Bullish with a score of 71.9 percent and the small traders (not shown in chart) are Bullish-Extreme with a score of 99.4 percent.

Ultra US Treasury Bonds StatisticsSPECULATORSCOMMERCIALSSMALL TRADERS
– Percent of Open Interest Longs:6.181.312.2
– Percent of Open Interest Shorts:33.558.08.1
– Net Position:-400,519340,88159,638
– Gross Longs:89,7061,188,568178,139
– Gross Shorts:490,225847,687118,501
– Long to Short Ratio:0.2 to 11.4 to 11.5 to 1
NET POSITION TREND:
– Strength Index Score (3 Year Range Pct):18.571.999.4
– Strength Index Reading (3 Year Range):Bearish-ExtremeBullishBullish-Extreme
NET POSITION MOVEMENT INDEX:
– 6-Week Change in Strength Index:9.0-11.71.6


Article By InvestMacroReceive our weekly COT Newsletter

*COT Report: The COT data, released weekly to the public each Friday, is updated through the most recent Tuesday (data is 3 days old) and shows a quick view of how large speculators or non-commercials (for-profit traders) were positioned in the futures markets.

The CFTC categorizes trader positions according to commercial hedgers (traders who use futures contracts for hedging as part of the business), non-commercials (large traders who speculate to realize trading profits) and nonreportable traders (usually small traders/speculators) as well as their open interest (contracts open in the market at time of reporting). See CFTC criteria here.

The cryptocurrency market digest (BTC, ETH, PEPE). Overview for 12.05.2023

By RoboForex.com

BTC has fallen to 26,323 USD by Friday. The weekly loss is currently 9.55%.

So, the market has passed below important support at 26,500 USD. What’s next? Next, we should all be cautious because it seems that buyers have not put much effort into defending this support. Exchanges closed long positions in BTC at 21.6m USD the day before and at least another 18.4m USD today.

If Friday closes the BTC below 26,500 USD, the nearest target for the bears will be at 23,600 USD.

The cryptocurrency market capitalisation has fallen to 1.100 trillion USD by today. The share of BTC on the floor fell to 46.3%, while the share of ETH rose to 19.6%.

Ethereum blockchain crashes

Yesterday, the Ethereum cryptocurrency network experienced a glitch that caused transactions to stop being validated. The pause lasted about 25 minutes, after which the blockchain returned to processing transactions as normal.

The PEPE token dropped 60% from its peak

The PEPE meme token lost about 60% of its peak value recorded on 5 May. The coin’s capitalisation fell to 790 million USD from 1.8 billion USD previously. Still, compared to the price on 18 April, the token is worth almost 3,000% more.

Article By RoboForex.com

Attention!
Forecasts presented in this section only reflect the author’s private opinion and should not be considered as guidance for trading. RoboForex LP bears no responsibility for trading results based on trading recommendations described in these analytical reviews.

Week Ahead: 3 Reasons To Watch USDJPY

By ForexTime 

The Japanese Yen has appreciated against every single G10 currency since the start of May, with the USDJPY dropping over 1% month-to-date.

But before we take a deep dive into what forces may boost or weaken the yen, let’s have a glance at the list of key economic reports and events that could influence currency markets next week:

Monday, May 15

  • EUR: Eurozone industrial production
  • JPY: Japan April PPI
  • USD: Empire Manufacturing, Atlanta Fed President Raphael Bostic speech
  • GBP: Bank of England chief economist Huw Pill speech

Tuesday, May 16

  • CAD: Canada April CPI
  • CNY: China retail sales, industrial production
  • EUR: Eurozone Q1 GDP, Germany ZEW survey expectations
  • GBP: UK jobless claims, unemployment
  • USD: US April retail sales, industrial production, Fed speech

Wednesday, May 17

  • EUR: Eurozone April CPI
  • JPY: Japan Q1 GDP, Industrial production
  • GBP: BoE Governor Andrew Bailey speech

Thursday, May 18  

  • AUD: Unemployment change
  • USD: Initial jobless claims, existing home sales

Friday, May 19  

  • CAD: Canada March retail sales
  • JPY: Japan April CPI
  • EUR: ECB President Christine Lagarde speech
  • USD: New York Fed President John Williams speech
  • G7 leaders meet in Hiroshima

Now, here are 3 reasons why we’re keeping a close eye on the USDJPY:

  1. Top tier Japan data

The new Bank of Japan (BoJ) Governor Kazuo Ueda recently mentioned that the BoJ would start unwinding its monetary easing once the 2% inflation target can be achieved in a sustainable and stable manner.

This could add more flavour to the incoming data, with any whiff or hint of a potential policy pivot in the future rocking FX markets. It may be wise to keep a close eye on:

  • Japan Q1 2023 GDP report due on Wednesday, 17th May.

Markets are forecasting GDP to expand 0.8% quarter on quarter in annualized terms, up from a 0.1% expansion in the final quarter of 2022. A report that meets or exceeds expectations could boost confidence in Japan’s economic recovery, providing an argument for the BoJ to evaluate and potentially tweak its current stimulus policy. However, a disappointing GDP print could provide more evidence that the current recovery remains weak, keeping BoJ doves in power.

  • Japan April CPI report due on Friday, May 19th

The annual inflation is expected to expand to 3.5% in April from the 3.2% witnessed in the previous month. Regarding the core CPI excluding fresh food, this is expected to jump 3.4% year-on-year, up from the 3.1% rise in March.  Looking at the core CPI excluding both fresh food and energy, markets are forecasting this to rise 4.2%, a noticeable rise from the 3.8% in the prior month.

Ultimately, more signs of rising inflationary pressures could fuel speculation around the BoJ unwinding its ultra-loose monetary policy. Traders are currently pricing in a 72% probability of a 10-basis point hike by the December BoJ meeting, it will be interesting to see how the incoming data influences expectations.

  1. More clues about the Fed’s next move

Investors will be keeping an eye on fresh clues on the Fed’s next move, especially after the annual increase in US inflation slowed to below 5% in April for the first time in two years.

  • Fed speeches

A chorus of Fed speakers will be under the spotlight ranging from Rachael Bostic, to Loretta Mester and John Williams among others. With annual US inflation cooling, it will be interesting to hear what policymakers have to say. Any dovish remarks and more hints of the Fed pausing hikes could weaken the dollar, dragging the USDJPY lower.

  • US data cocktail

Much attention will be directed towards the latest US retail sales, industrial production and US weekly initial jobless claims, especially after the Fed stressed that incoming data would influence monetary policy decisions. A disappointing set of reports may further dampen confidence over the US economy and support expectations around the Fed cutting rates down the road. If the figures print above market forecasts, it may rekindle speculation around the Fed keeping rates higher for longer.

  1. Major USDJPY breakout on the horizon

The USDJPY remains trapped within a 200-pip range on the daily charts.

Although prices seem to be respecting a bullish channel, a fresh fundamental spark is needed before the trend resumes or reverses. A strong breakout and daily close above 135.50 could open a path toward major resistance around the 137.80/138.00 regions. Should prices slip below the 133.50 support, the USDJPY could tumble towards 132.90 and 131.20, respectively.

At the time of writing Bloomberg’s FX model forecasts a 73% chance that USDJPY will trade within the 132.84 – 136.40 range over the upcoming week.

Zooming out to the monthly timeframe, strong resistance can be found at 138.00 and support at 130.00. A move back below 133.50 could signal a decline toward 130.00 and 127.20, respectively. Should 138.00 prove to be unreliable resistance, this could signal an incline back toward 149.00 in the medium to longer term.


Forex-Time-LogoArticle by ForexTime

ForexTime Ltd (FXTM) is an award winning international online forex broker regulated by CySEC 185/12 www.forextime.com

The US stock indices remain under pressure. The Bank of England and the ECB intend to raise interest rates further

By JustMarkets

At the close of trading yesterday, the Dow Jones Index (US30) decreased by 0.66%, while the S&P 500 (US500) fell by 0.17%. Technology Index NASDAQ (US100) gained 0.18% on Thursday. The US indices continued to decline yesterday due to ongoing problems at regional banks. PacWest Bancorp shares fell by 22% after reports that the bank’s deposits decreased by 9.5% in the week ended May 5, continuing fears of a deeper banking crisis.

Alphabet (GOOGL) rose for the second straight day as the tech giant’s announcement that it will incorporate artificial intelligence into products, including its search engine, drew positive reactions from investors. Falling Treasury bond yields are also supporting growth in those stocks. Shares of Robinhood Markets Inc (HOOD) were up by 6% on the report. The company reported first-quarter results that beat Wall Street estimates, driven by higher earnings from securities lending.

Deutsche Bank said it would buy Disney stock, expecting cost-cutting, growth in streaming advertising, and the company’s strong position in consumer-focused pricing to support profitability over the long term.

The US Treasury Secretary Janet Yellen urged Congress to raise the $31.4 trillion federal debt limit and prevent an unprecedented default that would trigger a global economic slowdown. For its part, the International Monetary Fund said Thursday that a US debt default triggered by a failure to raise the nation’s debt ceiling would have “very serious consequences” for the US economy as well as the global economy, including a likely increase in borrowing costs.

Equity markets in Europe traded flat Thursday. Germany’s DAX (DE30) fell by 0.39%, France’s CAC 40 (FR40) gained 0.28% yesterday, Spain’s IBEX 35 (ES35) added 0.19%, Britain’s FTSE 100 (UK100) closed lower by 0.14% Thursday.

European Central Bank Vice President Luis de Guindos on Thursday cited rising services prices as the main problem in the ECB’s fight against inflation, saying higher wages caused the price hikes. Markets expect another 25 basis point increase at the ECB’s June meeting and possibly another by late summer, followed by a rate cut early next year.

The Bank of England expectedly to raise its key interest rate by 0.25% to 4.5%. Governor Andrew Bailey said the British central bank would continue to “stay the course” as the BoE seeks to curb high inflation in the economy. The Bank of England raised its inflation forecast for the end of 2023 from 3.92% to 5.12% but is no longer forecasting a recession. Analysts are predicting further rate hikes from the BoE, with a final rate level of 5% this fall.

The US dollar rose to its highest level since May 1 against a basket of major currencies after US jobless claims data bolstered the case for the Federal Reserve to stop raising interest rates. A stronger dollar makes oil more expensive globally. Higher interest rates can put pressure on oil demand by raising borrowing costs and putting pressure on economic growth. Oil prices were down 2% yesterday.

Asian markets were mostly down yesterday. Japan’s Nikkei 225 (JP225) increased by 0.02% for the day, China’s FTSE China A50 (CHA50) was down 0.12%, Hong Kong’s Hang Seng (HK50) fell by 0.09% for the day, India’s NIFTY 50 (IND50) was down 0.10%, and Australia’s S&P/ASX 200 (AU200) closed negative 0.05%.

The Nikkei 225 Index (JP225) outperformed other Asian indices thanks to a series of strong reports from automakers Nissan Motor and Honda Motor, which rose 4% and 5%, respectively, but shares of investment giant SoftBank Group Corp. fell by 3% after the bank posted its second straight year of losses. Strong earnings growth in Japan suggests that the economy’s headwinds of slowing growth and high inflation have so far had a limited impact on corporate earnings, indicating that the Japanese economy is still performing steadily. The Nikkei has also been supported by recent signals from the Bank of Japan to maintain its ultra-soft monetary policy.

S&P 500 (F) (US500) 4,130.62 −7.02 (−0.17%)

Dow Jones (US30)33,309.51 −221.82 (−0.66%)

DAX (DE40) 15,834.91 −61.32 (−0.39%)

FTSE 100 (UK100) 7,730.58 −10.75 (−0.14%)

USD Index 102.06 +0.59 (+0.59%)

Important events for today:
  • – New Zealand Inflation Expectations (q/q) at 06:00 (GMT+3);
  • – UK GDP (m/m) at 09:00 (GMT+3);
  • – UK Industrial Production (m/m) at 09:00 (GMT+3);
  • – UK Manufacturing Production (m/m) at 09:00 (GMT+3);
  • – Eurozone French Consumer Price Index (m/m) at 09:45 (GMT+3);
  • – Eurozone Spanish Consumer Price Index (m/m) at 10:00 (GMT+3);
  • – US Michigan Consumer Sentiment (m/m) at 17:00 (GMT+3).

By JustMarkets


This article reflects a personal opinion and should not be interpreted as an investment advice, and/or offer, and/or a persistent request for carrying out financial transactions, and/or a guarantee, and/or a forecast of future events.

RoboMarkets to Sponsor the 56th European Championship Sporting

May 11, 2023

Limassol, Cyprus – RoboMarkets, a European brokerage company, is pleased to announce its sponsorship of the 56th European Championship Sporting, taking place from 11 to 14 May 2023 in Limassol, Cyprus. The event is part of LEMESIA 2023, an international sports festival featuring various athletic competitions and cultural events.

The 56th European Championship Sporting is a major event in the sporting calendar, and RoboMarkets is honoured to be the main sponsor. The championship will feature some of the best shooters from all over Europe who will compete in various categories including individuals and teams. The competition promises to be an exciting four-day event, featuring challenging targets and thrilling performances.

As the main sponsor of the event, RoboMarkets will be supporting the championship and contributing to the promotion of shooting sports across Europe. This partnership is an excellent opportunity for RoboMarkets to demonstrate its commitment to supporting local communities and fostering healthy competition.

The competition will be held at the Limassol International Shooting Range in Limassol’s stunning countryside, renowned for its scenic beauty, making it a perfect location for this type of event. Participants will have access to the club’s facilities and equipment for a top-notch experience throughout the event.

For more information about the championship and LEMESIA 2023, please visit https://www.fitasc.com/uk/competition/view/964-compet.

About RoboMarkets

RoboMarkets is a financial brokerage company operating under CySEC license No. 191/13. RoboMarkets offers investment services in many European countries and provides traders working in financial markets with access to its proprietary platforms. Visit www.robomarkets.com to find out more about the Company’s products and activities.

“Risk Warning: CFDs are complex instruments and come with a high risk of losing money rapidly due to leverage. 69.88% of retail investor accounts lose money when trading CFDs with this provider. You should consider whether you understand how CFDs work and whether you can afford to take the high risk of losing your money.”

Bank of England’s incompetence on inflation leads to more misery

By George Prior

The Bank of England’s incompetence continues to punish households and businesses across the UK as interest rates are hiked by a quarter of a percentage point to 4.5%, taking borrowing costs to their highest since 2008.

This assessment from Nigel Green, the CEO and founder of deVere Group, one of the world’s largest independent financial advisory, asset management and fintech organizations, comes as the UK central bank announces its 12th consecutive rate rise on Thursday.

He says: “The Bank of England has failed households and businesses across the UK who are continuing to be punished by the central bank’s failings.

“They failed with their inaction at the start, passively standing by for far too long last year when the UK was first coming out of Covid lockdowns, and prices were already starting to surge.

“They’re failing again now with this latest rate hike – the 12th in a row.

“The Bank seems to be intent on driving the UK’s consumer-led economy into a deeper recession by continuing to make borrowing more expensive, leading to a reduction in spending and investment. Inevitably, this will trigger a further slowdown in economic activity.

He continues: “To add insult to injury, central bank monetary policy is notoriously slow to take effect.

“It is said that changes in interest rates take a year to 18 months to feed themselves into the broader economy. Given the many interest rate hikes over the last 18 months, it would be astonishing if we did not see a marked slowdown in employment growth and demand over the coming months.”

The deVere CEO goes on to add: “Officials at the Bank of England have been behind the curve from the outset.

“They’re going too hard, too late.”

Bank of England policymakers voted 7-2 for May’s hike, with Monetary Policy Committee members Silvana Tenreyro and Swati Dhingra again expressing their opposition to further tightening.

Last week, the US Federal Reserve and the European Central Bank both raised their borrowing rates by 25 basis points.

The Fed Chair Jerome Powell at the meeting after the announcements hinted at a pause moving forward, but ECB President Christine Lagarde said it was too early to do so.

The deVere CEO concludes: “The announcement of another hike is a further blow for UK households and business who are the ones left struggling to deal with decisions made by the Bank of England, which is still failing to curb the fastest inflation of any major economy.”

About:

deVere Group is one of the world’s largest independent advisors of specialist global financial solutions to international, local mass affluent, and high-net-worth clients.  It has a network of more than 70 offices across the world, over 80,000 clients and $12bn under advisement.

Inflationary pressure in the US continues to decline. Chinese inflation data disappointed investors

By JustMarkets

The US Consumer Price Index rose by 0.4% last month, but a deeper look at the data showed a slowdown in core services inflation. According to the CME FedWatch Tool, the likelihood of a Fed pause in June rose from 79% to 96%. But analysts at Morgan Stanley don’t share that and believe that a slight rise in core inflation with a significant slowdown in core services should prompt the Fed to leave the door open for a June hike. While US inflation fell more than expected annually, there are concerns that the impact of higher interest rates on the US economy is only now beginning to show. And the dynamics of the stock indices show it well. At the close of the stock market yesterday, the Dow Jones Index (US30) decreased by 0.22%, while the S&P 500 Index (US500) added 0.24%. The NASDAQ Technology Index (US100) lost 0.63% on Wednesday.

The Walt Disney Company (DIS) Co cut its streaming loss by $400 million quarter-on-quarter but also cut subscriber numbers. The quarterly profit was in line with Wall Street expectations. DIS stock fell nearly 5% after the stock market closed.

Stock markets in Europe were mostly down on Wednesday. Germany’s DAX (DE30) decreased by 0.37%, France’s CAC 40 (FR40) fell by 0.49% yesterday, Spain’s IBEX 35 index (ES35) was down by 0.18%, and the British FTSE 100 (UK100) closed lower by 0.41%.

ECB spokesman Centeno indicated yesterday that ECB policy will remain tight for some time after rates peak, with rates set to start falling in 2024. Speaking Tuesday night, Isabel Schnabel, another ECB executive board spokeswoman, said the ECB would continue to raise borrowing costs with full determination until there are signs that core inflation is also falling steadily.

Today, the Bank of England will likely raise interest rates for the 12th time in a row. The market is almost unanimous in expecting the Monetary Policy Committee to choose another 25 basis point hike. But the outlook diverges further as the Bank of England faces a tougher situation: the UK is projected to be the worst major economy over the next two years, and inflation is still twice as high as in the US and the Eurozone.

Thomas Jordan, head of the Swiss National Bank (SNB), pointed out yesterday that inflation is above the price stability range. Meanwhile, the nominal appreciation of the Swiss franc is mainly due to inflation abroad. This increases the likelihood of another rate hike at the next SNB meeting.

Oil prices rebounded Thursday after falling more than a dollar a barrel the day before, helped by stronger US fuel demand data. A sharper-than-expected drop in US gasoline inventories pushed prices higher, reflecting more robust demand for transportation fuel in the United States.

Asian markets traded flat yesterday. Japan’s Nikkei 225 (JP225) decreased by 0.41% for the day, China’s FTSE China A50 (CHA50) fell by 0.99%, Hong Kong’s Hang Seng (HK50) was down 0.53% for the day, India’s NIFTY 50 (IND50) added 0.27%, and Australia’s S&P/ASX 200 (AU200) closed negative 0.12%.

China’s consumer price inflation fell short of expectations and has been declining for four straight months this year. The consumer price index was 0.1% year-on-year in April. The weak Consumer Price Index indicates that consumer spending has remained sluggish despite lifting COVID-19 restrictions earlier this year. Measures taken by the Chinese government to increase domestic spending have had little effect on inflation, as the economy has weakened after three years of lockdowns. Although levels of retail spending and travel demand in China have risen slightly in recent months, they remain well below levels seen before the COVID-19 pandemic. A weak inflation reading in April would likely entail additional stimulus and potentially looser monetary conditions in the country.

S&P 500 (F) (US500) 4,129.20 +10.03 (+0.24%)

Dow Jones (US30)33,487.87 −73.94 (−0.22%)

DAX (DE40) 15,896.23 −59.25 (−0.37%)

FTSE 100 (UK100) 7,732.09 −32.00 (−0.41%)

USD Index 101.44 −0.17 −0.16%

Important events for today:
  • – China Consumer Price Index (m/m) at 04:30 (GMT+3);
  • – China Producer Price Index (m/m) at 04:30 (GMT+3);
  • – UK BoE Interest Rate Decision at 14:00 (GMT+3);
  • – UK BOE Monetary Policy Report at 14:00 (GMT+3);
  • – UK BoE Gov Bailey Speaks at 14:30 (GMT+3);
  • – US Initial Jobless Claims (w/w) at 15:30 (GMT+3);
  • – US Producer Price Index (m/m) at 15:30 (GMT+3);
  • – US FOMC Member Waller Speaks at 17:15 (GMT+3);
  • – US Natural Gas Storage (w/w) at 17:30 (GMT+3).

By JustMarkets


This article reflects a personal opinion and should not be interpreted as an investment advice, and/or offer, and/or a persistent request for carrying out financial transactions, and/or a guarantee, and/or a forecast of future events.

GBPUSD Slips Ahead Of BoE Rate Decision

By ForexTime

Our focus falls on the pound ahead of the Bank of England (BoE) rate decision this afternoon.

The BoE is widely expected to raise interest rates for the 12th consecutive meeting thanks to stubborn double-digit inflation. While a 25-basis point hike is pretty much a certainty, the key question is whether the BoE will signal more hikes like the European Central Bank (ECB) or hint at a pause like the Federal Reserve (Fed).

A spicy combination of hot inflation and strong wage growth may force the central bank to keep the doors open for more rate hikes down the road. Nevertheless, the minutes, quarterly Monetary Policy Report, and BoE Governor Andrew Bailey’s press conference may offer fresh clues on the BoE’s next move.

In the previous trading session, the GBPUSD jumped to a fresh 2023 high around 1.2680 before giving back some gains. If the BoE sends a hawkish message and hints of more hikes in the future, this could boost the currency pair. Alternatively, a dovish-sounding BoE that hints at pausing rates could drag prices lower. Whatever the outcome, it will certainly have a strong impact on the GBPUSD.

Taking a deep dive into the technicals… 

The GBPUSD is in an established uptrend on the daily timeframe with multiple impulse waves already showing clearly on the chart. On 9 May at 1.26799 a higher top was recorded but the bears also sent a clear signal that they want another decent innings here soon.

Two bearish pin bars forming in the last few days was a clear warning for alert technical traders that a shift in momentum might be on the books. This is being confirmed currently with a strong bearish candle and a possible correction wave in progress.

If the bears continue to pull the price lower, they might reach a weekly support level and then two scenarios are possible from there.

One is that the bulls get back into the game and start driving prices upward to start a possible new impulse wave.

Two is that the bears keep the upper hand and although some lower time frame ranging can be expected as the weekly support level exerts it’s influence on the price, the correction wave may continue or even, after a potential short bullish stint, a lower top and then lower bottom might form on the D1 chart to give the bears full control of the market.

As long as the bulls keep on making higher top and bottoms, the outlook for GBPUSD on the D1 time frame will remain bullish as confirmed by the price currently being above the 15 and 34 Simple Moving Averages and the Momentum oscillator hovering above the 100-base line in bullish terrain.


Forex-Time-LogoArticle by ForexTime

ForexTime Ltd (FXTM) is an award winning international online forex broker regulated by CySEC 185/12 www.forextime.com

RoboMarkets Chosen as Europe’s Most Trusted Broker in 2023

RoboMarkets, a brokerage company that provides financial markets trading services to European clients, has won the Safest European Broker 2023 title. This award was presented at the prestigious London Trader Show 2023 event in London.

The London Trader Show (formerly the London Forex Show) has been running every year since 2010. It is one of the most important events for the industry in Europe and the UK, providing investors and traders with the opportunity to interact with industry peers and gain new knowledge. A variety of training sessions and hands-on workshops are organised as part of this one-day event.

The highlight of the show’s programme is the awarding of The London Trader Show Awards 2023. During the voting, which was conducted on the organiser’s official website until 28 February 2023, everyone could take a poll and vote for their favourites in the 8 nominated categories.

How does RoboMarkets Ltd protect its clients’ funds?

Protection against negative balance

RoboMarkets clients can have peace of mind thanks to negative balance protection, as they can be sure they will not be charged more than they intended to invest in any case.

Membership in the Investor Compensation Fund (ICF)

The fund provides insured clients of CySEC-registered companies with compensation of up to €20,000.

Market-leading insurance policy

RoboMarkets has taken additional steps to protect its obligations to clients and third parties for up to €2,500,000 through a public liability insurance policy for brokerage companies. This programme includes market-leading insurance coverage for risks that can lead to financial losses for clients, such as fraud, omissions, negligence, errors and others.

About RoboMarkets

RoboMarkets is a financial brokerage company licensed by CySEC, operating under licence number 191/13. It provides access to more than 3,000 stocks and other instruments. Trading is performed using the latest technology and proprietary products on the MetaTrader 4, MetaTrader 5, R MobileTrader, R StocksTrader and R WebTrader platforms. View more information about the company’s products and services on www.robomarkets.com.

“Risk Warning: CFDs are complex instruments and come with a high risk of losing money rapidly due to leverage. 69.88% of retail investor accounts lose money when trading CFDs with this provider. You should consider whether you understand how CFDs work and whether you can afford to take the high risk of losing your money.”