By InvestMacro
Here are the latest charts and statistics for the Commitment of Traders (COT) data published by the Commodities Futures Trading Commission (CFTC).
The latest COT data is updated through Tuesday March 3rd and shows a quick view of how large market participants (for-profit speculators and commercial traders) were positioned in the futures markets. All currency positions are in direct relation to the US dollar where, for example, a bet for the euro is a bet that the euro will rise versus the dollar while a bet against the euro will be a bet that the euro will decline versus the dollar.
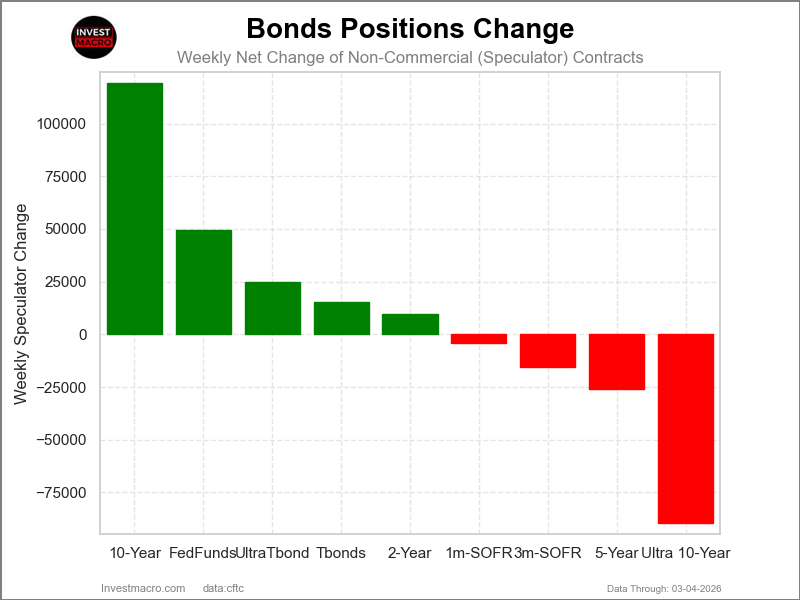
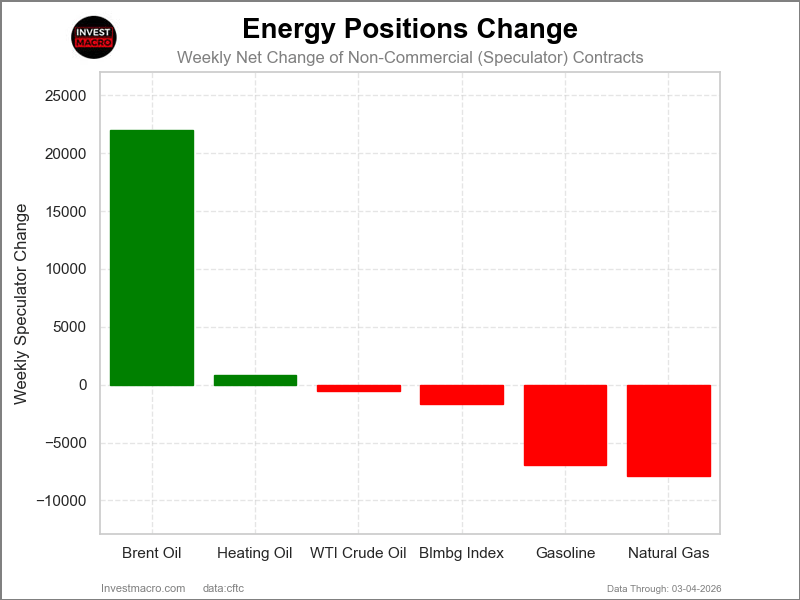
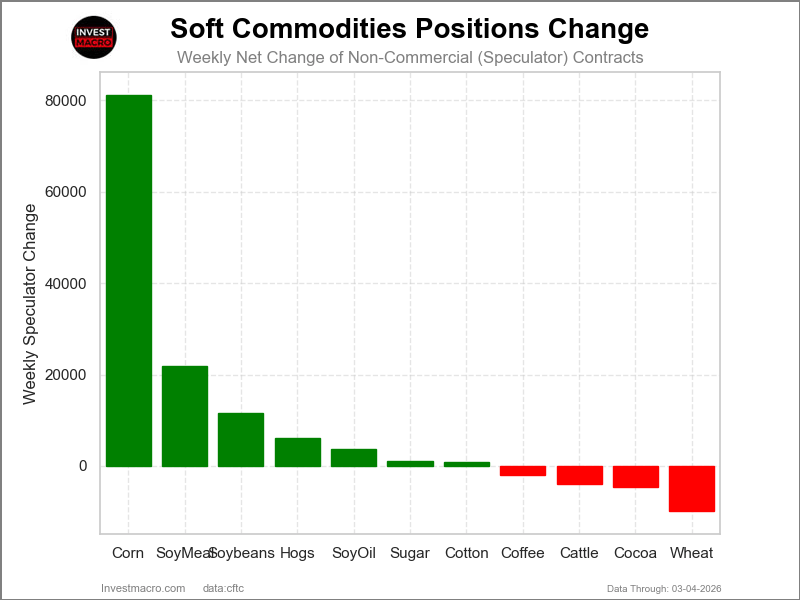
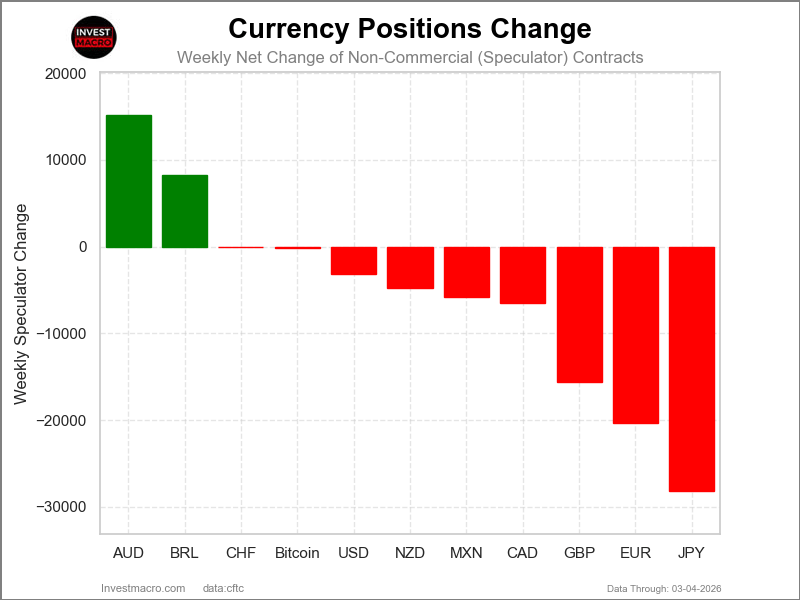
Weekly Speculator Changes led by Australian Dollar & Brazilian Real
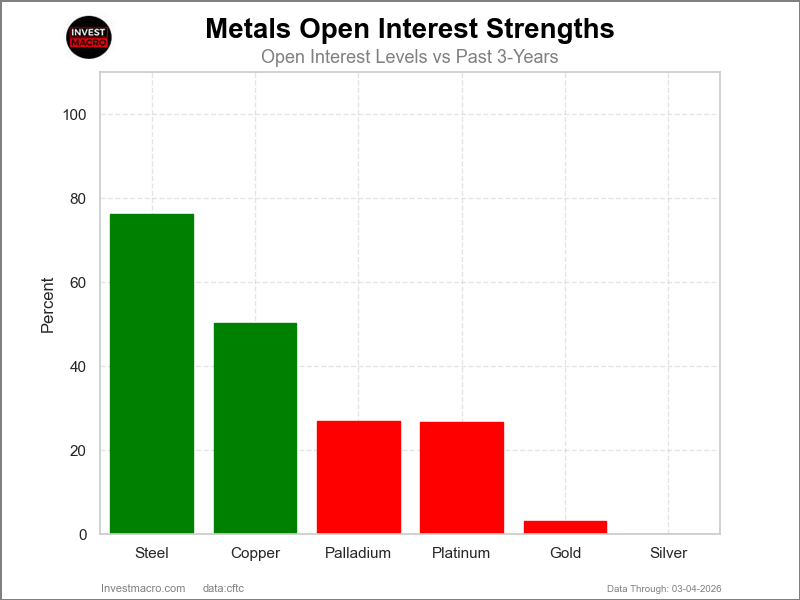
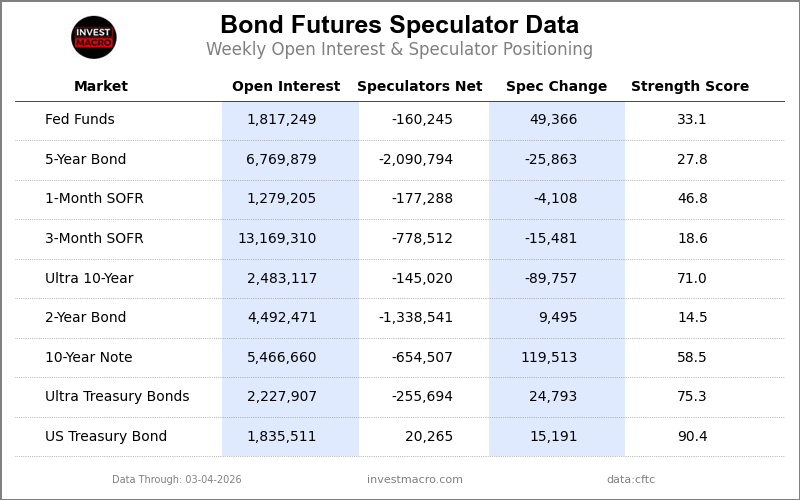
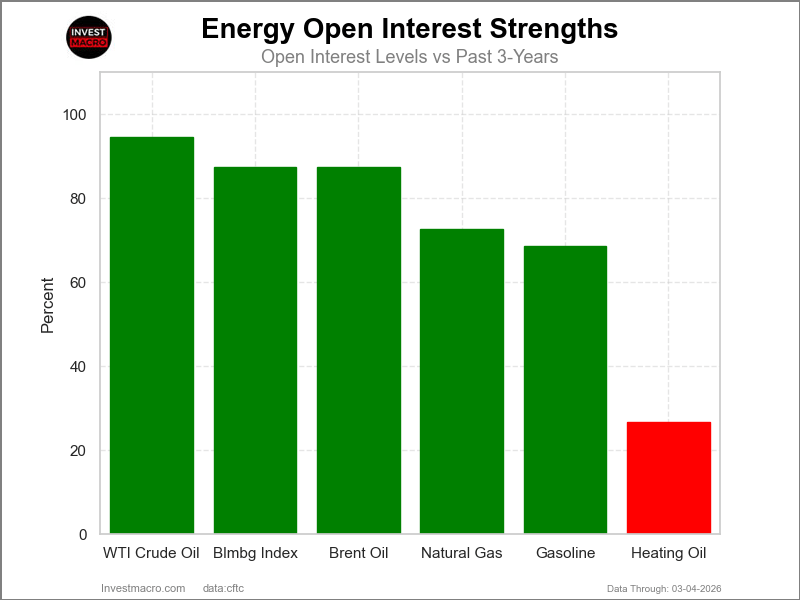
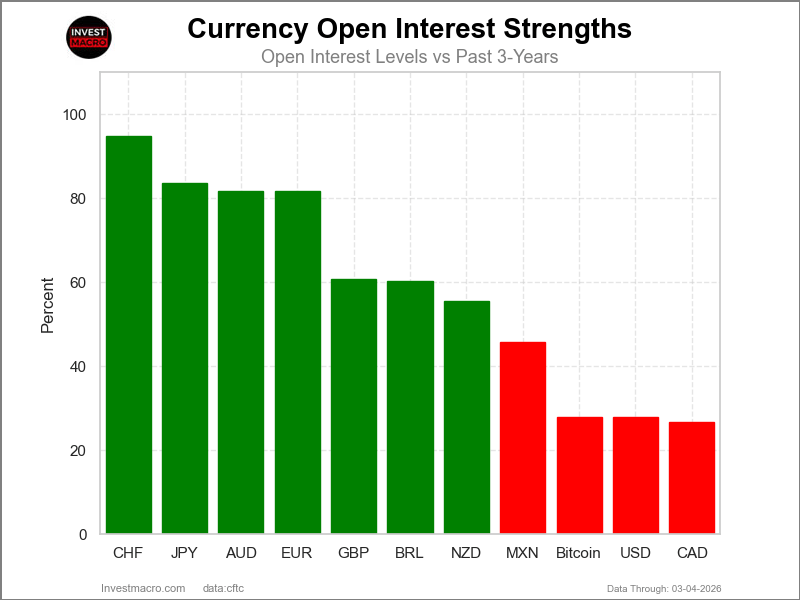
Open Interest Strength Levels show where current Open Futures Contracts are highest and lowest (higher interest can fuel trends and setup for more potential moves & vice versa) for currency markets.
The COT currency market speculator bets were overall lower this week as just two out of the eleven currency markets we cover had higher positioning while the other nine markets had lower speculator contracts.
Leading the gains for the currency markets was the Australian Dollar (15,118 contracts) with the Brazilian Real (8,296 contracts) also having a positive week.
The currencies seeing declines in speculator bets on the week were the Japanese Yen (-28,114 contracts), the EuroFX (-20,358 contracts), the British Pound (-15,614 contracts), the Canadian Dollar (-6,528 contracts), Mexican Peso (-5,837 contracts), the New Zealand Dollar (-4,767 contracts), the US Dollar Index (-3,200 contracts), Bitcoin (-161 contracts) and with the Swiss Franc (-97 contracts) also registering lower bets on the week.
Weekly Currency Speculator Positions see AUD, BRL bets rise. Yen, Euro bets drop
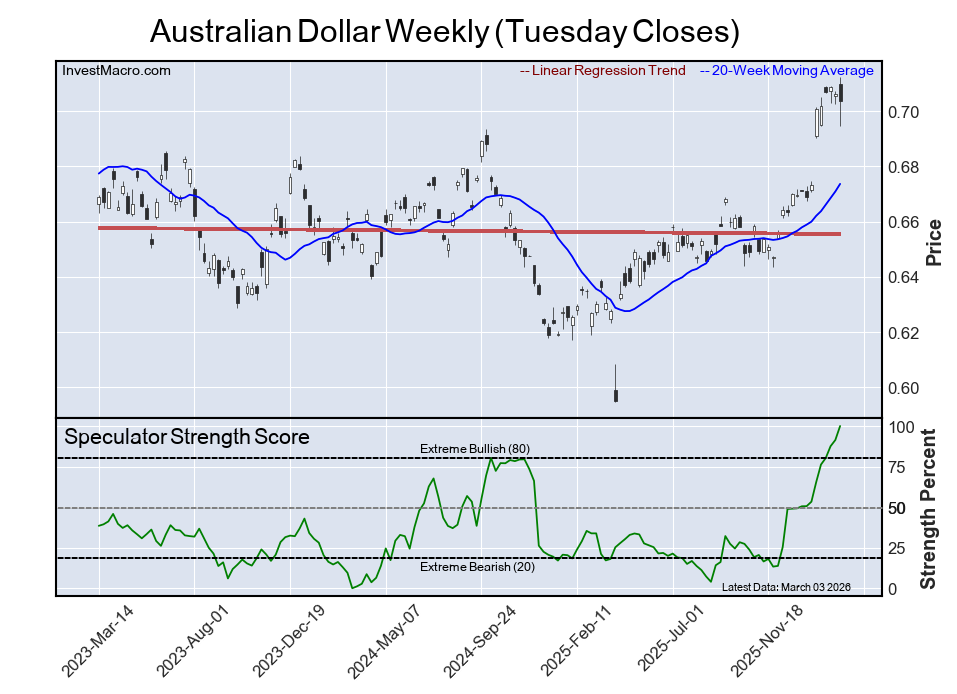
The Australian Dollar speculator position continued to surge higher this week. It rose over 15,000 contracts and is now higher for the fourteenth consecutive week. Over these last 14 weeks, speculators have added 151,938 net contracts to the Aussie position. This has taken the overall position from highly bearish in November to a total of +67,762 contracts this week and the current positioning continues to be at its highest levels since 2017. In the currency spot market, however, with the Iran war breaking out this week, the Aussie dipped this week after touching its highest levels since 2023 in previous weeks. The Aussie made a bearish doji candlestick on the weekly charts and has been overbought for many weeks on the weekly Relative Strength Index (RSI) indicator. The Australian Dollar has not traditionally been a safe haven currency—actually the opposite, so caution is warranted going forward with this currency.
The Brazilian Real was the next highest gainer this week with a rise of over 8,000 contracts. The Real now has been up in seven out of the past eight weeks for an eight-week gain of 27,353 net contracts. The Real position currently sits at a +44,970 contract net position, which is the highest level since December. In the currency spot market, the Real saw a strong dip (-2.63%) this week after a recent strong run that had brought the BRL to the highest level since 2024 against the US Dollar. The Real is also not considered a safe haven currency, so this currency also bears watching.
The Japanese Yen was the biggest loser on the week in terms of speculator changes in positions. The Yen lost -28,114 contracts this week and fell for a second consecutive week. This has pulled the Yen back into an overall negative or bearish territory with a total net position, as of Tuesday, at -16,575 contracts. In the forex market, the Yen has typically been a safe haven currency but did not receive safe haven flows this week as the currency fell by over 1%. It continued to lose ground to the US Dollar for the third consecutive week as the USD/JPY trades at the 157.82 exchange rate in the spot currency markets, which is a historically strong rate for the US Dollar versus the Yen.
The Euro positions also took a strong hit this week, and the Euro positioning has now dropped for three consecutive weeks with a total of -43,807 net contracts taken off the bullish position. Overall, the Euro currency has been in a strong speculative bullish position, with the position being over +100,000 contracts for fourteen consecutive weeks and for thirty-four out of the past thirty-eight weeks dating back to June 2025. In the currency spot market this week, the Euro fell by almost 2% as the Iran war raged, and the Euro closed at 1.1605. Just about six weeks ago, the Euro touched a high of 1.2110 against the US Dollar but has now dipped back into its range from 1.15 to about 1.19 that the currency has traded in since June.
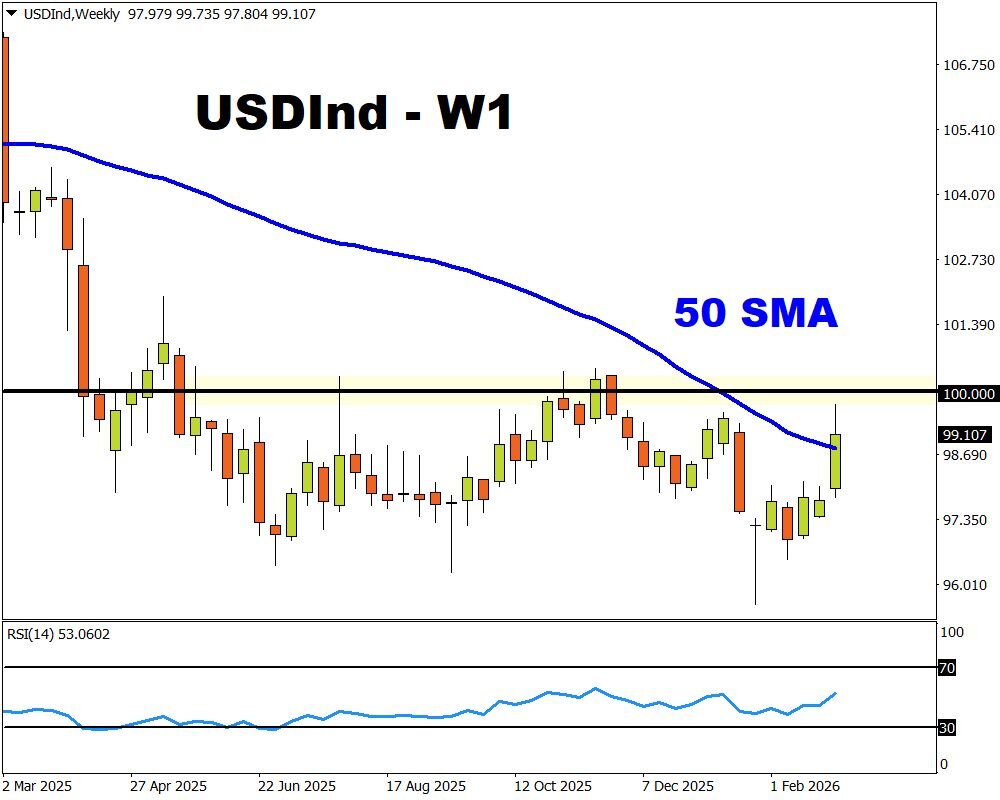
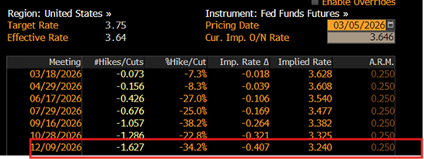
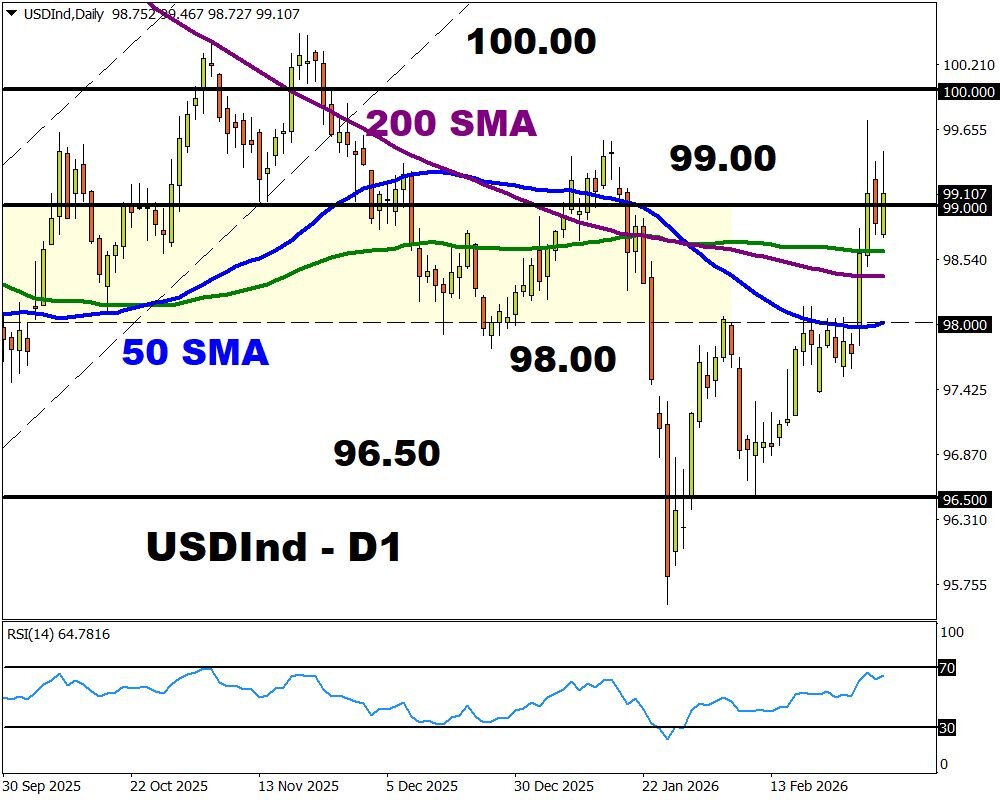
The US Dollar Index speculator positions fell for a second straight week this week and continue to be in an smallish overall net bearish position at -4,989 contracts. However, in the Forex market, the US Dollar Index started to see some strength as the week grew on, and the US Dollar is a traditional safe haven currency (along with the Swiss Franc and the Japanese Yen). The speculator data is through Tuesday and the speculator contracts may see an abrupt shift next week as the war drags on. Currently, the US Dollar Index trades at the 98.98 level, which is its highest close in about six weeks and there is the 100.00 psychological price level waiting above to test on further gains.
Bitcoin and the US Dollar Index lead Price Performance this week
Bitcoin saw a bit of a rebound this week with a 3.81% gain and led in the weekly price performances. The US Dollar Index was higher this week by 1.52% and received safe haven bids due to the Iran war. The Canadian Dollar was higher by 0.36% and undoubtedly received some strength off of the oil price going higher.
On the downside, the British Pound Sterling was lower by -0.71% followed by the Swiss Franc which fell by -1.13%. The Japanese Yen was next with a -1.19% shortfall while the Australian Dollar was lower by -1.35% and the New Zealand Dollar was lower by -1.69%. The Euro dropped a little less than 2% with a -1.84% 5-day decline. The Brazilian Real had a sharp decline at -2.63% and the Mexican Peso was the biggest loser on the week with a -3.28% decrease.
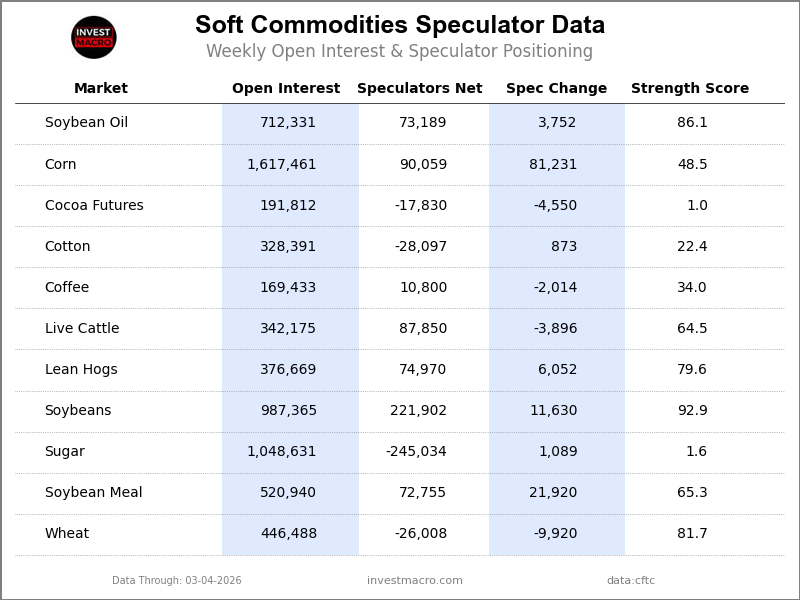
Currencies Data:
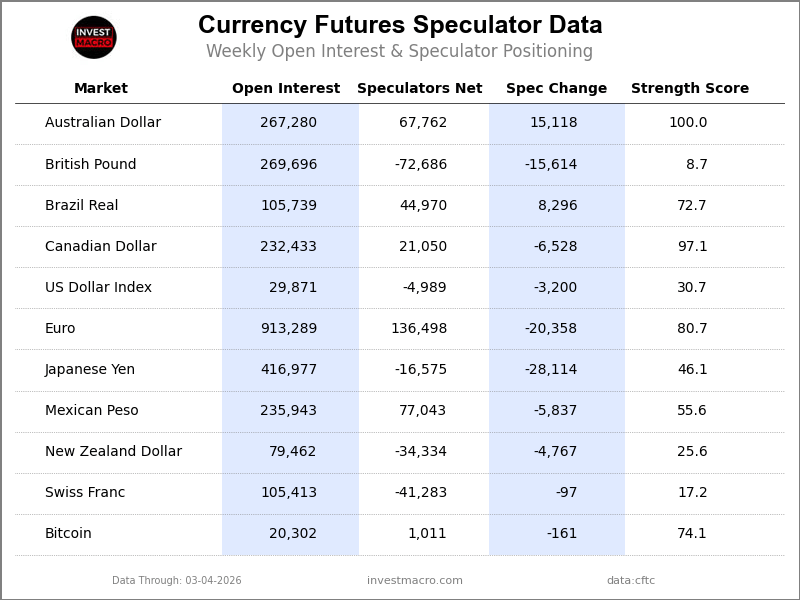
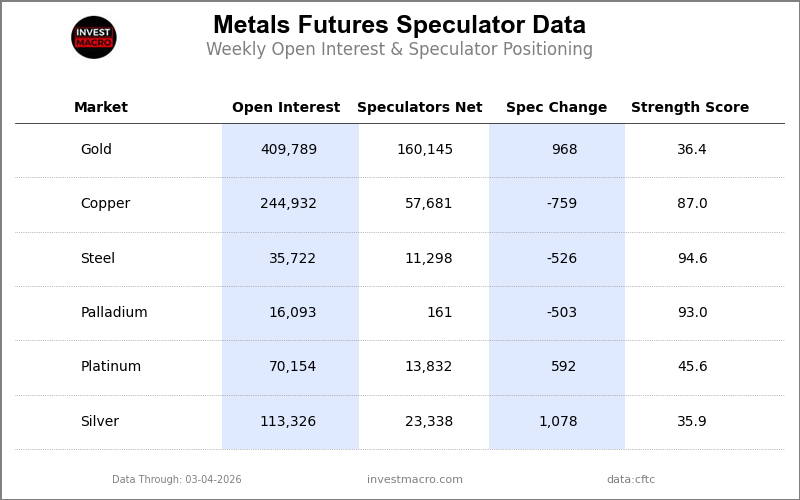
Legend: Open Interest | Speculators Current Net Position | Weekly Specs Change | Specs Strength Score compared to last 3-Years (0-100 range)
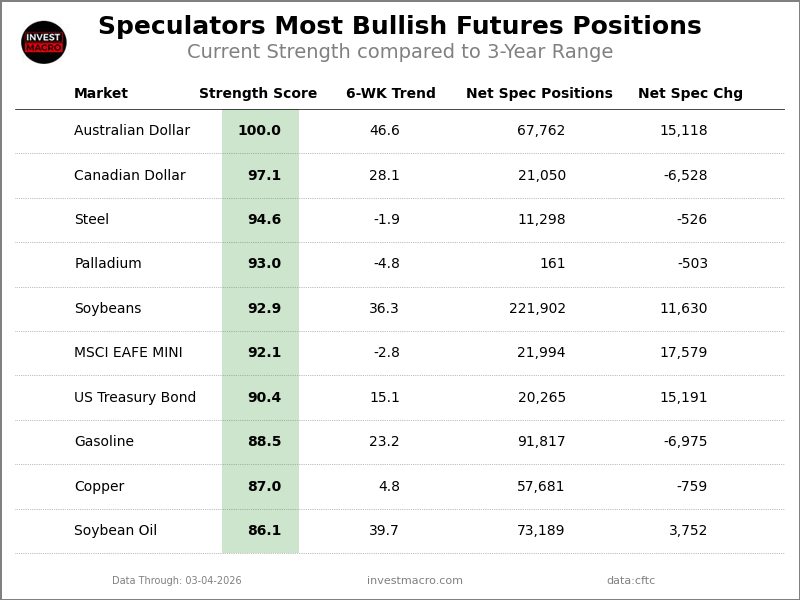
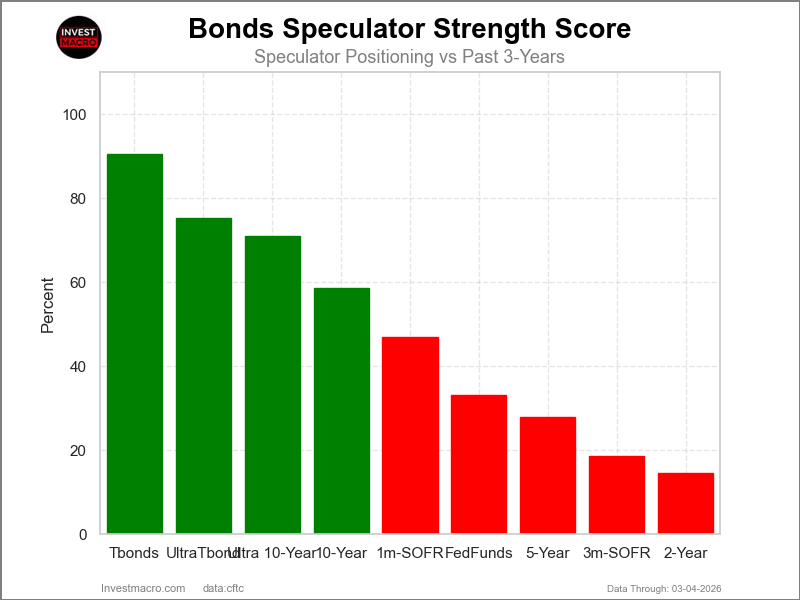
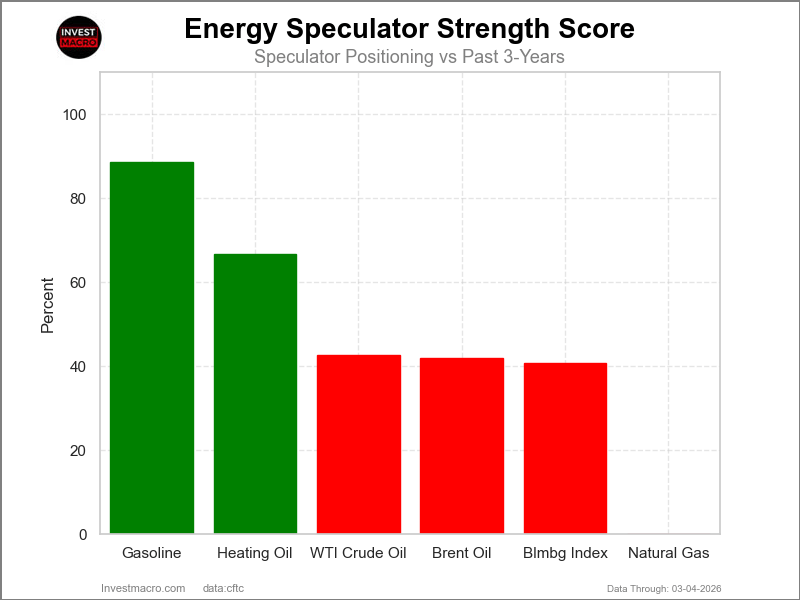
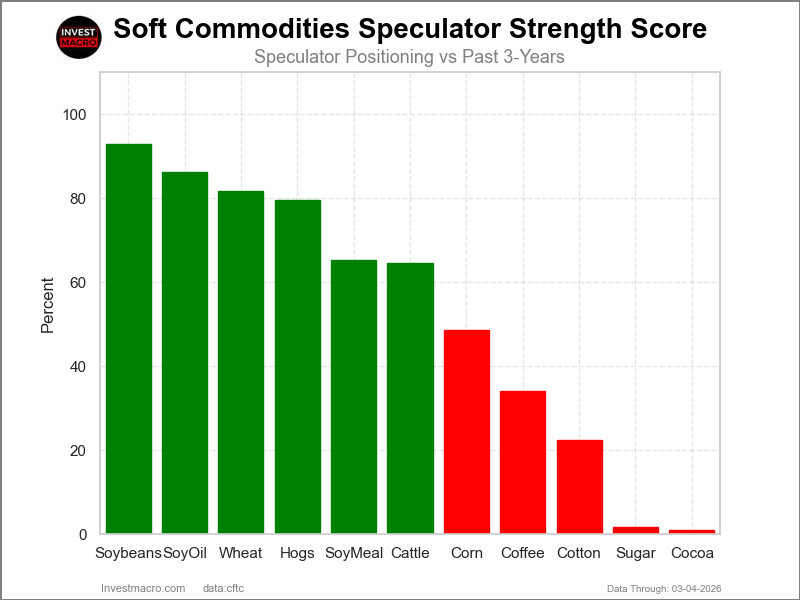
Strength Scores led by Australian Dollar & Canadian Dollar
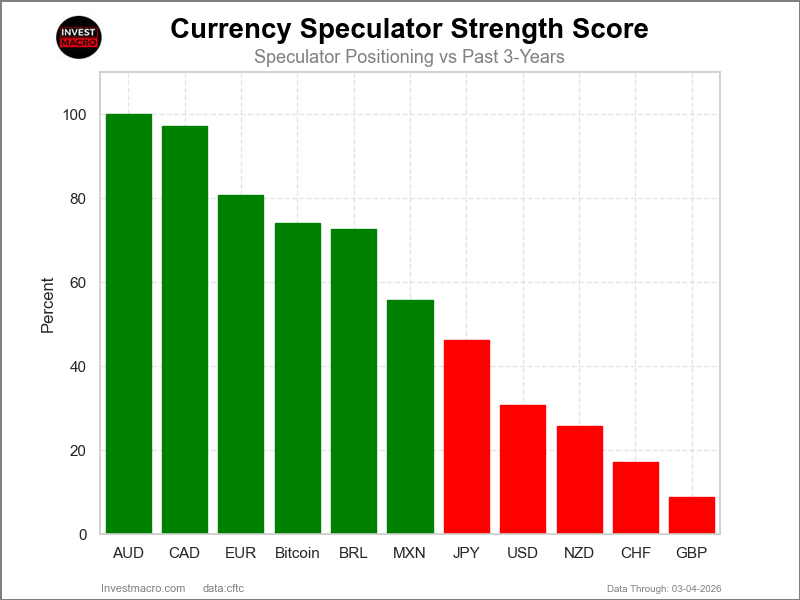
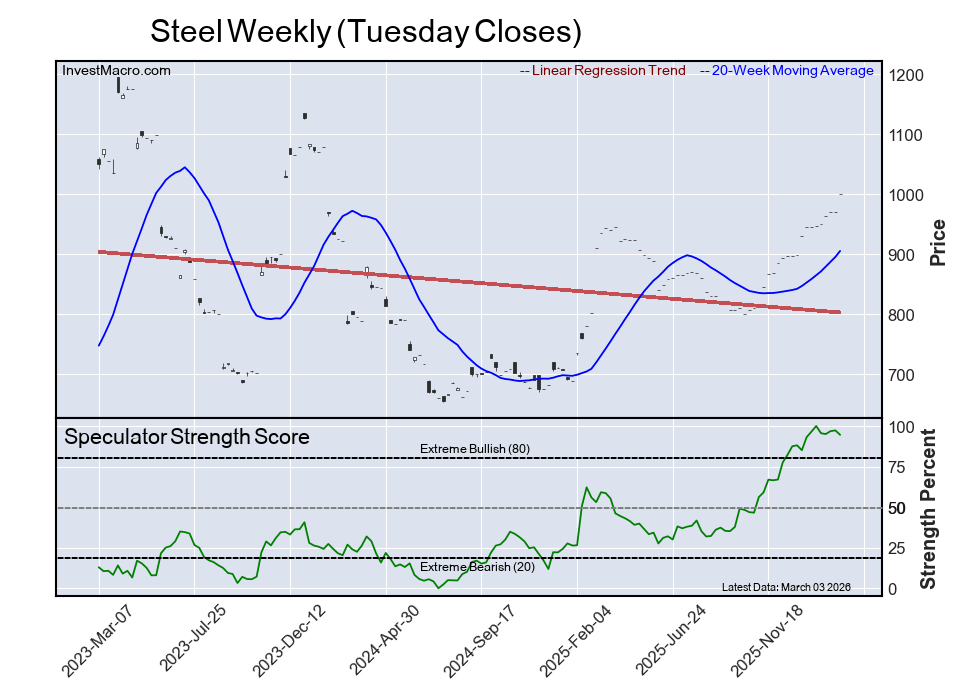
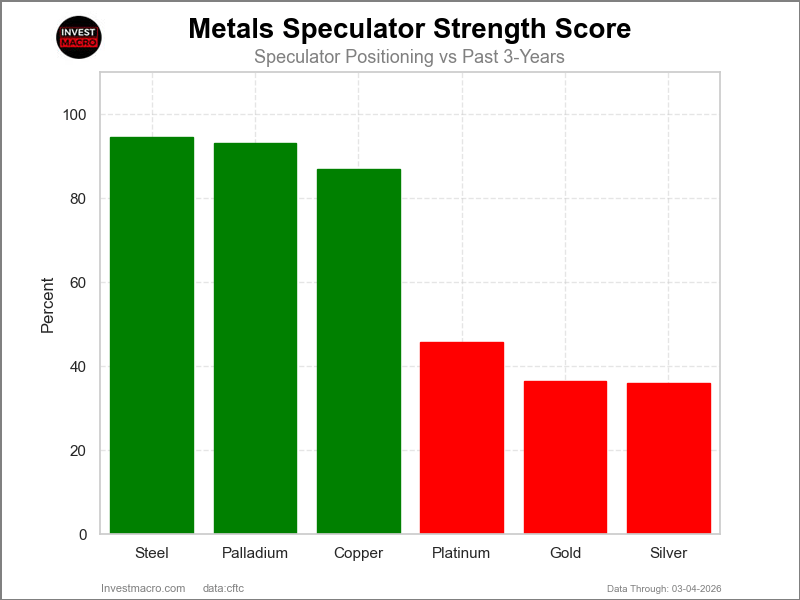
COT Strength Scores (a normalized measure of Speculator positions over a 3-Year range, from 0 to 100 where above 80 is Extreme-Bullish and below 20 is Extreme-Bearish) showed that the Australian Dollar (100 percent) and the Canadian Dollar (97 percent) lead the currency markets this week. The EuroFX (81 percent), Bitcoin (74 percent) and the Brazilian Real (73 percent) come in as the next highest in the weekly strength scores.
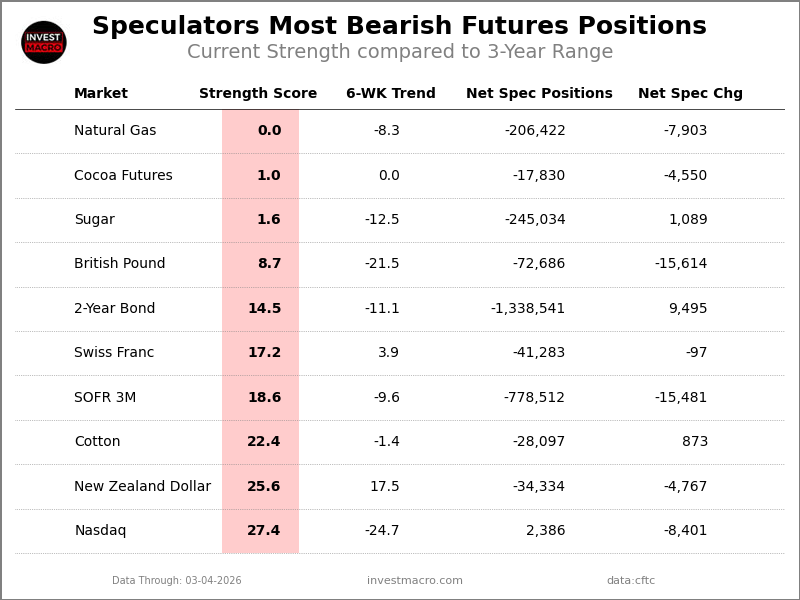
On the downside, the British Pound (9 percent) and the Swiss Franc (17 percent) come in at the lowest strength levels currently and are in Extreme-Bearish territory (below 20 percent). The next lowest strength scores are the New Zealand Dollar (26 percent) and the US Dollar Index (31 percent).
3-Year Strength Statistics:
US Dollar Index (30.7 percent) vs US Dollar Index previous week (39.3 percent)
EuroFX (80.7 percent) vs EuroFX previous week (88.5 percent)
British Pound Sterling (8.7 percent) vs British Pound Sterling previous week (15.4 percent)
Japanese Yen (46.1 percent) vs Japanese Yen previous week (53.9 percent)
Swiss Franc (17.2 percent) vs Swiss Franc previous week (17.4 percent)
Canadian Dollar (97.1 percent) vs Canadian Dollar previous week (100.0 percent)
Australian Dollar (100.0 percent) vs Australian Dollar previous week (91.4 percent)
New Zealand Dollar (25.6 percent) vs New Zealand Dollar previous week (31.1 percent)
Mexican Peso (55.6 percent) vs Mexican Peso previous week (59.8 percent)
Brazilian Real (72.7 percent) vs Brazilian Real previous week (66.6 percent)
Bitcoin (74.1 percent) vs Bitcoin previous week (77.5 percent)
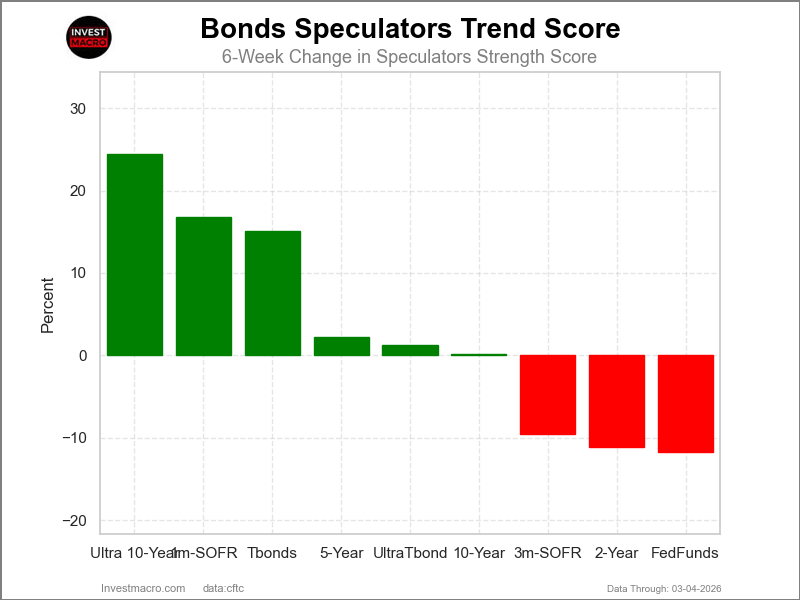
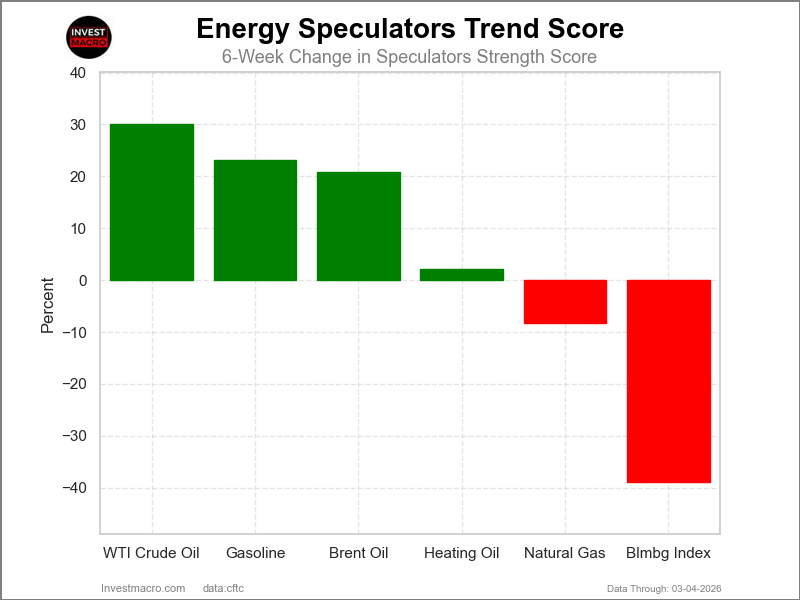
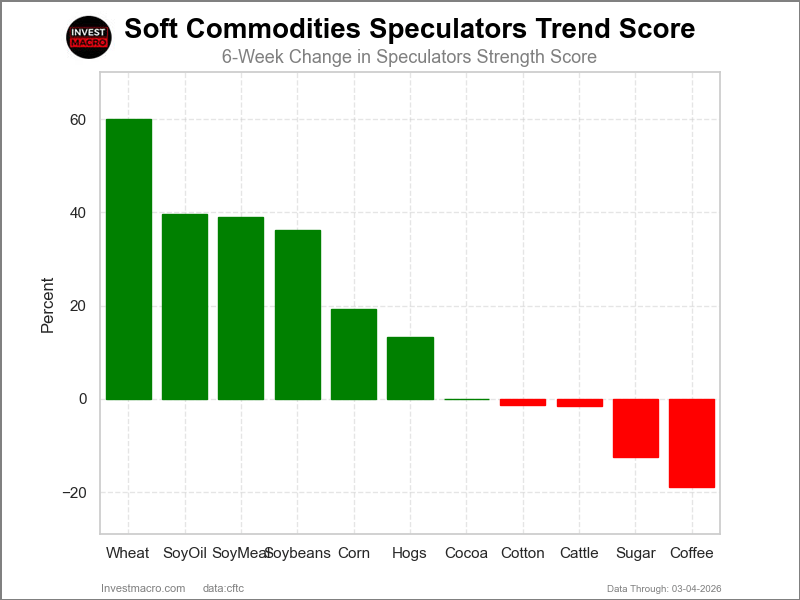
Australian Dollar & Canadian Dollar top the 6-Week Strength Trends
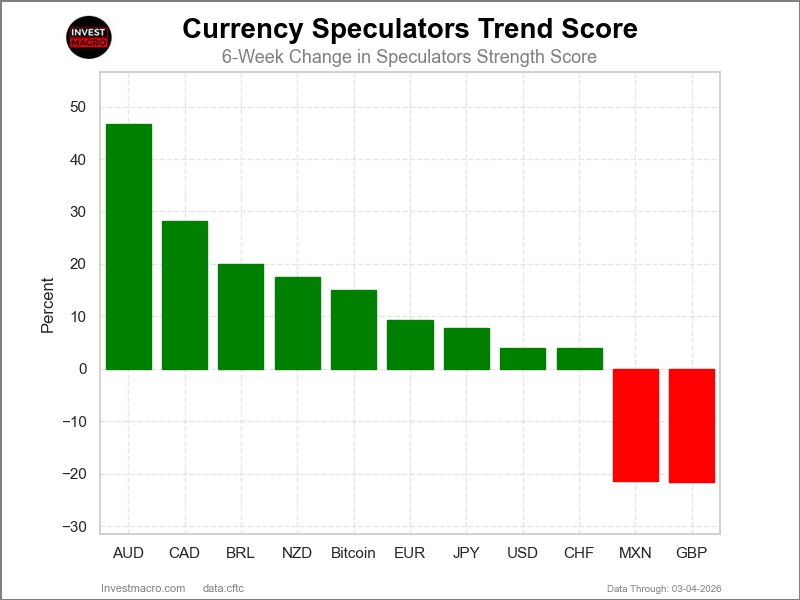
COT Strength Score Trends (or move index, calculates the 6-week changes in strength scores) showed that the Australian Dollar (47 percent) and the Canadian Dollar (28 percent) lead the past six weeks trends for the currencies. The Brazilian Real (20 percent), the New Zealand Dollar (17 percent) and Bitcoin (15 percent) are the next highest positive movers in the 3-Year trends data.
The British Pound (-22 percent) leads the downside trend scores currently with the Mexican Peso (-21 percent) following next with lower trend scores.
3-Year Strength Trends:
US Dollar Index (3.9 percent) vs US Dollar Index previous week (5.2 percent)
EuroFX (9.4 percent) vs EuroFX previous week (9.2 percent)
British Pound Sterling (-21.5 percent) vs British Pound Sterling previous week (-13.5 percent)
Japanese Yen (7.8 percent) vs Japanese Yen previous week (15.6 percent)
Swiss Franc (3.9 percent) vs Swiss Franc previous week (4.5 percent)
Canadian Dollar (28.1 percent) vs Canadian Dollar previous week (31.2 percent)
Australian Dollar (46.6 percent) vs Australian Dollar previous week (40.8 percent)
New Zealand Dollar (17.5 percent) vs New Zealand Dollar previous week (22.0 percent)
Mexican Peso (-21.3 percent) vs Mexican Peso previous week (-14.6 percent)
Brazilian Real (19.9 percent) vs Brazilian Real previous week (13.7 percent)
Bitcoin (15.1 percent) vs Bitcoin previous week (23.4 percent)
Individual COT Forex Markets:
US Dollar Index Futures:
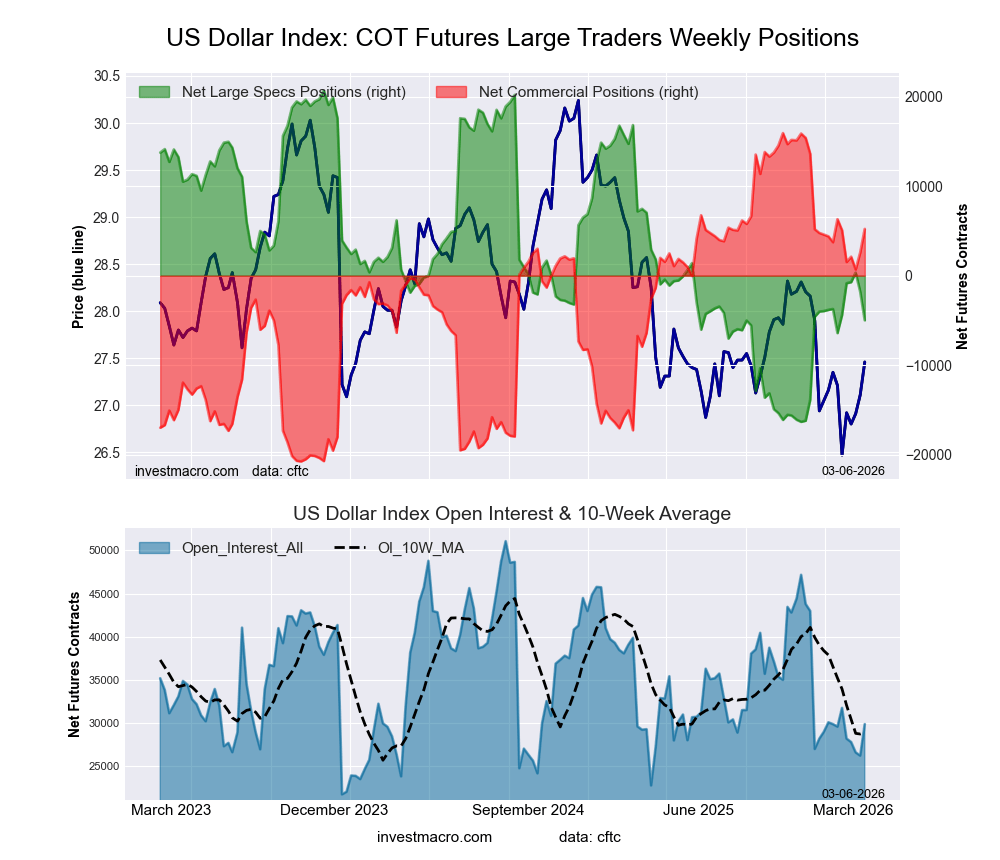 The US Dollar Index large speculator standing this week equaled a net position of -4,989 contracts in the data reported through Tuesday. This was a weekly decline of -3,200 contracts from the previous week which had a total of -1,789 net contracts.
This week’s current strength score (the trader positioning range over the past three years, measured from 0 to 100) shows the speculators are currently Bearish with a score of 30.7 percent. The commercials are Bullish with a score of 70.8 percent and the small traders (not shown in chart) are Bearish with a score of 34.9 percent.
Price Trend-Following Model: Weak Downtrend
Our weekly trend-following model classifies the current market price position as: Weak Downtrend.
| US DOLLAR INDEX Statistics | SPECULATORS | COMMERCIALS | SMALL TRADERS |
| – Percent of Open Interest Longs: | 50.4 | 29.7 | 11.8 |
| – Percent of Open Interest Shorts: | 67.1 | 12.2 | 12.5 |
| – Net Position: | -4,989 | 5,223 | -234 |
| – Gross Longs: | 15,061 | 8,882 | 3,513 |
| – Gross Shorts: | 20,050 | 3,659 | 3,747 |
| – Long to Short Ratio: | 0.8 to 1 | 2.4 to 1 | 0.9 to 1 |
| NET POSITION TREND: | | | |
| – Strength Index Score (3 Year Range Pct): | 30.7 | 70.8 | 34.9 |
| – Strength Index Reading (3 Year Range): | Bearish | Bullish | Bearish |
| NET POSITION MOVEMENT INDEX: | | | |
| – 6-Week Change in Strength Index: | 3.9 | -2.9 | -6.1 |
Euro Currency Futures:
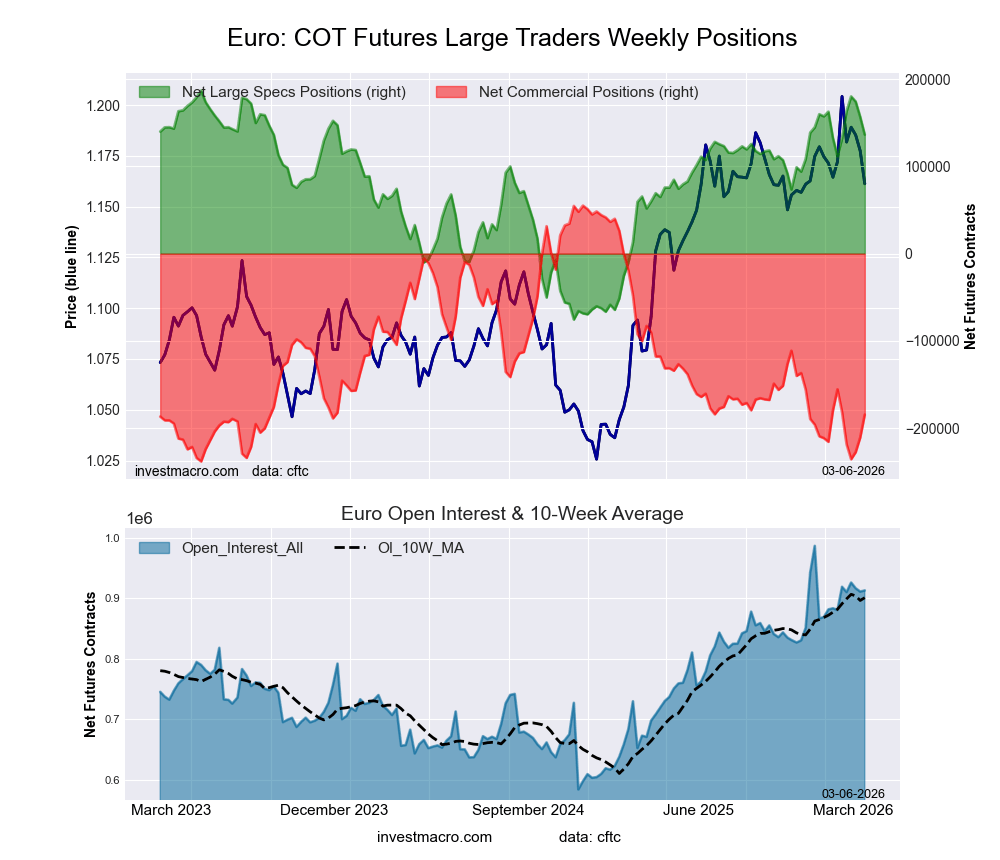 The Euro Currency large speculator standing this week equaled a net position of 136,498 contracts in the data reported through Tuesday. This was a weekly reduction of -20,358 contracts from the previous week which had a total of 156,856 net contracts.
This week’s current strength score (the trader positioning range over the past three years, measured from 0 to 100) shows the speculators are currently Bullish-Extreme with a score of 80.7 percent. The commercials are Bearish-Extreme with a score of 18.3 percent and the small traders (not shown in chart) are Bullish with a score of 76.0 percent.
Price Trend-Following Model: Weak Uptrend
Our weekly trend-following model classifies the current market price position as: Weak Uptrend.
| EURO Currency Statistics | SPECULATORS | COMMERCIALS | SMALL TRADERS |
| – Percent of Open Interest Longs: | 32.3 | 53.2 | 10.1 |
| – Percent of Open Interest Shorts: | 17.3 | 73.4 | 4.8 |
| – Net Position: | 136,498 | -184,593 | 48,095 |
| – Gross Longs: | 294,586 | 485,713 | 91,926 |
| – Gross Shorts: | 158,088 | 670,306 | 43,831 |
| – Long to Short Ratio: | 1.9 to 1 | 0.7 to 1 | 2.1 to 1 |
| NET POSITION TREND: | | | |
| – Strength Index Score (3 Year Range Pct): | 80.7 | 18.3 | 76.0 |
| – Strength Index Reading (3 Year Range): | Bullish-Extreme | Bearish-Extreme | Bullish |
| NET POSITION MOVEMENT INDEX: | | | |
| – 6-Week Change in Strength Index: | 9.4 | -9.9 | 8.8 |
British Pound Sterling Futures:
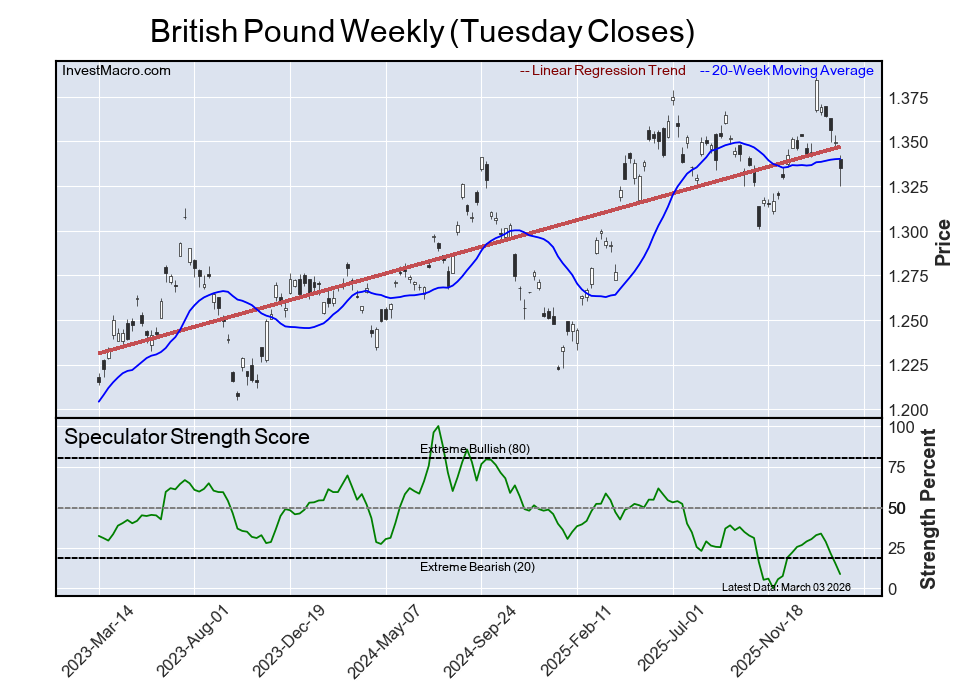
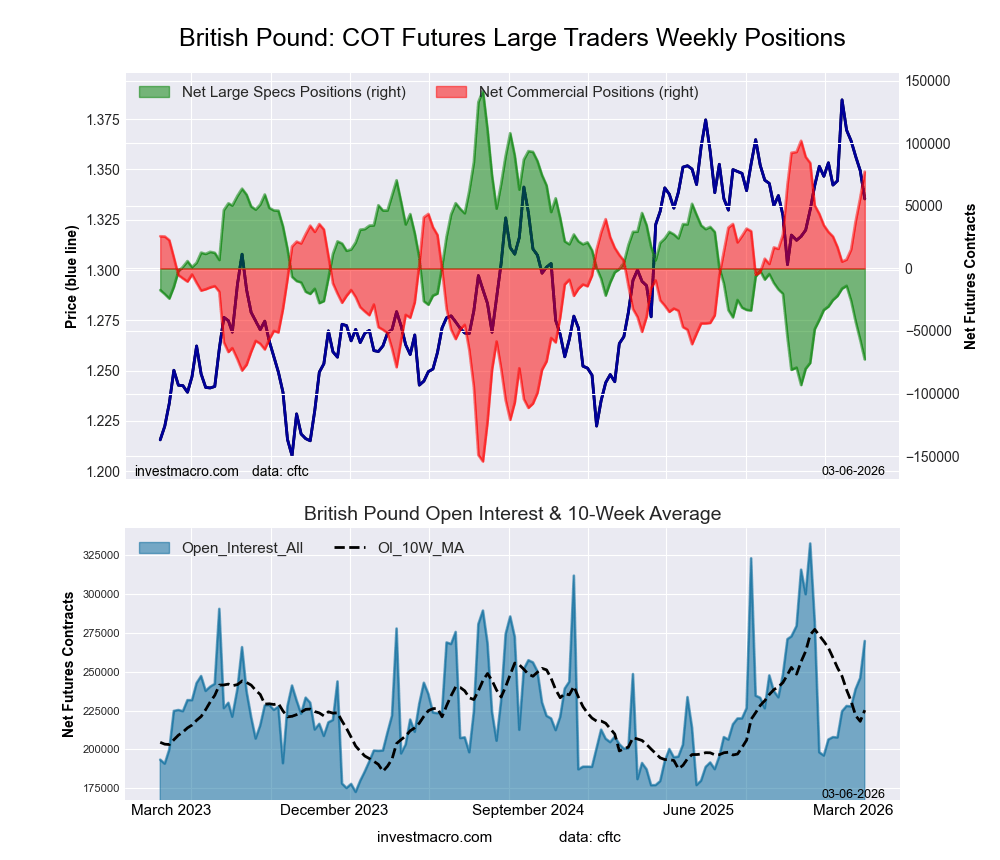 The British Pound Sterling large speculator standing this week equaled a net position of -72,686 contracts in the data reported through Tuesday. This was a weekly decrease of -15,614 contracts from the previous week which had a total of -57,072 net contracts.
This week’s current strength score (the trader positioning range over the past three years, measured from 0 to 100) shows the speculators are currently Bearish-Extreme with a score of 8.7 percent. The commercials are Bullish-Extreme with a score of 90.4 percent and the small traders (not shown in chart) are Bearish with a score of 41.2 percent.
Price Trend-Following Model: Weak Uptrend
Our weekly trend-following model classifies the current market price position as: Weak Uptrend.
| BRITISH POUND Statistics | SPECULATORS | COMMERCIALS | SMALL TRADERS |
| – Percent of Open Interest Longs: | 22.1 | 60.5 | 9.6 |
| – Percent of Open Interest Shorts: | 49.0 | 31.8 | 11.4 |
| – Net Position: | -72,686 | 77,305 | -4,619 |
| – Gross Longs: | 59,499 | 163,156 | 26,010 |
| – Gross Shorts: | 132,185 | 85,851 | 30,629 |
| – Long to Short Ratio: | 0.5 to 1 | 1.9 to 1 | 0.8 to 1 |
| NET POSITION TREND: | | | |
| – Strength Index Score (3 Year Range Pct): | 8.7 | 90.4 | 41.2 |
| – Strength Index Reading (3 Year Range): | Bearish-Extreme | Bullish-Extreme | Bearish |
| NET POSITION MOVEMENT INDEX: | | | |
| – 6-Week Change in Strength Index: | -21.5 | 23.5 | -24.7 |
Japanese Yen Futures:
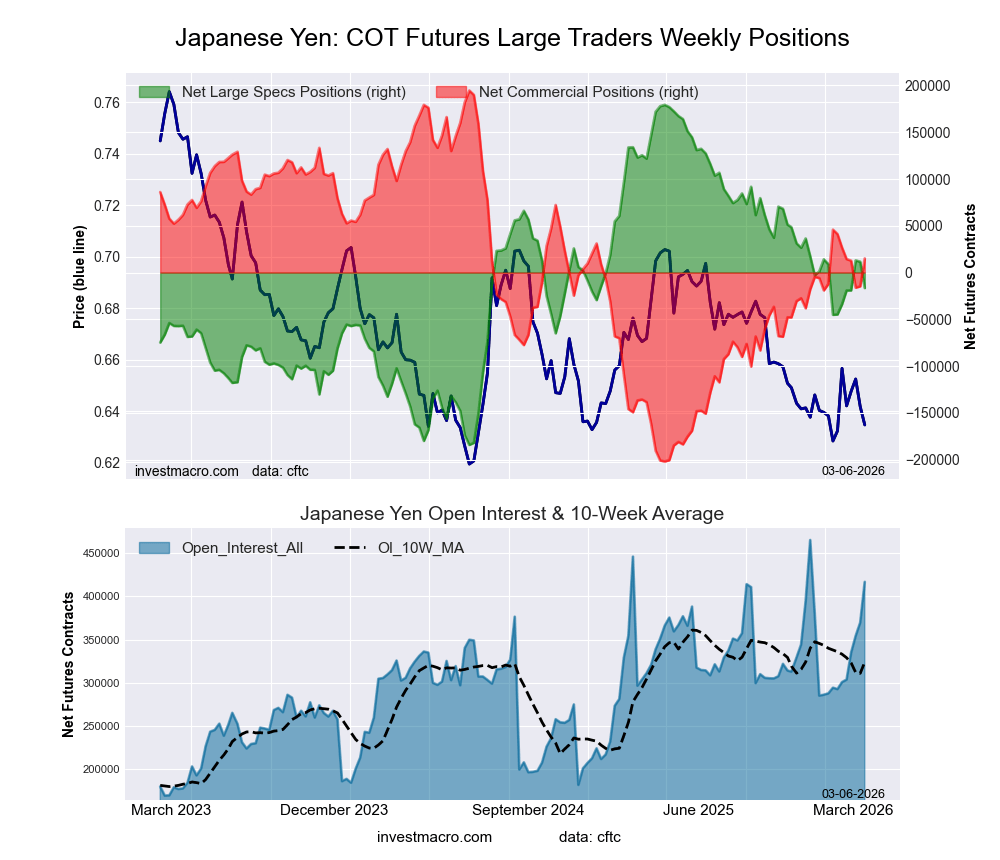 The Japanese Yen large speculator standing this week equaled a net position of -16,575 contracts in the data reported through Tuesday. This was a weekly decline of -28,114 contracts from the previous week which had a total of 11,539 net contracts.
This week’s current strength score (the trader positioning range over the past three years, measured from 0 to 100) shows the speculators are currently Bearish with a score of 46.1 percent. The commercials are Bullish with a score of 54.7 percent and the small traders (not shown in chart) are Bearish with a score of 40.8 percent.
Price Trend-Following Model: Strong Downtrend
Our weekly trend-following model classifies the current market price position as: Strong Downtrend.
| JAPANESE YEN Statistics | SPECULATORS | COMMERCIALS | SMALL TRADERS |
| – Percent of Open Interest Longs: | 32.4 | 44.6 | 9.5 |
| – Percent of Open Interest Shorts: | 36.3 | 41.0 | 9.1 |
| – Net Position: | -16,575 | 15,007 | 1,568 |
| – Gross Longs: | 134,945 | 186,027 | 39,530 |
| – Gross Shorts: | 151,520 | 171,020 | 37,962 |
| – Long to Short Ratio: | 0.9 to 1 | 1.1 to 1 | 1.0 to 1 |
| NET POSITION TREND: | | | |
| – Strength Index Score (3 Year Range Pct): | 46.1 | 54.7 | 40.8 |
| – Strength Index Reading (3 Year Range): | Bearish | Bullish | Bearish |
| NET POSITION MOVEMENT INDEX: | | | |
| – 6-Week Change in Strength Index: | 7.8 | -6.6 | -5.5 |
Swiss Franc Futures:
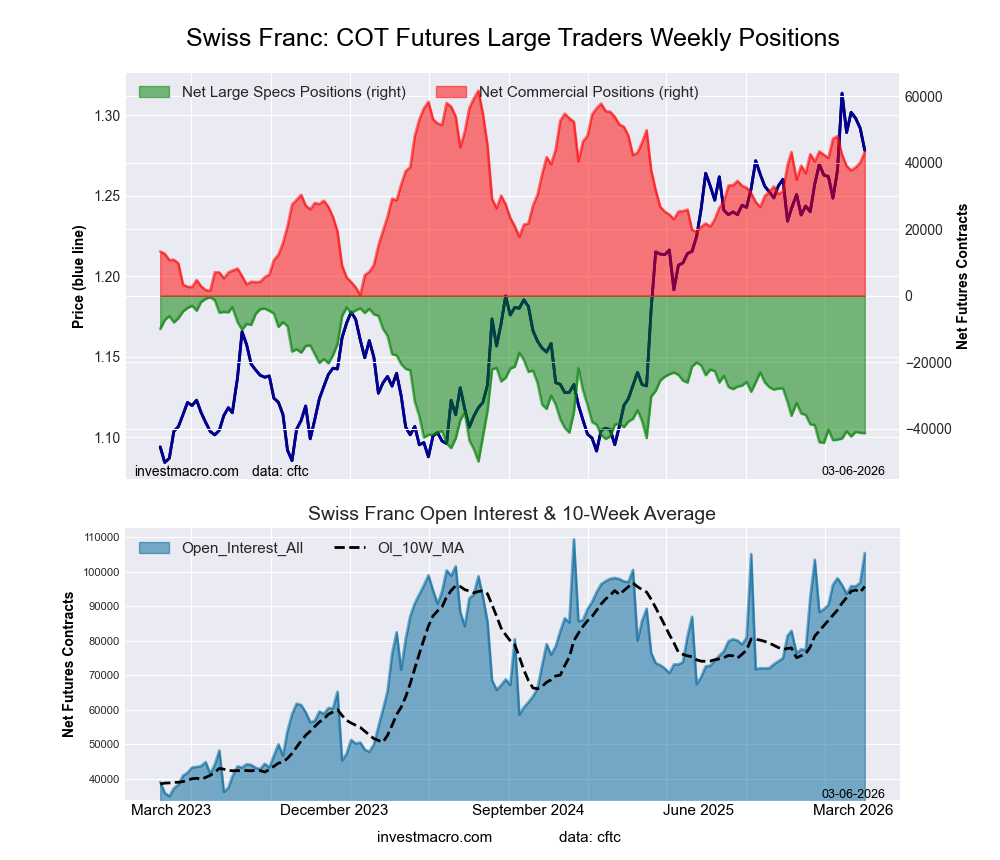 The Swiss Franc large speculator standing this week equaled a net position of -41,283 contracts in the data reported through Tuesday. This was a weekly fall of -97 contracts from the previous week which had a total of -41,186 net contracts.
This week’s current strength score (the trader positioning range over the past three years, measured from 0 to 100) shows the speculators are currently Bearish-Extreme with a score of 17.2 percent. The commercials are Bullish with a score of 70.0 percent and the small traders (not shown in chart) are Bullish with a score of 70.3 percent.
Price Trend-Following Model: Uptrend
Our weekly trend-following model classifies the current market price position as: Uptrend.
| SWISS FRANC Statistics | SPECULATORS | COMMERCIALS | SMALL TRADERS |
| – Percent of Open Interest Longs: | 11.8 | 68.6 | 14.6 |
| – Percent of Open Interest Shorts: | 50.9 | 27.6 | 16.5 |
| – Net Position: | -41,283 | 43,280 | -1,997 |
| – Gross Longs: | 12,390 | 72,324 | 15,357 |
| – Gross Shorts: | 53,673 | 29,044 | 17,354 |
| – Long to Short Ratio: | 0.2 to 1 | 2.5 to 1 | 0.9 to 1 |
| NET POSITION TREND: | | | |
| – Strength Index Score (3 Year Range Pct): | 17.2 | 70.0 | 70.3 |
| – Strength Index Reading (3 Year Range): | Bearish-Extreme | Bullish | Bullish |
| NET POSITION MOVEMENT INDEX: | | | |
| – 6-Week Change in Strength Index: | 3.9 | -7.6 | 11.7 |
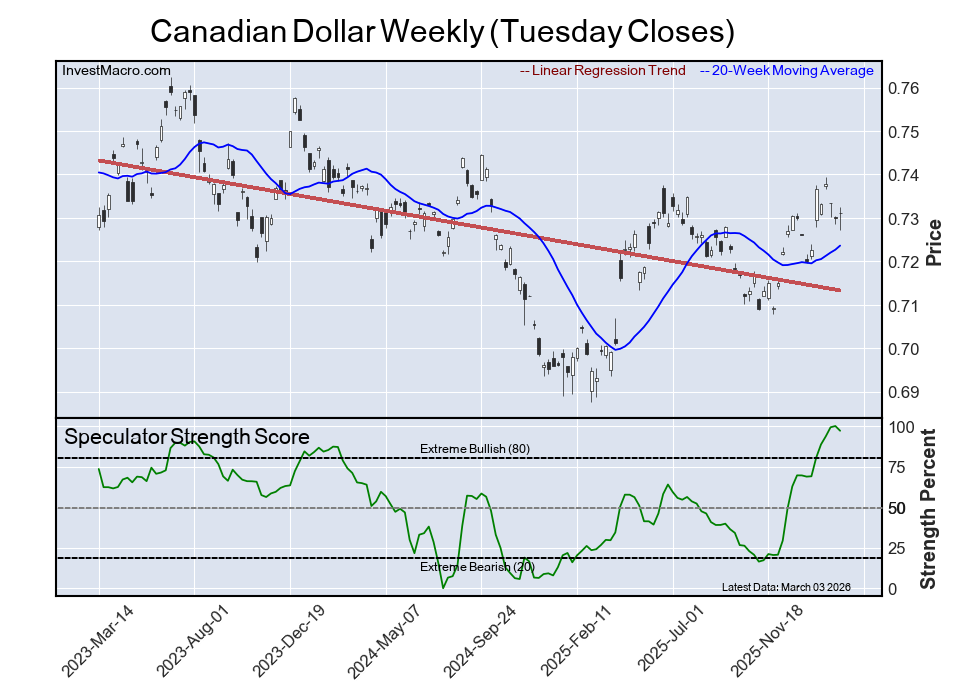
Canadian Dollar Futures:
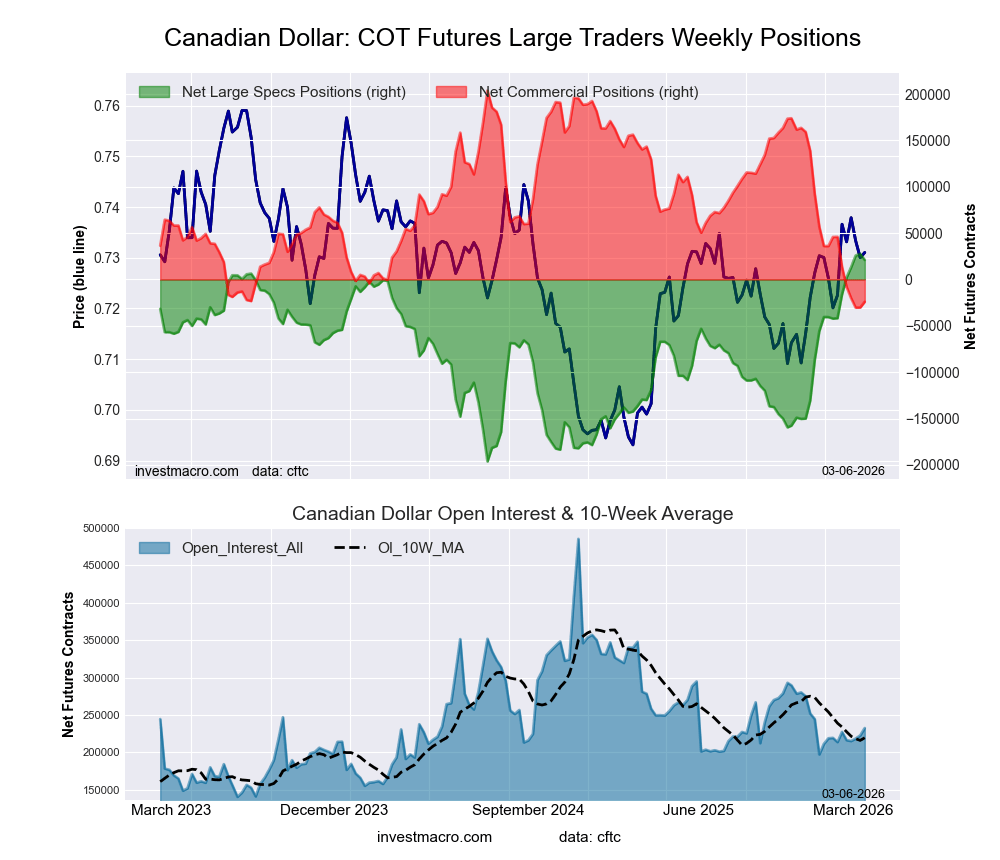 The Canadian Dollar large speculator standing this week equaled a net position of 21,050 contracts in the data reported through Tuesday. This was a weekly decline of -6,528 contracts from the previous week which had a total of 27,578 net contracts.
This week’s current strength score (the trader positioning range over the past three years, measured from 0 to 100) shows the speculators are currently Bullish-Extreme with a score of 97.1 percent. The commercials are Bearish-Extreme with a score of 2.7 percent and the small traders (not shown in chart) are Bullish with a score of 53.7 percent.
Price Trend-Following Model: Strong Uptrend
Our weekly trend-following model classifies the current market price position as: Strong Uptrend.
| CANADIAN DOLLAR Statistics | SPECULATORS | COMMERCIALS | SMALL TRADERS |
| – Percent of Open Interest Longs: | 40.4 | 43.5 | 12.9 |
| – Percent of Open Interest Shorts: | 31.4 | 53.8 | 11.6 |
| – Net Position: | 21,050 | -24,056 | 3,006 |
| – Gross Longs: | 94,008 | 101,029 | 30,071 |
| – Gross Shorts: | 72,958 | 125,085 | 27,065 |
| – Long to Short Ratio: | 1.3 to 1 | 0.8 to 1 | 1.1 to 1 |
| NET POSITION TREND: | | | |
| – Strength Index Score (3 Year Range Pct): | 97.1 | 2.7 | 53.7 |
| – Strength Index Reading (3 Year Range): | Bullish-Extreme | Bearish-Extreme | Bullish |
| NET POSITION MOVEMENT INDEX: | | | |
| – 6-Week Change in Strength Index: | 28.1 | -29.9 | 20.1 |
Australian Dollar Futures:
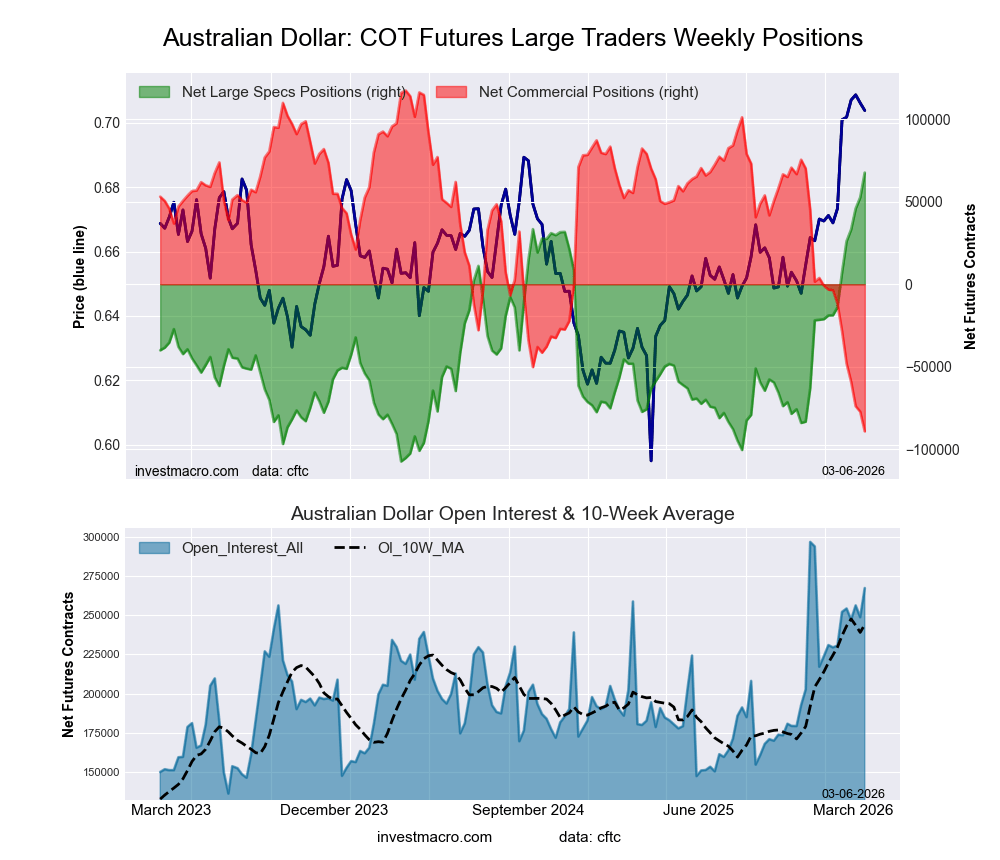 The Australian Dollar large speculator standing this week equaled a net position of 67,762 contracts in the data reported through Tuesday. This was a weekly increase of 15,118 contracts from the previous week which had a total of 52,644 net contracts.
This week’s current strength score (the trader positioning range over the past three years, measured from 0 to 100) shows the speculators are currently Bullish-Extreme with a score of 100.0 percent. The commercials are Bearish-Extreme with a score of 0.0 percent and the small traders (not shown in chart) are Bullish-Extreme with a score of 85.9 percent.
Price Trend-Following Model: Uptrend
Our weekly trend-following model classifies the current market price position as: Uptrend.
| AUSTRALIAN DOLLAR Statistics | SPECULATORS | COMMERCIALS | SMALL TRADERS |
| – Percent of Open Interest Longs: | 51.1 | 27.3 | 15.2 |
| – Percent of Open Interest Shorts: | 25.7 | 60.7 | 7.1 |
| – Net Position: | 67,762 | -89,249 | 21,487 |
| – Gross Longs: | 136,515 | 72,991 | 40,551 |
| – Gross Shorts: | 68,753 | 162,240 | 19,064 |
| – Long to Short Ratio: | 2.0 to 1 | 0.4 to 1 | 2.1 to 1 |
| NET POSITION TREND: | | | |
| – Strength Index Score (3 Year Range Pct): | 100.0 | 0.0 | 85.9 |
| – Strength Index Reading (3 Year Range): | Bullish-Extreme | Bearish-Extreme | Bullish-Extreme |
| NET POSITION MOVEMENT INDEX: | | | |
| – 6-Week Change in Strength Index: | 46.6 | -37.5 | -9.2 |
New Zealand Dollar Futures:
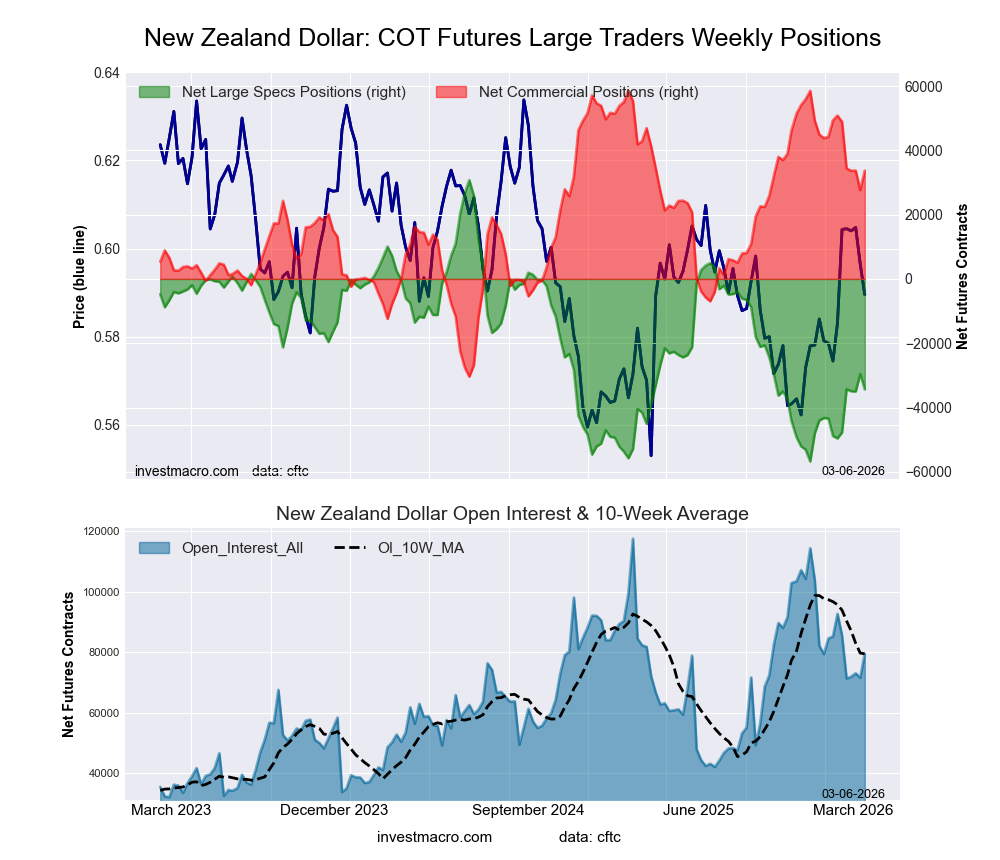 The New Zealand Dollar large speculator standing this week equaled a net position of -34,334 contracts in the data reported through Tuesday. This was a weekly lowering of -4,767 contracts from the previous week which had a total of -29,567 net contracts.
This week’s current strength score (the trader positioning range over the past three years, measured from 0 to 100) shows the speculators are currently Bearish with a score of 25.6 percent. The commercials are Bullish with a score of 72.0 percent and the small traders (not shown in chart) are Bullish with a score of 60.7 percent.
Price Trend-Following Model: Weak Uptrend
Our weekly trend-following model classifies the current market price position as: Weak Uptrend.
| NEW ZEALAND DOLLAR Statistics | SPECULATORS | COMMERCIALS | SMALL TRADERS |
| – Percent of Open Interest Longs: | 16.6 | 69.6 | 5.5 |
| – Percent of Open Interest Shorts: | 59.8 | 27.2 | 4.7 |
| – Net Position: | -34,334 | 33,689 | 645 |
| – Gross Longs: | 13,176 | 55,324 | 4,396 |
| – Gross Shorts: | 47,510 | 21,635 | 3,751 |
| – Long to Short Ratio: | 0.3 to 1 | 2.6 to 1 | 1.2 to 1 |
| NET POSITION TREND: | | | |
| – Strength Index Score (3 Year Range Pct): | 25.6 | 72.0 | 60.7 |
| – Strength Index Reading (3 Year Range): | Bearish | Bullish | Bullish |
| NET POSITION MOVEMENT INDEX: | | | |
| – 6-Week Change in Strength Index: | 17.5 | -19.2 | 24.0 |
Mexican Peso Futures:
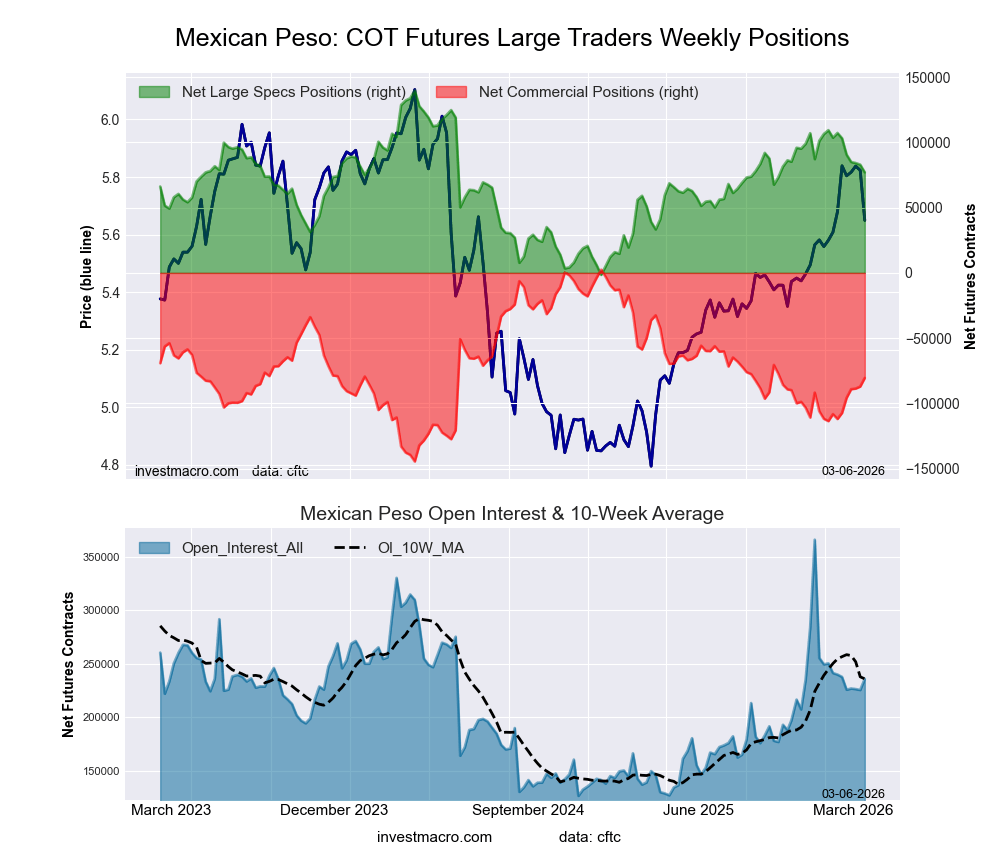 The Mexican Peso large speculator standing this week equaled a net position of 77,043 contracts in the data reported through Tuesday. This was a weekly decline of -5,837 contracts from the previous week which had a total of 82,880 net contracts.
This week’s current strength score (the trader positioning range over the past three years, measured from 0 to 100) shows the speculators are currently Bullish with a score of 55.6 percent. The commercials are Bearish with a score of 43.5 percent and the small traders (not shown in chart) are Bearish with a score of 42.0 percent.
Price Trend-Following Model: Uptrend
Our weekly trend-following model classifies the current market price position as: Uptrend.
| MEXICAN PESO Statistics | SPECULATORS | COMMERCIALS | SMALL TRADERS |
| – Percent of Open Interest Longs: | 53.6 | 38.0 | 2.5 |
| – Percent of Open Interest Shorts: | 21.0 | 72.1 | 1.0 |
| – Net Position: | 77,043 | -80,516 | 3,473 |
| – Gross Longs: | 126,531 | 89,636 | 5,852 |
| – Gross Shorts: | 49,488 | 170,152 | 2,379 |
| – Long to Short Ratio: | 2.6 to 1 | 0.5 to 1 | 2.5 to 1 |
| NET POSITION TREND: | | | |
| – Strength Index Score (3 Year Range Pct): | 55.6 | 43.5 | 42.0 |
| – Strength Index Reading (3 Year Range): | Bullish | Bearish | Bearish |
| NET POSITION MOVEMENT INDEX: | | | |
| – 6-Week Change in Strength Index: | -21.3 | 21.4 | -7.3 |
Brazilian Real Futures:
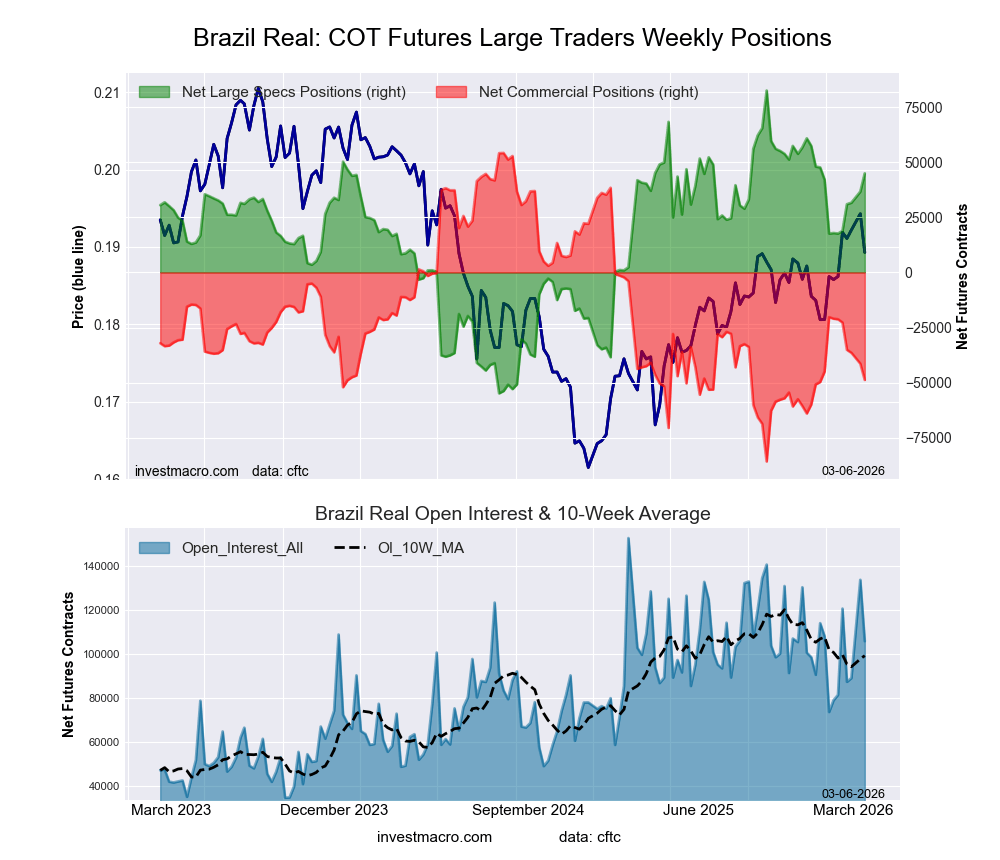 The Brazilian Real large speculator standing this week equaled a net position of 44,970 contracts in the data reported through Tuesday. This was a weekly advance of 8,296 contracts from the previous week which had a total of 36,674 net contracts.
This week’s current strength score (the trader positioning range over the past three years, measured from 0 to 100) shows the speculators are currently Bullish with a score of 72.7 percent. The commercials are Bearish with a score of 26.4 percent and the small traders (not shown in chart) are Bearish with a score of 42.4 percent.
Price Trend-Following Model: Uptrend
Our weekly trend-following model classifies the current market price position as: Uptrend.
| BRAZIL REAL Statistics | SPECULATORS | COMMERCIALS | SMALL TRADERS |
| – Percent of Open Interest Longs: | 67.4 | 27.5 | 4.5 |
| – Percent of Open Interest Shorts: | 24.9 | 73.6 | 0.9 |
| – Net Position: | 44,970 | -48,793 | 3,823 |
| – Gross Longs: | 71,267 | 29,032 | 4,810 |
| – Gross Shorts: | 26,297 | 77,825 | 987 |
| – Long to Short Ratio: | 2.7 to 1 | 0.4 to 1 | 4.9 to 1 |
| NET POSITION TREND: | | | |
| – Strength Index Score (3 Year Range Pct): | 72.7 | 26.4 | 42.4 |
| – Strength Index Reading (3 Year Range): | Bullish | Bearish | Bearish |
| NET POSITION MOVEMENT INDEX: | | | |
| – 6-Week Change in Strength Index: | 19.9 | -19.7 | 1.1 |
Bitcoin Futures:
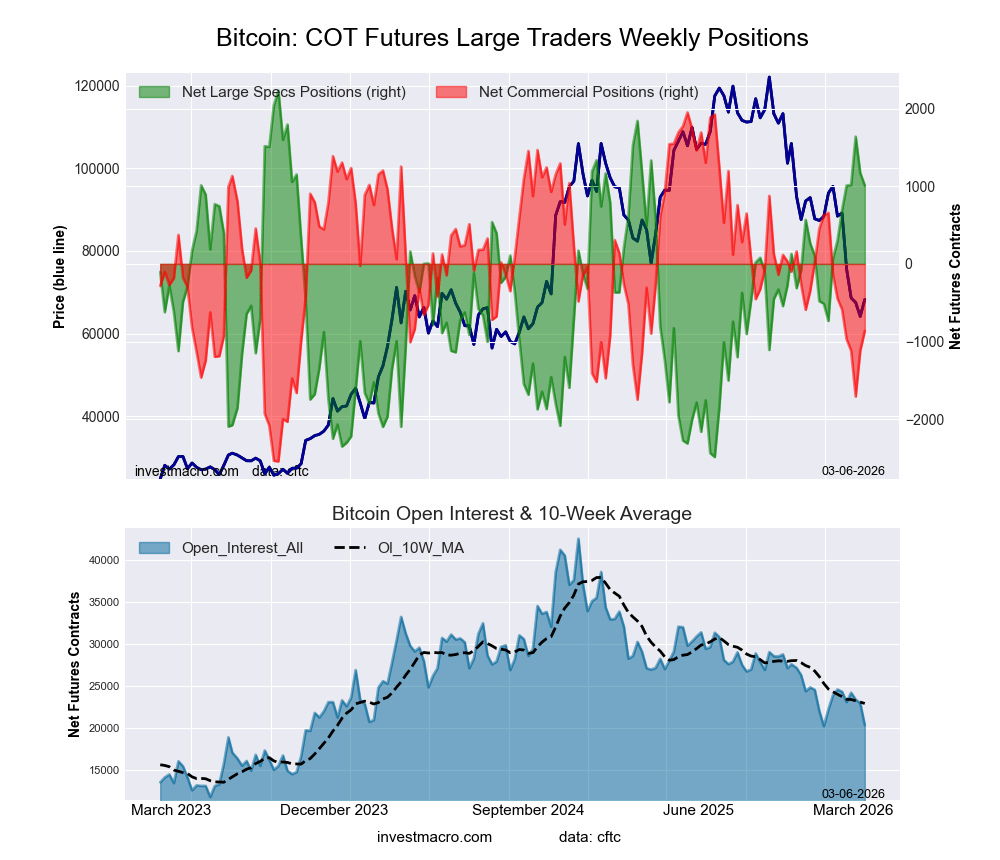 The Bitcoin large speculator standing this week equaled a net position of 1,011 contracts in the data reported through Tuesday. This was a weekly fall of -161 contracts from the previous week which had a total of 1,172 net contracts.
This week’s current strength score (the trader positioning range over the past three years, measured from 0 to 100) shows the speculators are currently Bullish with a score of 74.1 percent. The commercials are Bearish with a score of 37.4 percent and the small traders (not shown in chart) are Bearish with a score of 29.6 percent.
Price Trend-Following Model: Strong Downtrend
Our weekly trend-following model classifies the current market price position as: Strong Downtrend.
| BITCOIN Statistics | SPECULATORS | COMMERCIALS | SMALL TRADERS |
| – Percent of Open Interest Longs: | 76.8 | 3.7 | 5.7 |
| – Percent of Open Interest Shorts: | 71.8 | 7.9 | 6.4 |
| – Net Position: | 1,011 | -862 | -149 |
| – Gross Longs: | 15,585 | 751 | 1,149 |
| – Gross Shorts: | 14,574 | 1,613 | 1,298 |
| – Long to Short Ratio: | 1.1 to 1 | 0.5 to 1 | 0.9 to 1 |
| NET POSITION TREND: | | | |
| – Strength Index Score (3 Year Range Pct): | 74.1 | 37.4 | 29.6 |
| – Strength Index Reading (3 Year Range): | Bullish | Bearish | Bearish |
| NET POSITION MOVEMENT INDEX: | | | |
| – 6-Week Change in Strength Index: | 15.1 | -9.3 | -15.3 |
Article By InvestMacro – Receive our weekly COT Newsletter
*COT Report: The COT data, released weekly to the public each Friday, is updated through the most recent Tuesday (data is 3 days old) and shows a quick view of how large speculators or non-commercials (for-profit traders) were positioned in the futures markets.
The CFTC categorizes trader positions according to commercial hedgers (traders who use futures contracts for hedging as part of the business), non-commercials (large traders who speculate to realize trading profits) and nonreportable traders (usually small traders/speculators) as well as their open interest (contracts open in the market at time of reporting). See CFTC criteria here.