By InvestMacro

Here are the latest charts and statistics for the Commitment of Traders (COT) data published by the Commodities Futures Trading Commission (CFTC).
The latest COT data is updated through Tuesday July 7th and shows a quick view of how large market participants (for-profit speculators and commercial traders) were positioned in the futures markets. All currency positions are in direct relation to the US dollar where, for example, a bet for the euro is a bet that the euro will rise versus the dollar while a bet against the euro will be a bet that the euro will decline versus the dollar.
Weekly Speculator Changes led by Japanese Yen & British Pound
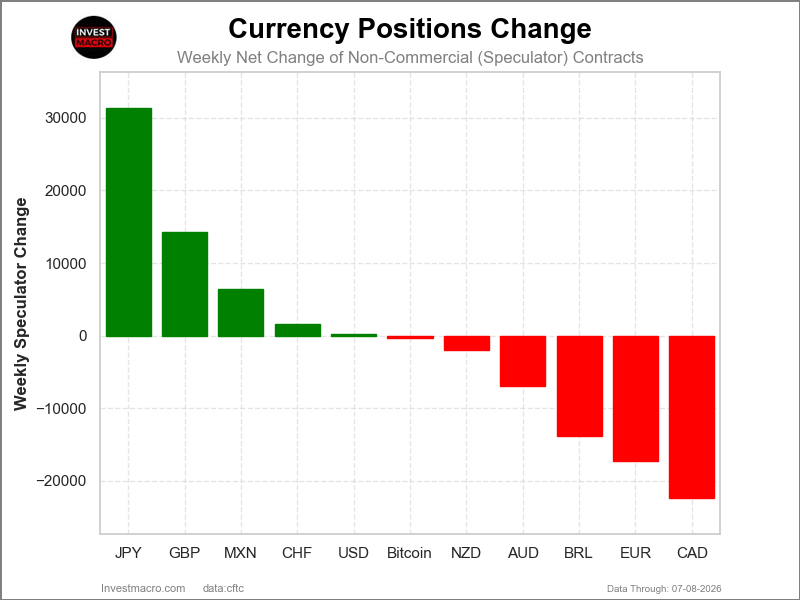
The COT currency market speculator bets were lower this week as five out of the eleven currency markets we cover had higher positioning while the other six markets had lower speculator contracts.
Leading the gains for the currency markets was the Japanese Yen (31,314 contracts) with the British Pound (14,244 contracts), Mexican Peso (6,421 contracts), Swiss Franc (1,544 contracts), US Dollar Index (253 contracts) and the Bitcoin (-270 contracts) also showing positive weeks.
The currencies seeing declines in speculator bets on the week were the Canadian Dollar (-22,320 contracts) and the EuroFX (-17,326 contracts) with the Brazilian Real (-13,826 contracts), Australian Dollar (-6,951 contracts) and the New Zealand Dollar (-1,909 contracts) also registering lower bets on the week.
COT Currencies: Euro Bets go Bearish, New Zealand Dollar Bets hit Record Low
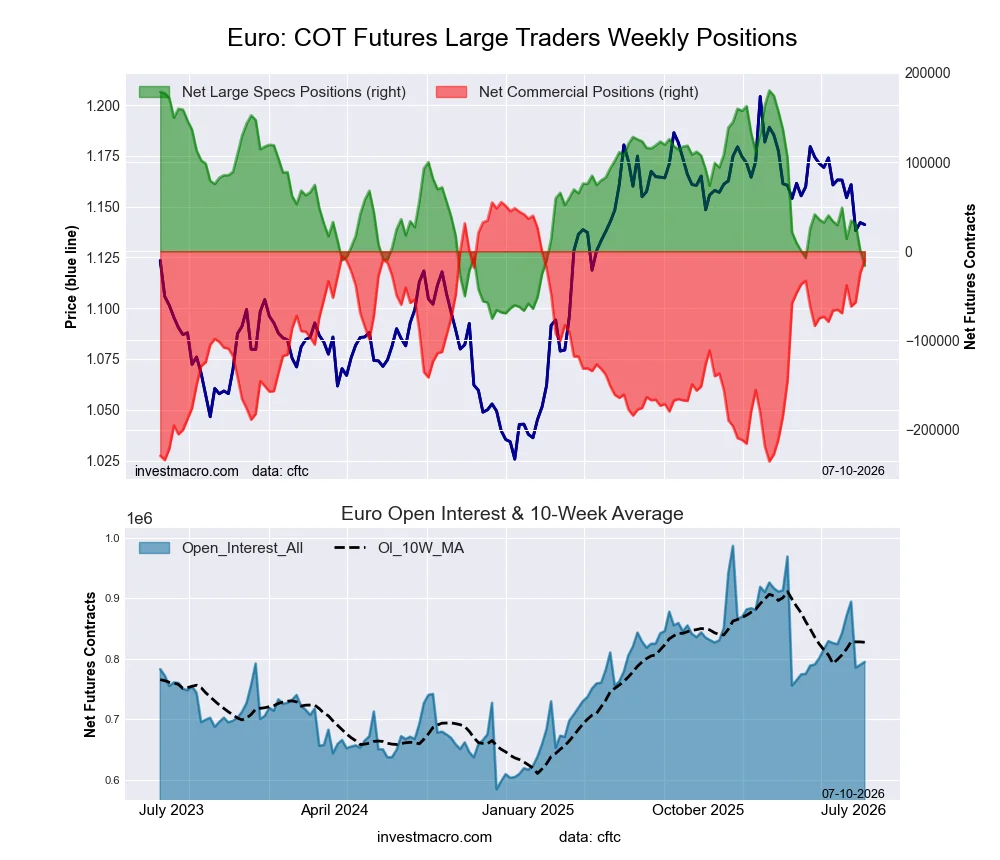
Highlighting major Currency speculator positions this week was the Euro, which saw speculator positions fall into a bearish territory this week for the first time since a brief dip into bearish territory in April. Overall, the Euro positions have now only seen two bearish positions out of the past 70 weeks. This week, Euro speculator bets fell for a third consecutive week and for the second week where bets fell by more than -17,000 contracts and this has brought the overall net position to a -16,227 net contract level. The recent Euro weakness has been a rather swift turnaround for the Euro, which started off the year of 2026 with extremely bullish positions that were routinely above +100,000 net contracts (+180,305 net contracts on February 10th). However, in March, the Euro position started to deteriorate and fall sharply, with the net position falling by a total of -121,371 contracts over the past 17 weeks dating back to March 10th.
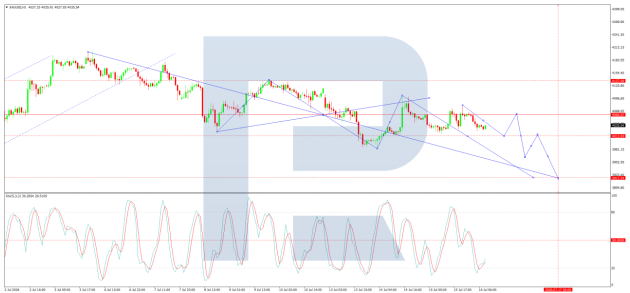
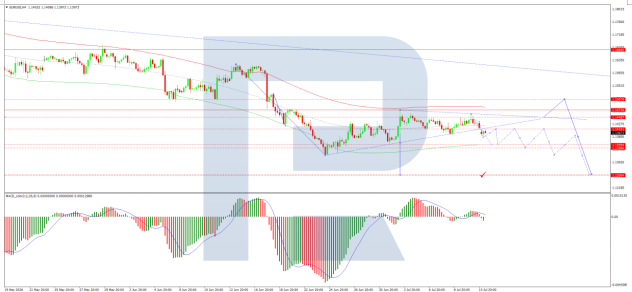
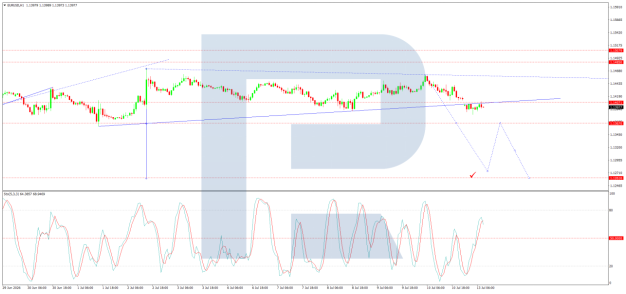
In the Forex markets, and despite the sharp drop-off in speculator positions, the Euro exchange rate has continued to be relatively stable with this week’s close around 1.1445. This is slightly below the sideways trading range that had prevailed for roughly a year with 1.15 support on the downside and 1.1950 resistance on the upside. The 1.15 significant level may turn into a strong resistance level for future price action.
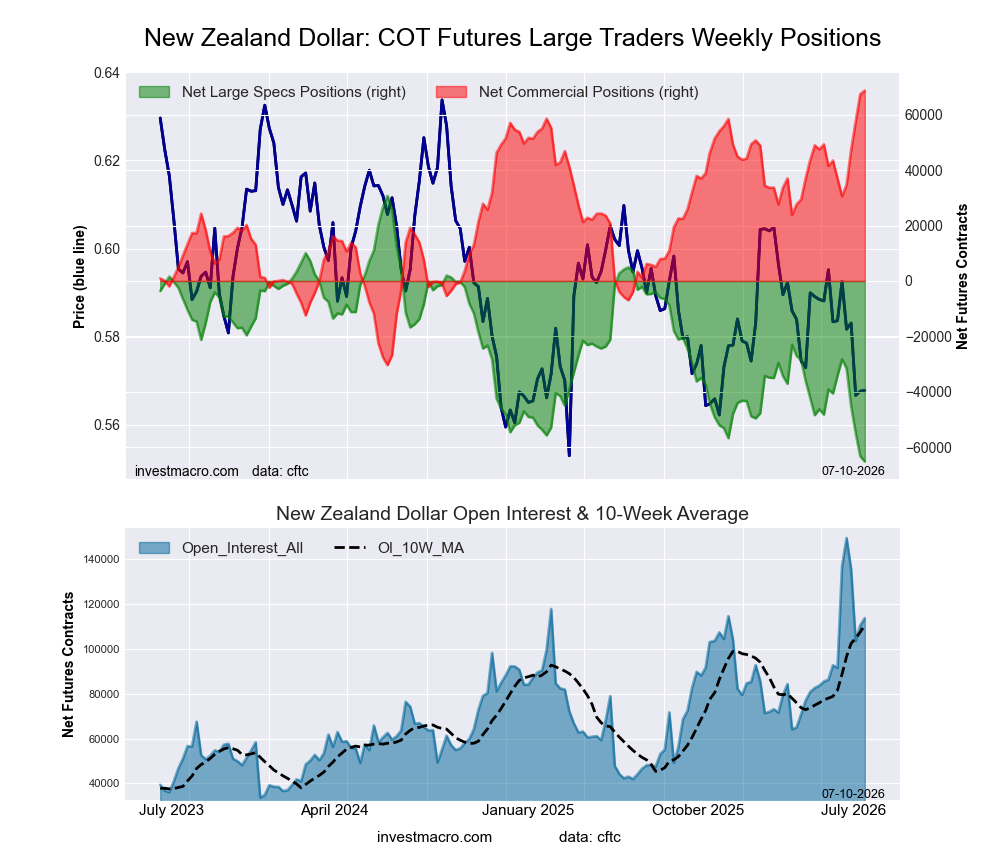
The New Zealand Dollar this week continued to fall for a fifth consecutive week and now has dropped to an all-time record low of -65,189 net contracts. Overall, the New Zealand Dollar has now been in a bearish position for just about a year, with the last bullish position dating back to July 15th of 2025. In Forex trading markets against the US Dollar, the New Zealand Dollar rose for a second consecutive week this week. However, the currency, in the big scheme of things, has been in a downtrend since falling below its 200-weekly moving average in 2022. In the past year, the currency has been in a sideways trading range that has seen support around the 0.5600 level, while there has been strong resistance at the 0.6050 threshold. This week’s close was at the 0.5775 price level.
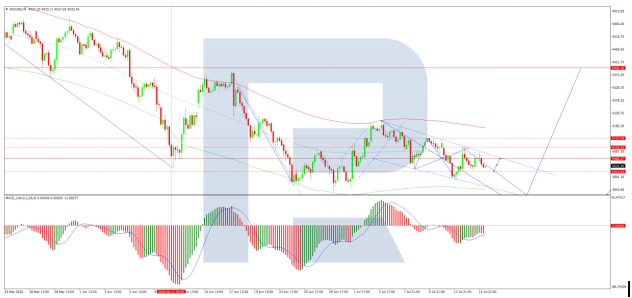
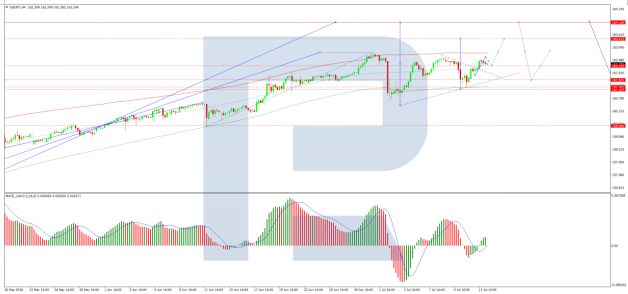
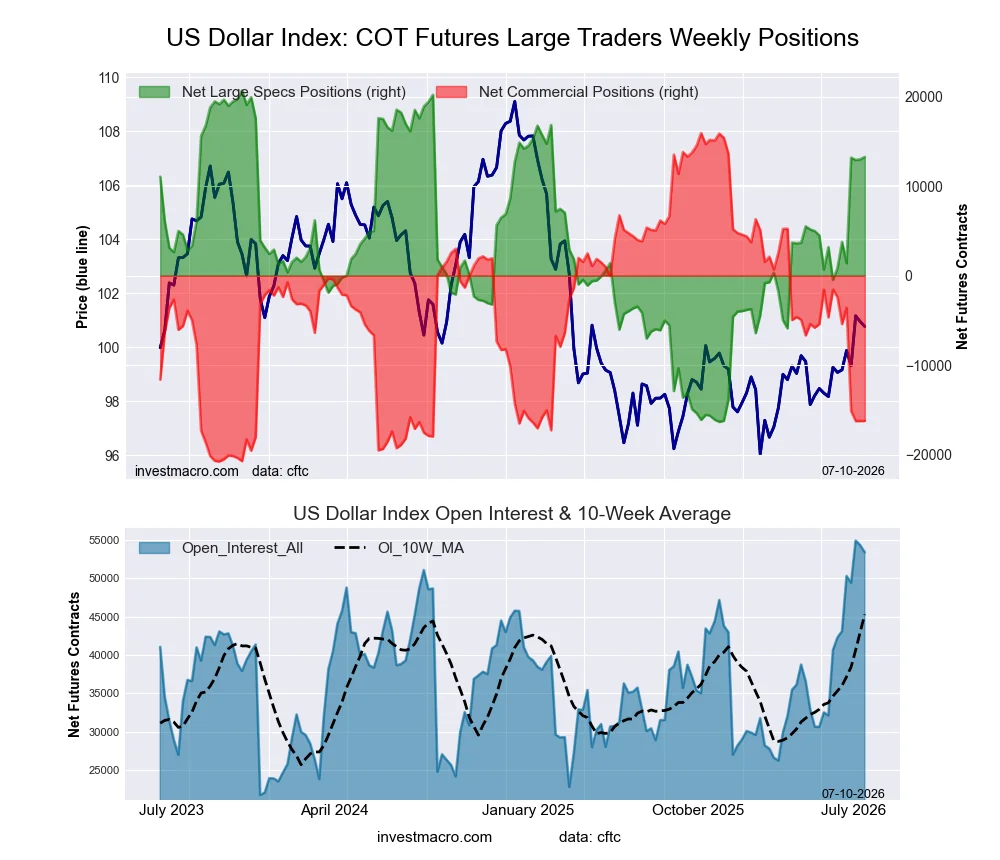
Next up, the US Dollar Index has continued to see speculator bets improve with a very modest rise this week of just 253 contracts. This edge higher has brought the overall net position now to a total of 13,269 net contracts which is the highest bullish position for the US Dollar Index in over a year, dating back to March of 2025. The US Dollar Index in the Foreign Exchange markets, much like the Euro, has broken out of its sideways trading range (to the upside though) that was capped around the 100.20 level previously. This week, the DXY closed at the 100.75 exchange rate and will look to use the previous resistance as a support level to trend higher.
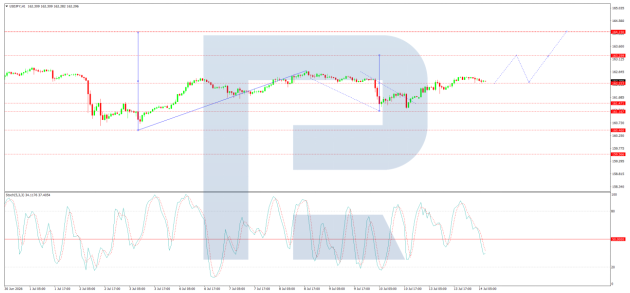
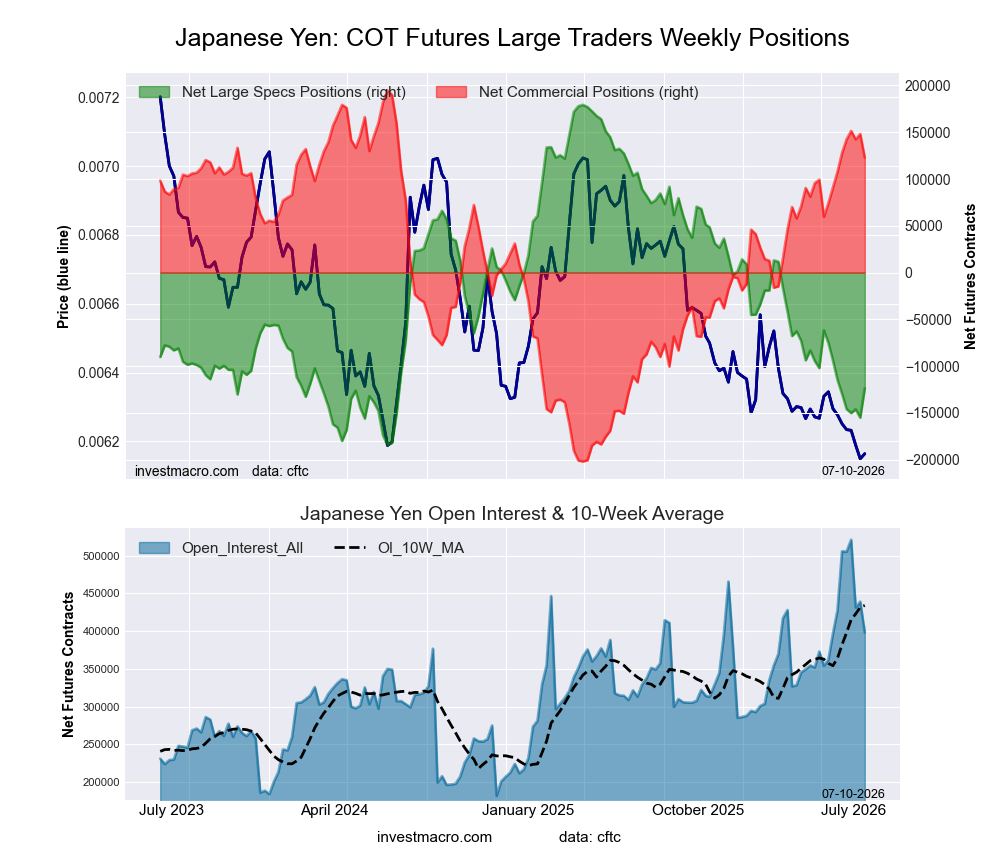
The Japanese Yen speculative bets surged this week by over 30,000 contracts. This is the second gain out of the past three weeks. However, the Japanese Yen speculator position is extremely bearish as the overall net position has been more than -100,000 net contracts for seven consecutive weeks. In the Forex markets, the Japanese Yen has been extremely weak as well, and is trading around its 40-year lows against the US Dollar. The USDJPY currency pair closed out the week at 161.66, which registers as a historically strong US Dollar weekly close against the Japanese Yen.
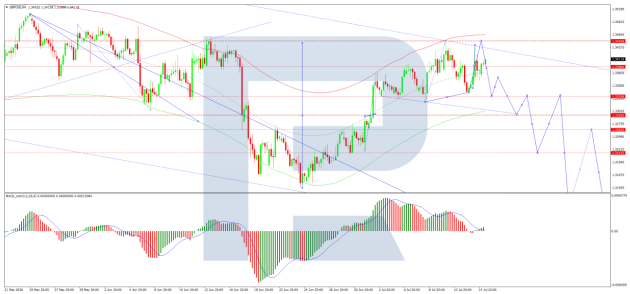
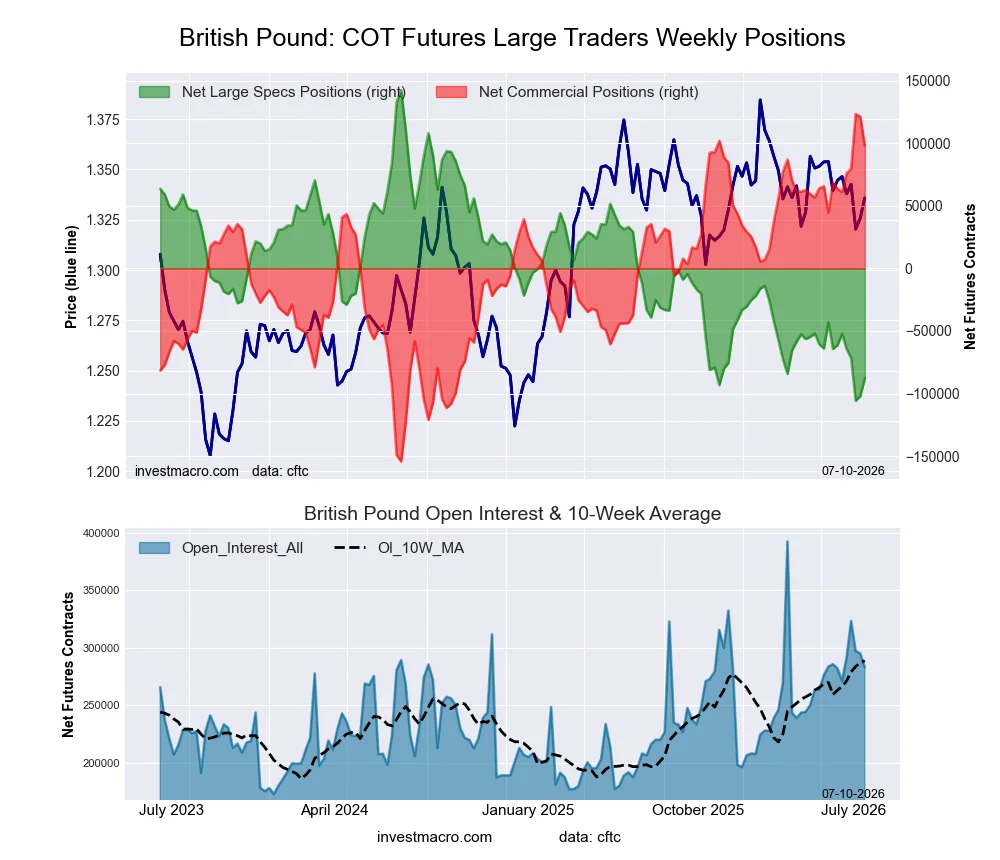
The British Pound Sterling speculative bets rose this week by over 14,000 net contracts and advanced for a second consecutive week. The British Pound Sterling net standing has been very weak as well with extreme bearish positions and settled in at a -87,903 net speculator contracts this week. The improvement in speculator bets this week took the GBP position out of a -100,000 net contract position that had prevailed the previous two weeks but overall, the GBP speculator positioning has now been in negative territory for 50 consecutive weeks, dating back to the last bullish reading on July 22nd of 2025. In the Forex markets, the British Pound Sterling has risen for two consecutive weeks and remains in a sideways trading band that has a support level of 1.3150 and a resistance level on the top side at 1.3750. This week, the GBP against the US Dollar closed at 1.3399.
The New Zealand Dollar leads Currency Market price performances
The major Currency Markets’ price performances were led this week by the New Zealand Dollar, which rose by 1.33%. Next up, the Brazilian Real was also higher than 1% with a 1.14% increase. Bitcoin was marginally higher by 0.71%, followed by the British Pound Sterling, which rose by 0.42% on the week.
The Australian Dollar saw an uptick by 0.35%, followed by the Canadian Dollar, which saw a similar edge higher by 0.34%. The US Dollar Index was virtually unchanged, but a bit higher at 0.09%, while the Japanese Yen saw virtually no change on the week.
On the downside, the Mexican Peso edged lower by -0.06% and was followed by the Euro, which dipped ever so slightly by -0.14%.
The biggest decliner on the week was the Swiss Franc with a modest decline of -0.57%.
Currencies Data:
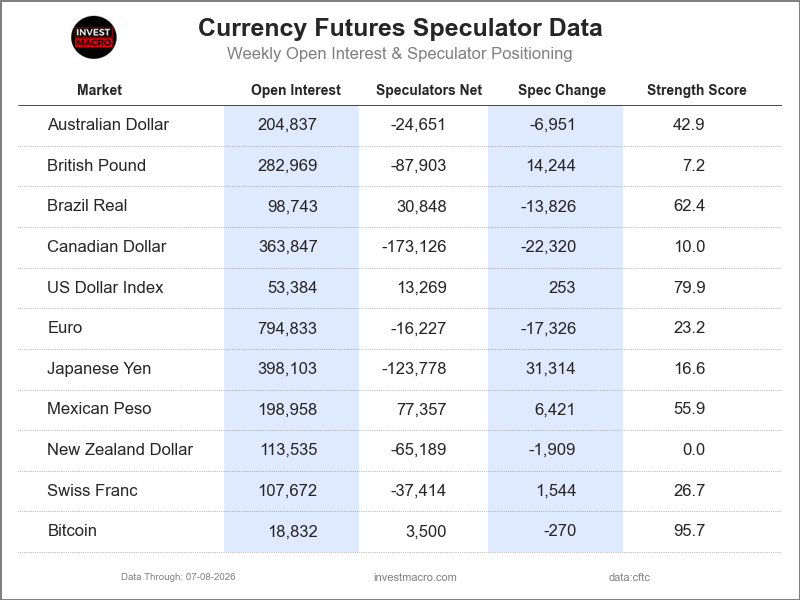
Legend: Open Interest | Speculators Current Net Position | Weekly Specs Change | Specs Strength Score compared to last 3-Years (0-100 range)
Strength Scores led by Bitcoin & US Dollar Index
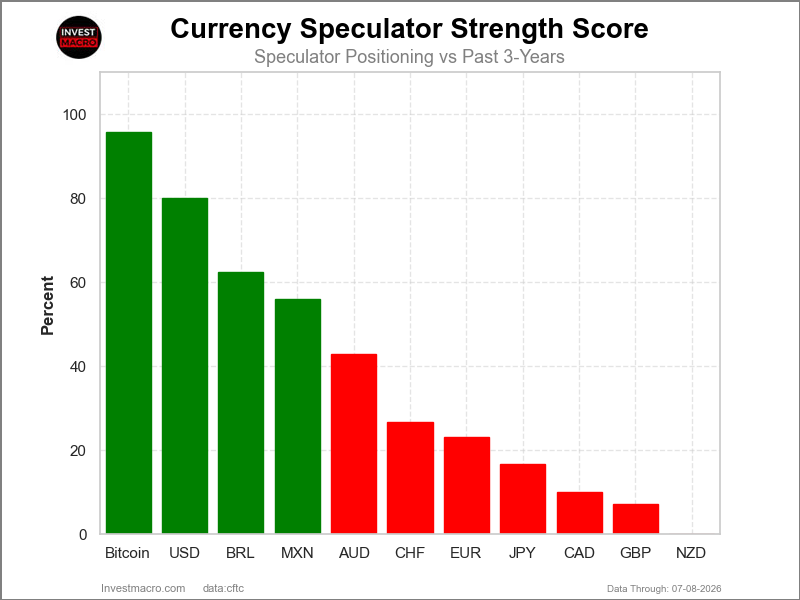
COT Strength Scores (a normalized measure of Speculator positions over a 3-Year range, from 0 to 100 where above 80 is Extreme-Bullish and below 20 is Extreme-Bearish) showed that Bitcoin (96 percent) and the US Dollar Index (80 percent) lead the currency markets this week. The Brazilian Real (62 percent) and the Mexican Peso (56 percent) come in as the next highest in the weekly strength scores.
On the downside, the New Zealand Dollar (0 percent), the British Pound (7 percent), the Canadian Dollar (10 percent) and the Japanese Yen (17 percent) come in at the lowest strength levels currently and are in Extreme-Bearish territory (below 20 percent).
3-Year Strength Statistics:
US Dollar Index (79.9 percent) vs US Dollar Index previous week (79.3 percent)
EuroFX (23.2 percent) vs EuroFX previous week (30.0 percent)
British Pound Sterling (7.2 percent) vs British Pound Sterling previous week (1.4 percent)
Japanese Yen (16.6 percent) vs Japanese Yen previous week (8.0 percent)
Swiss Franc (26.7 percent) vs Swiss Franc previous week (23.4 percent)
Canadian Dollar (10.0 percent) vs Canadian Dollar previous week (19.6 percent)
Australian Dollar (42.9 percent) vs Australian Dollar previous week (46.5 percent)
New Zealand Dollar (0.0 percent) vs New Zealand Dollar previous week (2.0 percent)
Mexican Peso (55.9 percent) vs Mexican Peso previous week (51.3 percent)
Brazilian Real (62.4 percent) vs Brazilian Real previous week (72.4 percent)
Bitcoin (95.7 percent) vs Bitcoin previous week (100.0 percent)
US Dollar Index & Bitcoin top the 6-Week Strength Trends
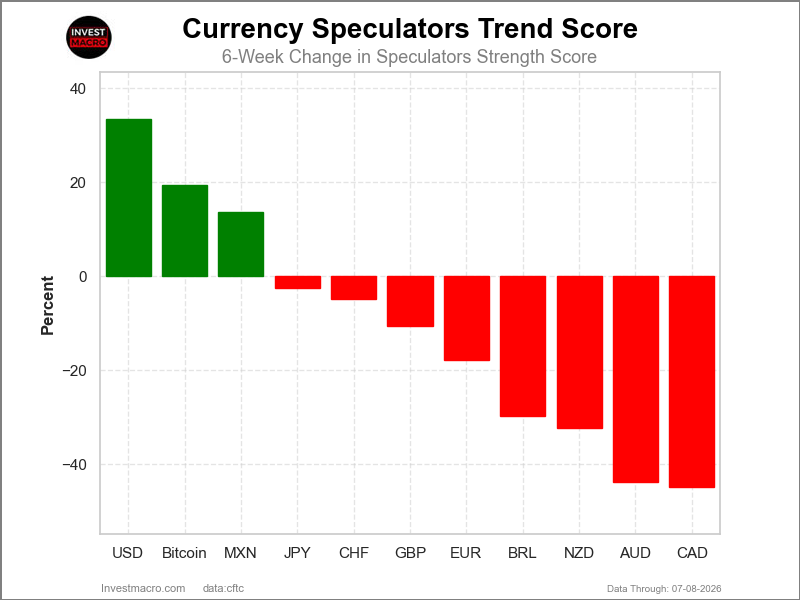
COT Strength Score Trends (or move index, calculates the 6-week changes in strength scores) showed that the US Dollar Index (34 percent) and Bitcoin (19 percent) lead the past six weeks trends for the currencies. The Mexican Peso (14 percent) comes in as the next highest positive mover in the 3-Year trends data.
The Canadian Dollar (-45 percent) leads the downside trend scores currently with the Australian Dollar (-44 percent), New Zealand Dollar (-32 percent) and the Brazilian Real (-30 percent) following next with lower trend scores.
3-Year Strength Trends:
US Dollar Index (33.5 percent) vs US Dollar Index previous week (36.4 percent)
EuroFX (-17.8 percent) vs EuroFX previous week (-12.7 percent)
British Pound Sterling (-10.7 percent) vs British Pound Sterling previous week (-15.3 percent)
Japanese Yen (-2.5 percent) vs Japanese Yen previous week (-16.8 percent)
Swiss Franc (-4.9 percent) vs Swiss Franc previous week (-4.4 percent)
Canadian Dollar (-44.9 percent) vs Canadian Dollar previous week (-51.4 percent)
Australian Dollar (-43.9 percent) vs Australian Dollar previous week (-53.5 percent)
New Zealand Dollar (-32.3 percent) vs New Zealand Dollar previous week (-23.6 percent)
Mexican Peso (13.6 percent) vs Mexican Peso previous week (6.2 percent)
Brazilian Real (-29.7 percent) vs Brazilian Real previous week (-19.2 percent)
Bitcoin (19.5 percent) vs Bitcoin previous week (26.5 percent)
Individual COT Forex Markets:
US Dollar Index Futures:
 Positioning Notes:
- US Dollar Index large speculator standing this week reached a net position of 13,269 contracts in the data reported through Tuesday.
- Weekly Speculator position boost of 253 contracts from the previous week which had a total of 13,016 net contracts.
- This week’s current strength score (range over the past 3 years, measured from 0 to 100) shows the speculators are currently Bullish with a score of 79.9 percent.
- The Commercials are Bearish-Extreme with a score of 12.4 percent.
- The Small Traders (not shown in chart) are Bullish-Extreme with a score of 93.7 percent.
Price Trend-Following Model: Strong Uptrend
Our weekly trend-following model classifies the current market price position as: Strong Uptrend.
| US DOLLAR INDEX Statistics | SPECULATORS | COMMERCIALS | SMALL TRADERS |
| – Percent of Open Interest Longs: | 59.8 | 28.9 | 8.2 |
| – Percent of Open Interest Shorts: | 34.9 | 59.4 | 2.7 |
| – Net Position: | 13,269 | -16,238 | 2,969 |
| – Gross Longs: | 31,921 | 15,452 | 4,401 |
| – Gross Shorts: | 18,652 | 31,690 | 1,432 |
| – Long to Short Ratio: | 1.7 to 1 | 0.5 to 1 | 3.1 to 1 |
| NET POSITION TREND: | | | |
| – Strength Index Score (3 Year Range Pct): | 79.9 | 12.4 | 93.7 |
| – Strength Index Reading (3 Year Range): | Bullish | Bearish-Extreme | Bullish-Extreme |
| NET POSITION MOVEMENT INDEX: | | | |
| – 6-Week Change in Strength Index: | 33.5 | -37.7 | 25.3 |
Euro Currency Futures:
 Positioning Notes:
- Euro Currency large speculator standing this week reached a net position of -16,227 contracts in the data reported through Tuesday.
- Weekly Speculator position decline of -17,326 contracts from the previous week which had a total of 1,099 net contracts.
- This week’s current strength score (range over the past 3 years, measured from 0 to 100) shows the speculators are currently Bearish with a score of 23.2 percent.
- The Commercials are Bullish with a score of 77.6 percent.
- The Small Traders (not shown in chart) are Bearish with a score of 29.9 percent.
Price Trend-Following Model: Strong Downtrend
Our weekly trend-following model classifies the current market price position as: Strong Downtrend.
| EURO Currency Statistics | SPECULATORS | COMMERCIALS | SMALL TRADERS |
| – Percent of Open Interest Longs: | 28.1 | 58.0 | 10.5 |
| – Percent of Open Interest Shorts: | 30.2 | 59.2 | 7.2 |
| – Net Position: | -16,227 | -10,024 | 26,251 |
| – Gross Longs: | 223,430 | 460,669 | 83,533 |
| – Gross Shorts: | 239,657 | 470,693 | 57,282 |
| – Long to Short Ratio: | 0.9 to 1 | 1.0 to 1 | 1.5 to 1 |
| NET POSITION TREND: | | | |
| – Strength Index Score (3 Year Range Pct): | 23.2 | 77.6 | 29.9 |
| – Strength Index Reading (3 Year Range): | Bearish | Bullish | Bearish |
| NET POSITION MOVEMENT INDEX: | | | |
| – 6-Week Change in Strength Index: | -17.8 | 19.1 | -20.8 |
British Pound Sterling Futures:
 Positioning Notes:
- British Pound Sterling large speculator standing this week reached a net position of -87,903 contracts in the data reported through Tuesday.
- Weekly Speculator position boost of 14,244 contracts from the previous week which had a total of -102,147 net contracts.
- This week’s current strength score (range over the past 3 years, measured from 0 to 100) shows the speculators are currently Bearish-Extreme with a score of 7.2 percent.
- The Commercials are Bullish-Extreme with a score of 91.0 percent.
- The Small Traders (not shown in chart) are Bearish with a score of 26.1 percent.
Price Trend-Following Model: Uptrend
Our weekly trend-following model classifies the current market price position as: Uptrend.
| BRITISH POUND Statistics | SPECULATORS | COMMERCIALS | SMALL TRADERS |
| – Percent of Open Interest Longs: | 15.7 | 73.7 | 8.4 |
| – Percent of Open Interest Shorts: | 46.8 | 39.0 | 12.1 |
| – Net Position: | -87,903 | 98,366 | -10,463 |
| – Gross Longs: | 44,564 | 208,613 | 23,832 |
| – Gross Shorts: | 132,467 | 110,247 | 34,295 |
| – Long to Short Ratio: | 0.3 to 1 | 1.9 to 1 | 0.7 to 1 |
| NET POSITION TREND: | | | |
| – Strength Index Score (3 Year Range Pct): | 7.2 | 91.0 | 26.1 |
| – Strength Index Reading (3 Year Range): | Bearish-Extreme | Bullish-Extreme | Bearish |
| NET POSITION MOVEMENT INDEX: | | | |
| – 6-Week Change in Strength Index: | -10.7 | 12.5 | -21.6 |
Japanese Yen Futures:
 Positioning Notes:
- Japanese Yen large speculator standing this week reached a net position of -123,778 contracts in the data reported through Tuesday.
- Weekly Speculator position rise of 31,314 contracts from the previous week which had a total of -155,092 net contracts.
- This week’s current strength score (range over the past 3 years, measured from 0 to 100) shows the speculators are currently Bearish-Extreme with a score of 16.6 percent.
- The Commercials are Bullish-Extreme with a score of 81.9 percent.
- The Small Traders (not shown in chart) are Bearish with a score of 35.5 percent.
Price Trend-Following Model: Strong Downtrend
Our weekly trend-following model classifies the current market price position as: Strong Downtrend.
| JAPANESE YEN Statistics | SPECULATORS | COMMERCIALS | SMALL TRADERS |
| – Percent of Open Interest Longs: | 28.2 | 56.3 | 10.9 |
| – Percent of Open Interest Shorts: | 59.3 | 25.5 | 10.7 |
| – Net Position: | -123,778 | 122,823 | 955 |
| – Gross Longs: | 112,247 | 224,327 | 43,443 |
| – Gross Shorts: | 236,025 | 101,504 | 42,488 |
| – Long to Short Ratio: | 0.5 to 1 | 2.2 to 1 | 1.0 to 1 |
| NET POSITION TREND: | | | |
| – Strength Index Score (3 Year Range Pct): | 16.6 | 81.9 | 35.5 |
| – Strength Index Reading (3 Year Range): | Bearish-Extreme | Bullish-Extreme | Bearish |
| NET POSITION MOVEMENT INDEX: | | | |
| – 6-Week Change in Strength Index: | -2.5 | 3.8 | -16.5 |
Swiss Franc Futures:
 Positioning Notes:
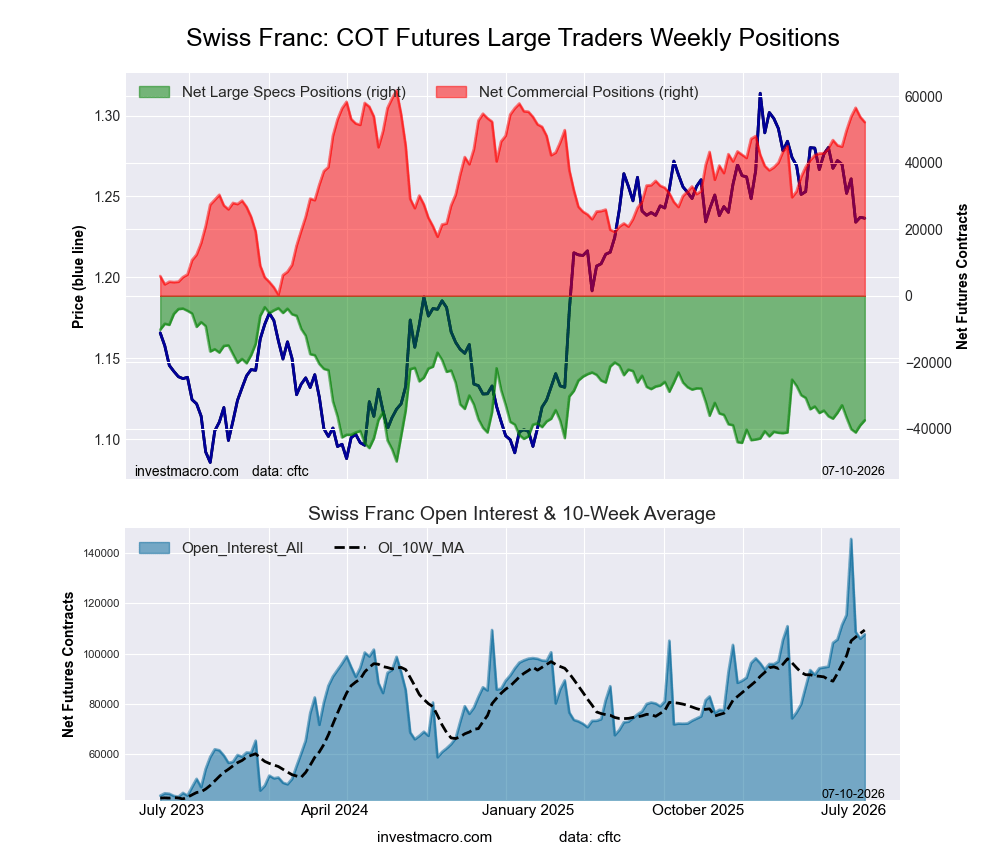
- Swiss Franc large speculator standing this week reached a net position of -37,414 contracts in the data reported through Tuesday.
- Weekly Speculator position advance of 1,544 contracts from the previous week which had a total of -38,958 net contracts.
- This week’s current strength score (range over the past 3 years, measured from 0 to 100) shows the speculators are currently Bearish with a score of 26.7 percent.
- The Commercials are Bullish-Extreme with a score of 84.5 percent.
- The Small Traders (not shown in chart) are Bearish-Extreme with a score of 16.2 percent.
Price Trend-Following Model: Strong Downtrend
Our weekly trend-following model classifies the current market price position as: Strong Downtrend.
| SWISS FRANC Statistics | SPECULATORS | COMMERCIALS | SMALL TRADERS |
| – Percent of Open Interest Longs: | 9.8 | 81.3 | 8.7 |
| – Percent of Open Interest Shorts: | 44.6 | 32.9 | 22.4 |
| – Net Position: | -37,414 | 52,179 | -14,765 |
| – Gross Longs: | 10,561 | 87,557 | 9,362 |
| – Gross Shorts: | 47,975 | 35,378 | 24,127 |
| – Long to Short Ratio: | 0.2 to 1 | 2.5 to 1 | 0.4 to 1 |
| NET POSITION TREND: | | | |
| – Strength Index Score (3 Year Range Pct): | 26.7 | 84.5 | 16.2 |
| – Strength Index Reading (3 Year Range): | Bearish | Bullish-Extreme | Bearish-Extreme |
| NET POSITION MOVEMENT INDEX: | | | |
| – 6-Week Change in Strength Index: | -4.9 | 11.4 | -20.1 |
Canadian Dollar Futures:
 Positioning Notes:
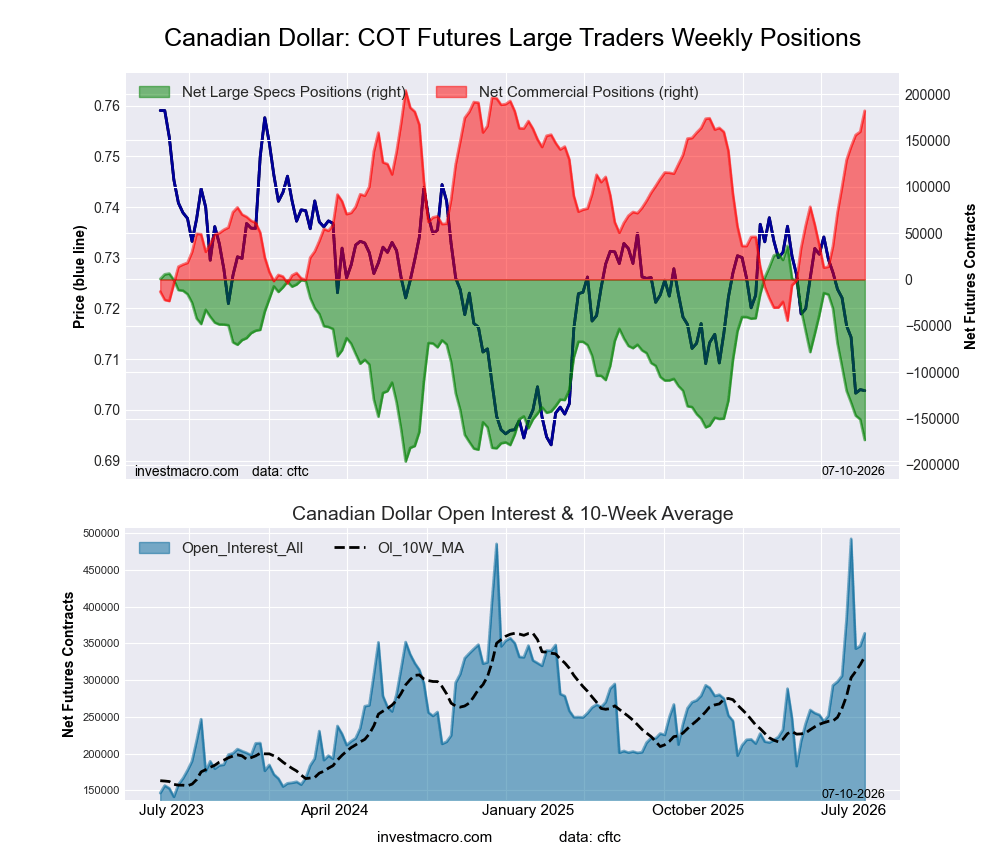
- Canadian Dollar large speculator standing this week reached a net position of -173,126 contracts in the data reported through Tuesday.
- Weekly Speculator position decline of -22,320 contracts from the previous week which had a total of -150,806 net contracts.
- This week’s current strength score (range over the past 3 years, measured from 0 to 100) shows the speculators are currently Bearish-Extreme with a score of 10.0 percent.
- The Commercials are Bullish-Extreme with a score of 91.2 percent.
- The Small Traders (not shown in chart) are Bearish with a score of 22.2 percent.
Price Trend-Following Model: Strong Downtrend
Our weekly trend-following model classifies the current market price position as: Strong Downtrend.
| CANADIAN DOLLAR Statistics | SPECULATORS | COMMERCIALS | SMALL TRADERS |
| – Percent of Open Interest Longs: | 8.7 | 80.4 | 8.6 |
| – Percent of Open Interest Shorts: | 56.3 | 30.4 | 11.0 |
| – Net Position: | -173,126 | 181,996 | -8,870 |
| – Gross Longs: | 31,566 | 292,643 | 31,245 |
| – Gross Shorts: | 204,692 | 110,647 | 40,115 |
| – Long to Short Ratio: | 0.2 to 1 | 2.6 to 1 | 0.8 to 1 |
| NET POSITION TREND: | | | |
| – Strength Index Score (3 Year Range Pct): | 10.0 | 91.2 | 22.2 |
| – Strength Index Reading (3 Year Range): | Bearish-Extreme | Bullish-Extreme | Bearish |
| NET POSITION MOVEMENT INDEX: | | | |
| – 6-Week Change in Strength Index: | -44.9 | 44.4 | -17.8 |
Australian Dollar Futures:
 Positioning Notes:
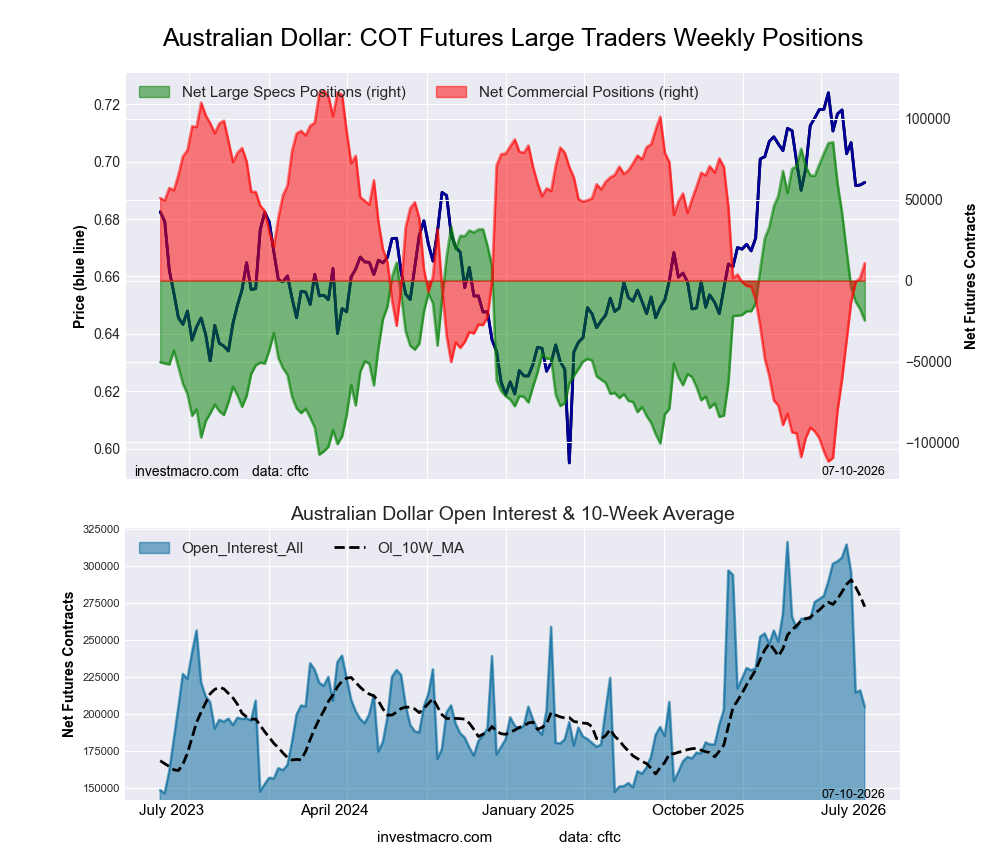
- Australian Dollar large speculator standing this week reached a net position of -24,651 contracts in the data reported through Tuesday.
- Weekly Speculator position decrease of -6,951 contracts from the previous week which had a total of -17,700 net contracts.
- This week’s current strength score (range over the past 3 years, measured from 0 to 100) shows the speculators are currently Bearish with a score of 42.9 percent.
- The Commercials are Bullish with a score of 53.5 percent.
- The Small Traders (not shown in chart) are Bullish with a score of 69.1 percent.
Price Trend-Following Model: Strong Downtrend
Our weekly trend-following model classifies the current market price position as: Strong Downtrend.
| AUSTRALIAN DOLLAR Statistics | SPECULATORS | COMMERCIALS | SMALL TRADERS |
| – Percent of Open Interest Longs: | 35.1 | 45.5 | 16.6 |
| – Percent of Open Interest Shorts: | 47.2 | 40.2 | 9.8 |
| – Net Position: | -24,651 | 10,796 | 13,855 |
| – Gross Longs: | 71,962 | 93,234 | 34,015 |
| – Gross Shorts: | 96,613 | 82,438 | 20,160 |
| – Long to Short Ratio: | 0.7 to 1 | 1.1 to 1 | 1.7 to 1 |
| NET POSITION TREND: | | | |
| – Strength Index Score (3 Year Range Pct): | 42.9 | 53.5 | 69.1 |
| – Strength Index Reading (3 Year Range): | Bearish | Bullish | Bullish |
| NET POSITION MOVEMENT INDEX: | | | |
| – 6-Week Change in Strength Index: | -43.9 | 39.8 | -13.7 |
New Zealand Dollar Futures:
 Positioning Notes:
- New Zealand Dollar large speculator standing this week reached a net position of -65,189 contracts in the data reported through Tuesday.
- Weekly Speculator position lowering of -1,909 contracts from the previous week which had a total of -63,280 net contracts.
- This week’s current strength score (range over the past 3 years, measured from 0 to 100) shows the speculators are currently Bearish-Extreme with a score of 0.0 percent.
- The Commercials are Bullish-Extreme with a score of 100.0 percent.
- The Small Traders (not shown in chart) are Bearish-Extreme with a score of 7.2 percent.
Price Trend-Following Model: Downtrend
Our weekly trend-following model classifies the current market price position as: Downtrend.
| NEW ZEALAND DOLLAR Statistics | SPECULATORS | COMMERCIALS | SMALL TRADERS |
| – Percent of Open Interest Longs: | 9.6 | 87.3 | 2.4 |
| – Percent of Open Interest Shorts: | 67.0 | 26.7 | 5.5 |
| – Net Position: | -65,189 | 68,783 | -3,594 |
| – Gross Longs: | 10,919 | 99,092 | 2,704 |
| – Gross Shorts: | 76,108 | 30,309 | 6,298 |
| – Long to Short Ratio: | 0.1 to 1 | 3.3 to 1 | 0.4 to 1 |
| NET POSITION TREND: | | | |
| – Strength Index Score (3 Year Range Pct): | 0.0 | 100.0 | 7.2 |
| – Strength Index Reading (3 Year Range): | Bearish-Extreme | Bullish-Extreme | Bearish-Extreme |
| NET POSITION MOVEMENT INDEX: | | | |
| – 6-Week Change in Strength Index: | -32.3 | 32.1 | -10.0 |
Mexican Peso Futures:
 Positioning Notes:
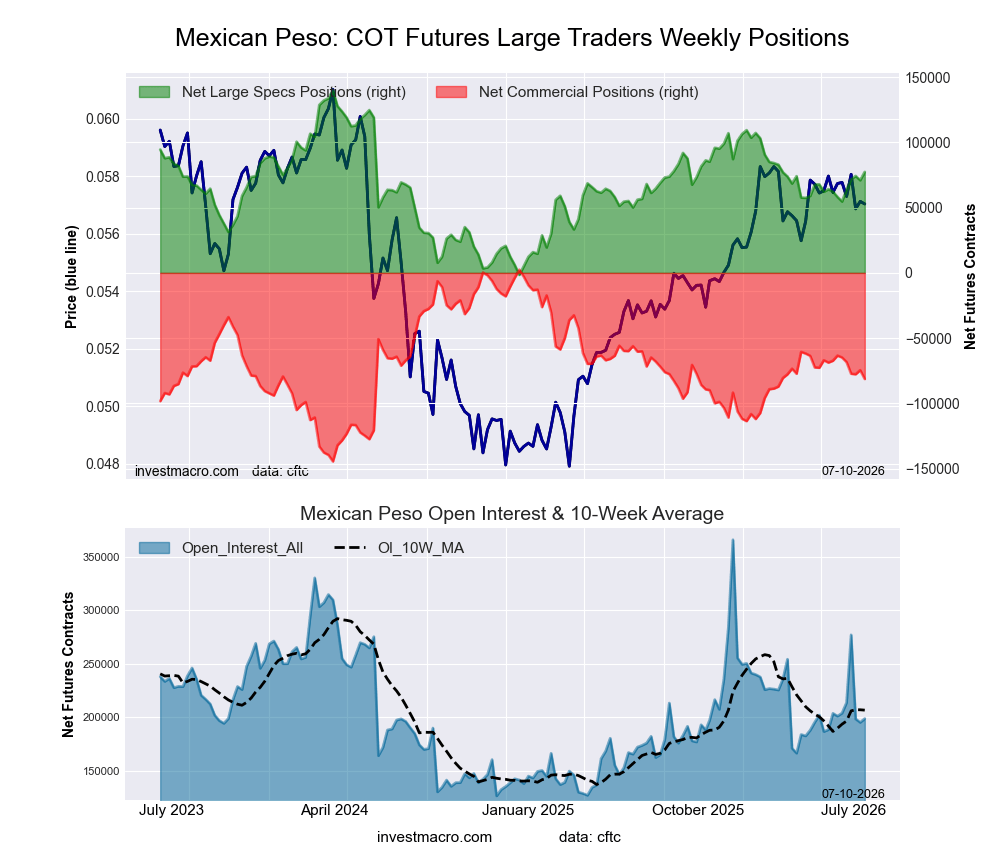
- Mexican Peso large speculator standing this week reached a net position of 77,357 contracts in the data reported through Tuesday.
- Weekly Speculator position rise of 6,421 contracts from the previous week which had a total of 70,936 net contracts.
- This week’s current strength score (range over the past 3 years, measured from 0 to 100) shows the speculators are currently Bullish with a score of 55.9 percent.
- The Commercials are Bearish with a score of 43.0 percent.
- The Small Traders (not shown in chart) are Bullish with a score of 56.1 percent.
Price Trend-Following Model: Uptrend
Our weekly trend-following model classifies the current market price position as: Uptrend.
| MEXICAN PESO Statistics | SPECULATORS | COMMERCIALS | SMALL TRADERS |
| – Percent of Open Interest Longs: | 56.6 | 39.2 | 3.3 |
| – Percent of Open Interest Shorts: | 17.7 | 80.1 | 1.4 |
| – Net Position: | 77,357 | -81,273 | 3,916 |
| – Gross Longs: | 112,628 | 78,016 | 6,612 |
| – Gross Shorts: | 35,271 | 159,289 | 2,696 |
| – Long to Short Ratio: | 3.2 to 1 | 0.5 to 1 | 2.5 to 1 |
| NET POSITION TREND: | | | |
| – Strength Index Score (3 Year Range Pct): | 55.9 | 43.0 | 56.1 |
| – Strength Index Reading (3 Year Range): | Bullish | Bearish | Bullish |
| NET POSITION MOVEMENT INDEX: | | | |
| – 6-Week Change in Strength Index: | 13.6 | -12.2 | -9.2 |
Brazilian Real Futures:
 Positioning Notes:
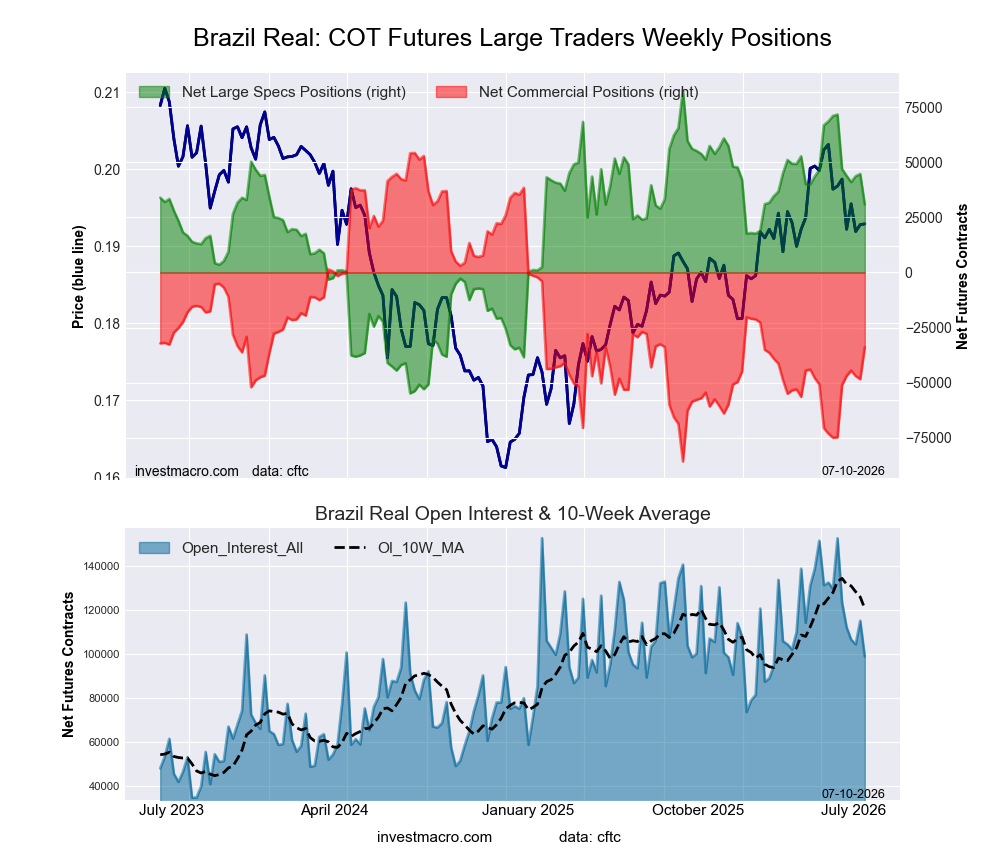
- Brazilian Real large speculator standing this week reached a net position of 30,848 contracts in the data reported through Tuesday.
- Weekly Speculator position decline of -13,826 contracts from the previous week which had a total of 44,674 net contracts.
- This week’s current strength score (range over the past 3 years, measured from 0 to 100) shows the speculators are currently Bullish with a score of 62.4 percent.
- The Commercials are Bearish with a score of 37.0 percent.
- The Small Traders (not shown in chart) are Bearish with a score of 38.0 percent.
Price Trend-Following Model: Weak Uptrend
Our weekly trend-following model classifies the current market price position as: Weak Uptrend.
| BRAZIL REAL Statistics | SPECULATORS | COMMERCIALS | SMALL TRADERS |
| – Percent of Open Interest Longs: | 72.5 | 22.5 | 4.7 |
| – Percent of Open Interest Shorts: | 41.3 | 56.8 | 1.6 |
| – Net Position: | 30,848 | -33,921 | 3,073 |
| – Gross Longs: | 71,636 | 22,206 | 4,668 |
| – Gross Shorts: | 40,788 | 56,127 | 1,595 |
| – Long to Short Ratio: | 1.8 to 1 | 0.4 to 1 | 2.9 to 1 |
| NET POSITION TREND: | | | |
| – Strength Index Score (3 Year Range Pct): | 62.4 | 37.0 | 38.0 |
| – Strength Index Reading (3 Year Range): | Bullish | Bearish | Bearish |
| NET POSITION MOVEMENT INDEX: | | | |
| – 6-Week Change in Strength Index: | -29.7 | 29.2 | -0.5 |
Bitcoin Futures:
 Positioning Notes:
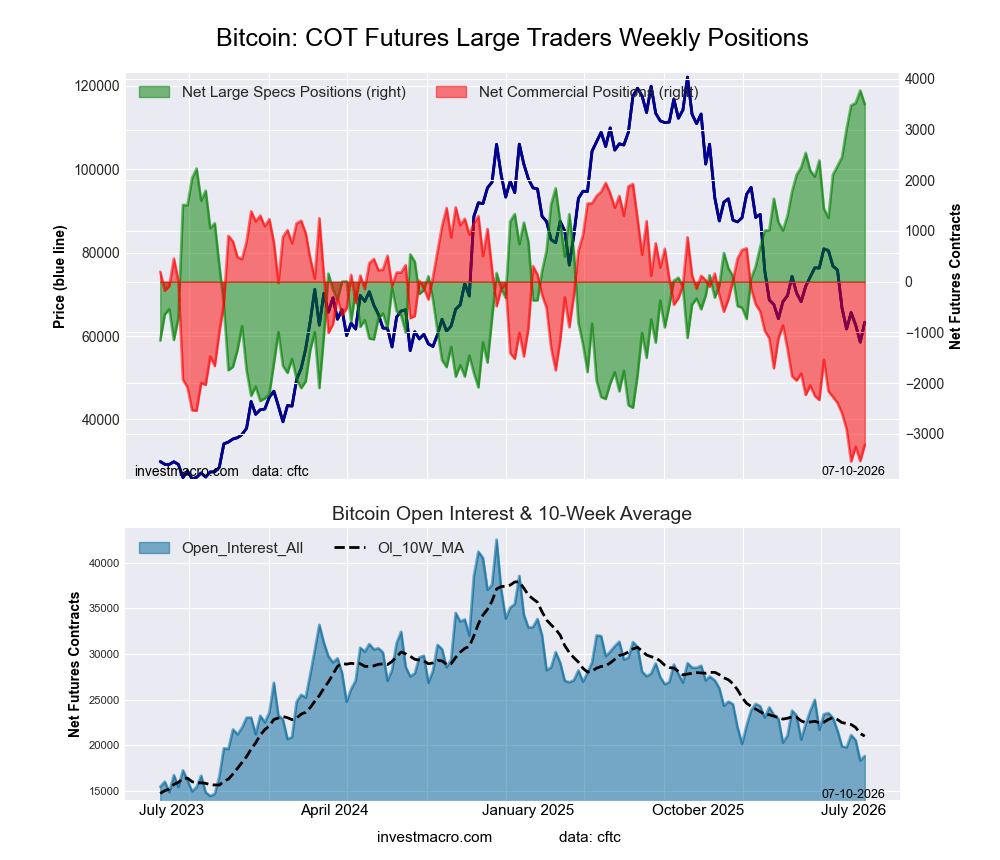
- Bitcoin large speculator standing this week reached a net position of 3,500 contracts in the data reported through Tuesday.
- Weekly Speculator position fall of -270 contracts from the previous week which had a total of 3,770 net contracts.
- This week’s current strength score (range over the past 3 years, measured from 0 to 100) shows the speculators are currently Bullish-Extreme with a score of 95.7 percent.
- The Commercials are Bearish-Extreme with a score of 6.0 percent.
- The Small Traders (not shown in chart) are Bearish with a score of 22.7 percent.
Price Trend-Following Model: Strong Downtrend
Our weekly trend-following model classifies the current market price position as: Strong Downtrend.
| BITCOIN Statistics | SPECULATORS | COMMERCIALS | SMALL TRADERS |
| – Percent of Open Interest Longs: | 85.3 | 0.2 | 4.4 |
| – Percent of Open Interest Shorts: | 66.8 | 17.3 | 5.9 |
| – Net Position: | 3,500 | -3,217 | -283 |
| – Gross Longs: | 16,073 | 38 | 821 |
| – Gross Shorts: | 12,573 | 3,255 | 1,104 |
| – Long to Short Ratio: | 1.3 to 1 | 0.0 to 1 | 0.7 to 1 |
| NET POSITION TREND: | | | |
| – Strength Index Score (3 Year Range Pct): | 95.7 | 6.0 | 22.7 |
| – Strength Index Reading (3 Year Range): | Bullish-Extreme | Bearish-Extreme | Bearish |
| NET POSITION MOVEMENT INDEX: | | | |
| – 6-Week Change in Strength Index: | 19.5 | -15.1 | -20.2 |
Article By InvestMacro – Receive our weekly COT Reports by Email
*COT Report: The COT data, released weekly to the public each Friday, is updated through the most recent Tuesday (data is 3 days old) and shows a quick view of how large speculators or non-commercials (for-profit traders) were positioned in the futures markets.
The CFTC categorizes trader positions according to commercial hedgers (traders who use futures contracts for hedging as part of the business), non-commercials (large traders who speculate to realize trading profits) and nonreportable traders (usually small traders/speculators) as well as their open interest (contracts open in the market at time of reporting).See CFTC criteria here.
All information and opinions on this website and contained in this article are for general informational purposes only and do not constitute investment advice.