
By InvestMacro
Here are the latest charts and statistics for the Commitment of Traders (COT) data published by the Commodities Futures Trading Commission (CFTC).
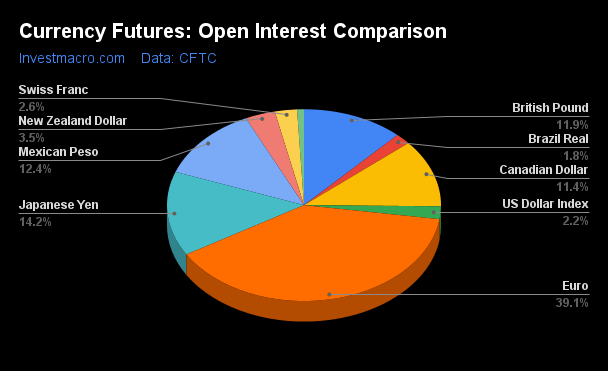
The latest COT data is updated through Tuesday September 12th and shows a quick view of how large market participants (for-profit speculators and commercial traders) were positioned in the futures markets. All currency positions are in direct relation to the US dollar where, for example, a bet for the euro is a bet that the euro will rise versus the dollar while a bet against the euro will be a bet that the euro will decline versus the dollar.
Weekly Speculator Changes led by Australian Dollar & US Dollar Index

The COT currency market speculator bets were overall lower this week as just three out of the eleven currency markets we cover had higher positioning while the other eight markets had lower speculator contracts.
Leading the gains for the currency markets was the Australian Dollar (4,004 contracts) with the US Dollar Index (2,712 contracts) and Bitcoin (193 contracts) also showing positive weeks.
The currencies seeing declines in speculator bets on the week were the EuroFX (-23,151 contracts) with the Canadian Dollar (-16,920 contracts), the Swiss Franc (-4,013 contracts), the Japanese Yen (-1,577 contracts), the Brazilian Real (-756 contracts), Mexican Peso (-650 contracts), the New Zealand Dollar (-620 contracts) and the British Pound (-210 contracts) also registering lower bets on the week.
Currency Traders drop their Euro Bets to 43-Week Low on ECB Rates
Highlighting the COT currency’s data this week is the dropping speculator positioning for the Euro Currency. Large speculative Euro positions dropped sharply this week by over -23,000 contracts and declined for a fourth consecutive week. Euro weekly positions have now decreased for the seventh time in the past eight weeks as well as in nine out of the past eleven weeks.
The Euro speculative standing still remains in a highly bullish level with the net position at a total of +113,080 contracts currently. However, the net position has now fallen by a total of -46,783 contracts in just the past four weeks and by a total of -65,752 contracts over the past eight weeks.
Overall, the Euro net speculator level has been above the +100,000 contract level for forty-six straight weeks and ascended to a 137-week high with a total net position of +187,089 contracts on May 16th – the most bullish point since a total of 188,116 contracts was reached on September 29th of 2020.
The European Central Bank has helped dampen the sentiment for the Euro currency as the bank raised its rate by 25 basis points to 4 percent on Thursday but signaled that there may be no more rate hikes on the docket. The ECB also revised their economic growth projections lower with the bank seeing just 0.7 percent growth in 2023. Following the announcement, many participants are expecting not to see further rate rises and even possible rate cuts if the economy continues to deteriorate.
The Euro currency spot price (versus the US Dollar) has been retreating mightily and this week declined for a ninth consecutive week. The EUR/USD exchange rate closed at 1.0735 on Friday with the low of the week hitting the lowest level since March. The EUR/USD had been as high as 1.1310 on July 18th before starting on its current nine-week downtrend.
| Sep-12-2023 | OI | OI-Index | Spec-Net | Spec-Index | Com-Net | COM-Index | Smalls-Net | Smalls-Index |
|---|---|---|---|---|---|---|---|---|
| USD Index | 40,982 | 37 | 6,071 | 35 | -7,727 | 63 | 1,656 | 26 |
| EUR | 743,759 | 60 | 113,080 | 67 | -149,981 | 33 | 36,901 | 38 |
| GBP | 227,437 | 54 | 46,174 | 88 | -51,168 | 17 | 4,994 | 68 |
| JPY | 270,854 | 92 | -98,713 | 11 | 106,644 | 88 | -7,931 | 37 |
| CHF | 49,945 | 70 | -9,338 | 31 | 12,351 | 62 | -3,013 | 50 |
| CAD | 217,080 | 74 | -41,883 | 15 | 49,275 | 90 | -7,392 | 6 |
| AUD | 256,219 | 100 | -79,533 | 11 | 94,990 | 90 | -15,457 | 15 |
| NZD | 67,487 | 100 | -14,620 | 14 | 17,257 | 87 | -2,637 | 19 |
| MXN | 235,720 | 50 | 66,871 | 80 | -71,492 | 19 | 4,621 | 41 |
| RUB | 20,930 | 4 | 7,543 | 31 | -7,150 | 69 | -393 | 24 |
| BRL | 34,969 | 19 | 13,177 | 53 | -15,160 | 46 | 1,983 | 53 |
| Bitcoin | 15,423 | 73 | 2,232 | 100 | -2,543 | 0 | 311 | 20 |
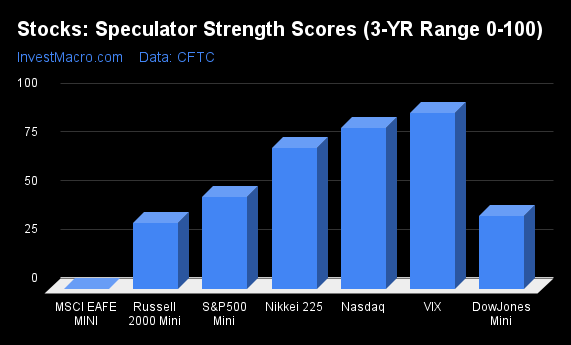
Strength Scores led by Bitcoin & British Pound
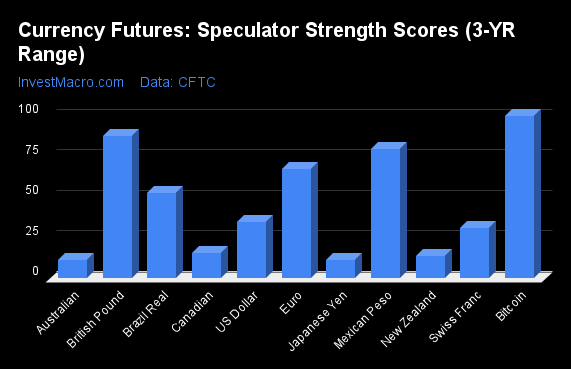
COT Strength Scores (a normalized measure of Speculator positions over a 3-Year range, from 0 to 100 where above 80 is Extreme-Bullish and below 20 is Extreme-Bearish) showed that the Bitcoin (100 percent) and the British Pound (88 percent) lead the currency markets this week. The Mexican Peso (80 percent), EuroFX (67 percent) and the Brazilian Real (53 percent) come in as the next highest in the weekly strength scores.
On the downside, the Australian Dollar (11 percent), the Japanese Yen (11 percent), the New Zealand Dollar (14 percent) and the Canadian Dollar (15 percent) come in at the lowest strength levels currently and are in Extreme-Bearish territory (below 20 percent).
Strength Statistics:
US Dollar Index (35.1 percent) vs US Dollar Index previous week (30.5 percent)
EuroFX (67.4 percent) vs EuroFX previous week (77.1 percent)
British Pound Sterling (87.8 percent) vs British Pound Sterling previous week (88.0 percent)
Japanese Yen (11.4 percent) vs Japanese Yen previous week (12.3 percent)
Swiss Franc (30.9 percent) vs Swiss Franc previous week (41.9 percent)
Canadian Dollar (15.5 percent) vs Canadian Dollar previous week (31.3 percent)
Australian Dollar (11.1 percent) vs Australian Dollar previous week (7.4 percent)
New Zealand Dollar (14.0 percent) vs New Zealand Dollar previous week (15.6 percent)
Mexican Peso (80.0 percent) vs Mexican Peso previous week (80.3 percent)
Brazilian Real (52.6 percent) vs Brazilian Real previous week (53.5 percent)
Bitcoin (100.0 percent) vs Bitcoin previous week (97.1 percent)
Bitcoin & US Dollar Index top the 6-Week Strength Trends

COT Strength Score Trends (or move index, calculates the 6-week changes in strength scores) showed that the Bitcoin (42 percent) and the US Dollar Index (5 percent) lead the past six weeks trends for the currencies.
The Canadian Dollar (-45 percent) leads the downside trend scores currently with the New Zealand Dollar (-44 percent), Brazilian Real (-26 percent) and the Australian Dollar (-26 percent) following next with lower trend scores.
Strength Trend Statistics:
US Dollar Index (4.9 percent) vs US Dollar Index previous week (-4.5 percent)
EuroFX (-24.7 percent) vs EuroFX previous week (-17.2 percent)
British Pound Sterling (-2.4 percent) vs British Pound Sterling previous week (-8.8 percent)
Japanese Yen (-11.6 percent) vs Japanese Yen previous week (-11.5 percent)
Swiss Franc (-1.6 percent) vs Swiss Franc previous week (8.5 percent)
Canadian Dollar (-45.0 percent) vs Canadian Dollar previous week (-28.4 percent)
Australian Dollar (-25.7 percent) vs Australian Dollar previous week (-30.0 percent)
New Zealand Dollar (-43.9 percent) vs New Zealand Dollar previous week (-35.4 percent)
Mexican Peso (-13.2 percent) vs Mexican Peso previous week (-12.4 percent)
Brazilian Real (-25.6 percent) vs Brazilian Real previous week (-22.9 percent)
Bitcoin (41.7 percent) vs Bitcoin previous week (40.4 percent)
Individual COT Forex Markets:
US Dollar Index Futures:
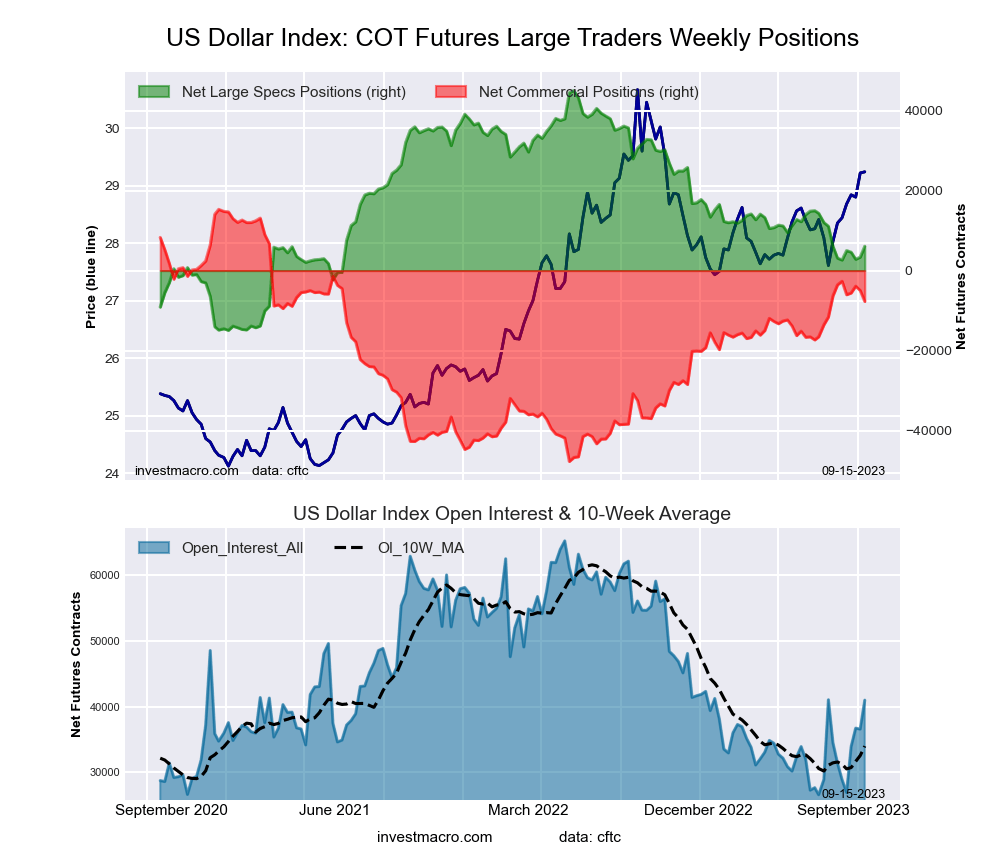 The US Dollar Index large speculator standing this week totaled a net position of 6,071 contracts in the data reported through Tuesday. This was a weekly advance of 2,712 contracts from the previous week which had a total of 3,359 net contracts.
This week’s current strength score (the trader positioning range over the past three years, measured from 0 to 100) shows the speculators are currently Bearish with a score of 35.1 percent. The commercials are Bullish with a score of 63.5 percent and the small traders (not shown in chart) are Bearish with a score of 25.8 percent.
Price Trend-Following Model: Strong Uptrend
Our weekly trend-following model classifies the current market price position as: Strong Uptrend. The current action for the model is considered to be: Hold – Maintain Long Position.
| US DOLLAR INDEX Statistics | SPECULATORS | COMMERCIALS | SMALL TRADERS |
| – Percent of Open Interest Longs: | 61.4 | 19.3 | 11.0 |
| – Percent of Open Interest Shorts: | 46.5 | 38.1 | 7.0 |
| – Net Position: | 6,071 | -7,727 | 1,656 |
| – Gross Longs: | 25,145 | 7,906 | 4,510 |
| – Gross Shorts: | 19,074 | 15,633 | 2,854 |
| – Long to Short Ratio: | 1.3 to 1 | 0.5 to 1 | 1.6 to 1 |
| NET POSITION TREND: | |||
| – Strength Index Score (3 Year Range Pct): | 35.1 | 63.5 | 25.8 |
| – Strength Index Reading (3 Year Range): | Bearish | Bullish | Bearish |
| NET POSITION MOVEMENT INDEX: | |||
| – 6-Week Change in Strength Index: | 4.9 | -6.6 | 14.7 |
Euro Currency Futures:
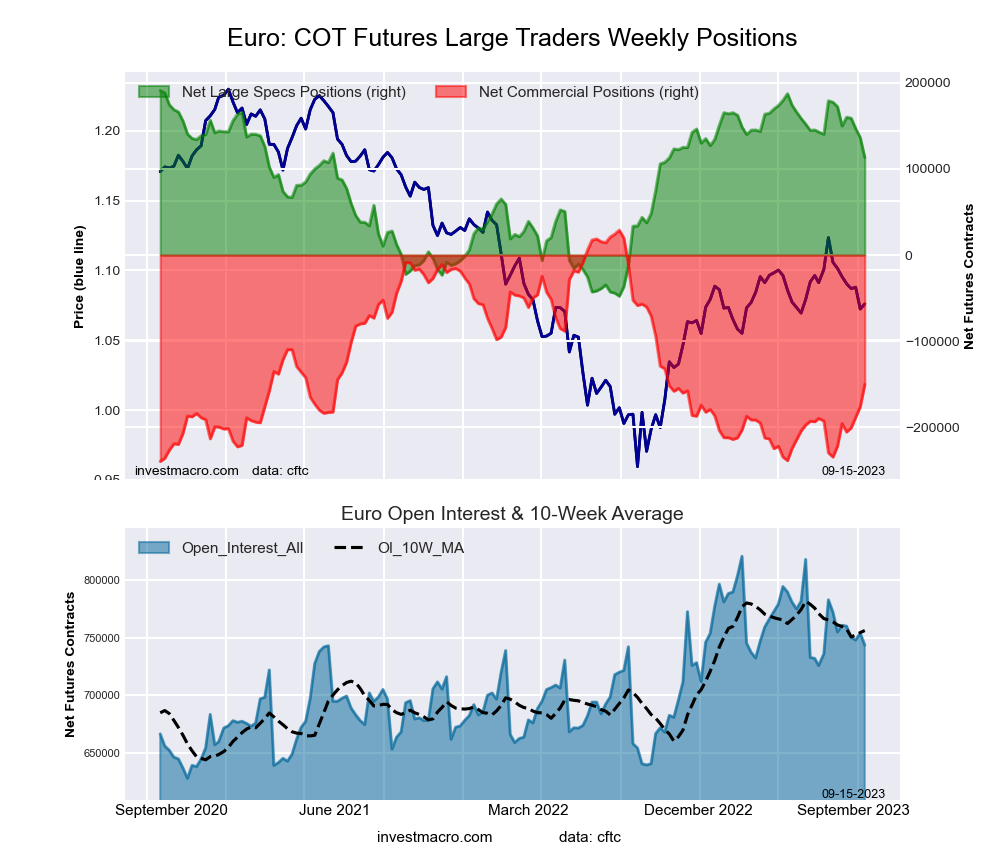 The Euro Currency large speculator standing this week totaled a net position of 113,080 contracts in the data reported through Tuesday. This was a weekly lowering of -23,151 contracts from the previous week which had a total of 136,231 net contracts.
This week’s current strength score (the trader positioning range over the past three years, measured from 0 to 100) shows the speculators are currently Bullish with a score of 67.4 percent. The commercials are Bearish with a score of 33.3 percent and the small traders (not shown in chart) are Bearish with a score of 37.9 percent.
Price Trend-Following Model: Strong Downtrend
Our weekly trend-following model classifies the current market price position as: Strong Downtrend. The current action for the model is considered to be: Hold – Maintain Short Position.
| EURO Currency Statistics | SPECULATORS | COMMERCIALS | SMALL TRADERS |
| – Percent of Open Interest Longs: | 28.6 | 55.5 | 12.5 |
| – Percent of Open Interest Shorts: | 13.4 | 75.7 | 7.5 |
| – Net Position: | 113,080 | -149,981 | 36,901 |
| – Gross Longs: | 212,376 | 412,967 | 92,784 |
| – Gross Shorts: | 99,296 | 562,948 | 55,883 |
| – Long to Short Ratio: | 2.1 to 1 | 0.7 to 1 | 1.7 to 1 |
| NET POSITION TREND: | |||
| – Strength Index Score (3 Year Range Pct): | 67.4 | 33.3 | 37.9 |
| – Strength Index Reading (3 Year Range): | Bullish | Bearish | Bearish |
| NET POSITION MOVEMENT INDEX: | |||
| – 6-Week Change in Strength Index: | -24.7 | 26.7 | -20.1 |
British Pound Sterling Futures:
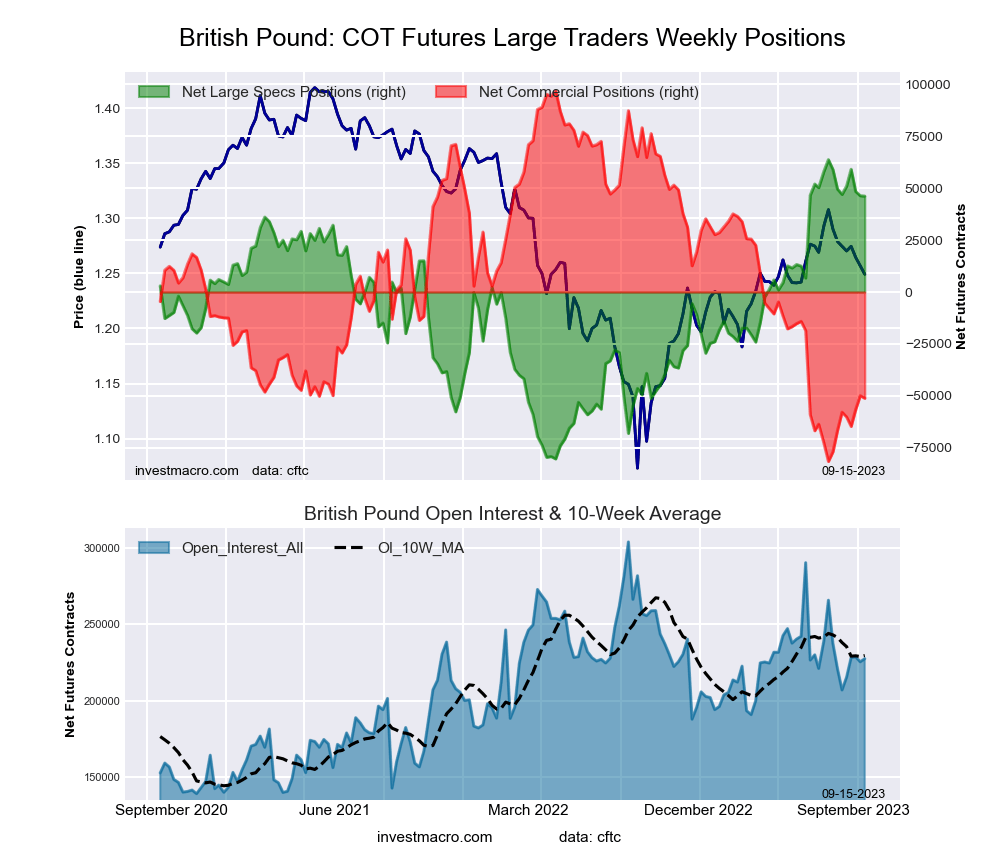 The British Pound Sterling large speculator standing this week totaled a net position of 46,174 contracts in the data reported through Tuesday. This was a weekly reduction of -210 contracts from the previous week which had a total of 46,384 net contracts.
This week’s current strength score (the trader positioning range over the past three years, measured from 0 to 100) shows the speculators are currently Bullish-Extreme with a score of 87.8 percent. The commercials are Bearish-Extreme with a score of 17.0 percent and the small traders (not shown in chart) are Bullish with a score of 67.8 percent.
Price Trend-Following Model: Weak Uptrend
Our weekly trend-following model classifies the current market price position as: Weak Uptrend. The current action for the model is considered to be: Hold – Maintain Long Position.
| BRITISH POUND Statistics | SPECULATORS | COMMERCIALS | SMALL TRADERS |
| – Percent of Open Interest Longs: | 42.8 | 35.4 | 14.1 |
| – Percent of Open Interest Shorts: | 22.5 | 57.9 | 11.9 |
| – Net Position: | 46,174 | -51,168 | 4,994 |
| – Gross Longs: | 97,365 | 80,441 | 32,133 |
| – Gross Shorts: | 51,191 | 131,609 | 27,139 |
| – Long to Short Ratio: | 1.9 to 1 | 0.6 to 1 | 1.2 to 1 |
| NET POSITION TREND: | |||
| – Strength Index Score (3 Year Range Pct): | 87.8 | 17.0 | 67.8 |
| – Strength Index Reading (3 Year Range): | Bullish-Extreme | Bearish-Extreme | Bullish |
| NET POSITION MOVEMENT INDEX: | |||
| – 6-Week Change in Strength Index: | -2.4 | 8.7 | -23.9 |
Japanese Yen Futures:
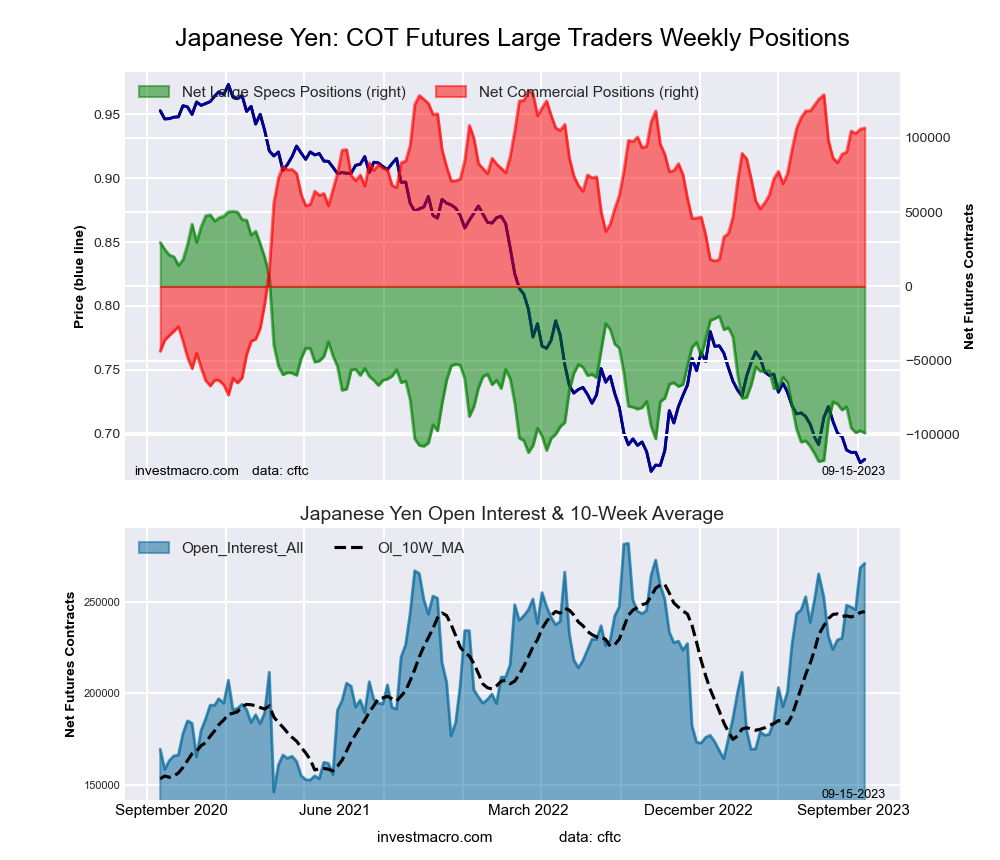 The Japanese Yen large speculator standing this week totaled a net position of -98,713 contracts in the data reported through Tuesday. This was a weekly reduction of -1,577 contracts from the previous week which had a total of -97,136 net contracts.
This week’s current strength score (the trader positioning range over the past three years, measured from 0 to 100) shows the speculators are currently Bearish-Extreme with a score of 11.4 percent. The commercials are Bullish-Extreme with a score of 87.7 percent and the small traders (not shown in chart) are Bearish with a score of 37.3 percent.
Price Trend-Following Model: Strong Downtrend
Our weekly trend-following model classifies the current market price position as: Strong Downtrend. The current action for the model is considered to be: Hold – Maintain Short Position.
| JAPANESE YEN Statistics | SPECULATORS | COMMERCIALS | SMALL TRADERS |
| – Percent of Open Interest Longs: | 14.1 | 67.8 | 13.3 |
| – Percent of Open Interest Shorts: | 50.6 | 28.4 | 16.2 |
| – Net Position: | -98,713 | 106,644 | -7,931 |
| – Gross Longs: | 38,247 | 183,589 | 36,043 |
| – Gross Shorts: | 136,960 | 76,945 | 43,974 |
| – Long to Short Ratio: | 0.3 to 1 | 2.4 to 1 | 0.8 to 1 |
| NET POSITION TREND: | |||
| – Strength Index Score (3 Year Range Pct): | 11.4 | 87.7 | 37.3 |
| – Strength Index Reading (3 Year Range): | Bearish-Extreme | Bullish-Extreme | Bearish |
| NET POSITION MOVEMENT INDEX: | |||
| – 6-Week Change in Strength Index: | -11.6 | 11.4 | -7.8 |
Swiss Franc Futures:
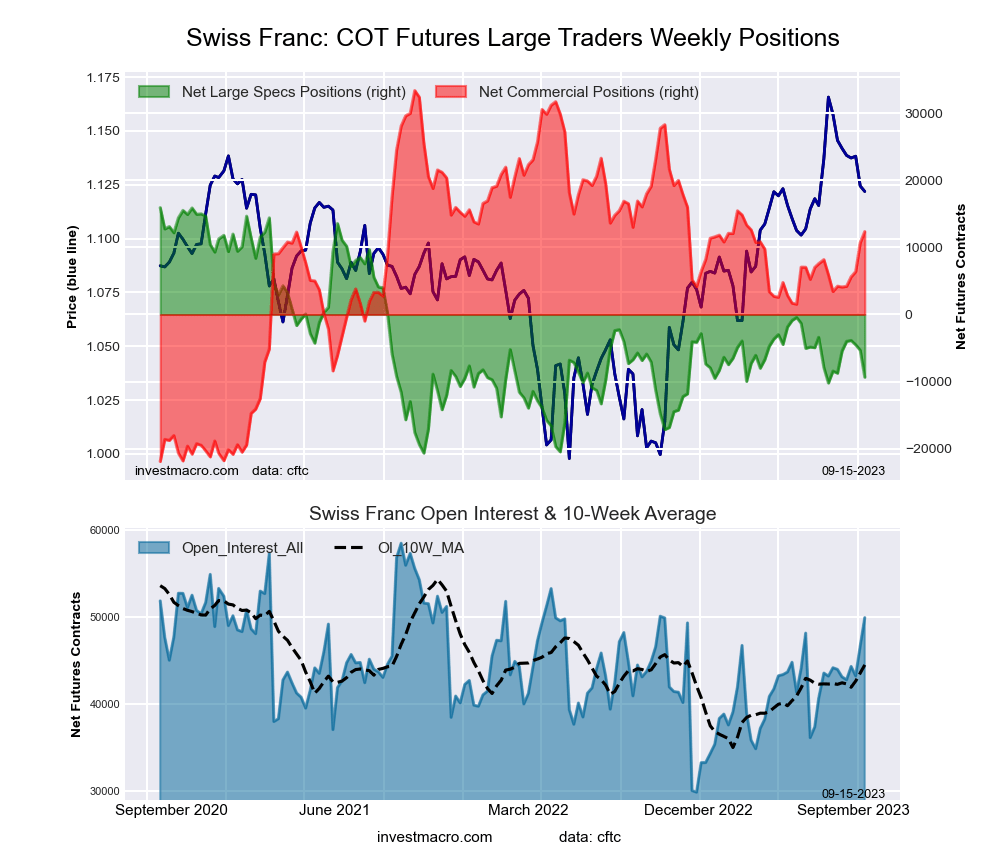 The Swiss Franc large speculator standing this week totaled a net position of -9,338 contracts in the data reported through Tuesday. This was a weekly fall of -4,013 contracts from the previous week which had a total of -5,325 net contracts.
This week’s current strength score (the trader positioning range over the past three years, measured from 0 to 100) shows the speculators are currently Bearish with a score of 30.9 percent. The commercials are Bullish with a score of 62.0 percent and the small traders (not shown in chart) are Bullish with a score of 50.3 percent.
Price Trend-Following Model: Weak Uptrend
Our weekly trend-following model classifies the current market price position as: Weak Uptrend. The current action for the model is considered to be: Hold – Maintain Long Position.
| SWISS FRANC Statistics | SPECULATORS | COMMERCIALS | SMALL TRADERS |
| – Percent of Open Interest Longs: | 18.0 | 52.1 | 27.6 |
| – Percent of Open Interest Shorts: | 36.7 | 27.4 | 33.6 |
| – Net Position: | -9,338 | 12,351 | -3,013 |
| – Gross Longs: | 9,009 | 26,017 | 13,771 |
| – Gross Shorts: | 18,347 | 13,666 | 16,784 |
| – Long to Short Ratio: | 0.5 to 1 | 1.9 to 1 | 0.8 to 1 |
| NET POSITION TREND: | |||
| – Strength Index Score (3 Year Range Pct): | 30.9 | 62.0 | 50.3 |
| – Strength Index Reading (3 Year Range): | Bearish | Bullish | Bullish |
| NET POSITION MOVEMENT INDEX: | |||
| – 6-Week Change in Strength Index: | -1.6 | 14.7 | -27.2 |
Canadian Dollar Futures:
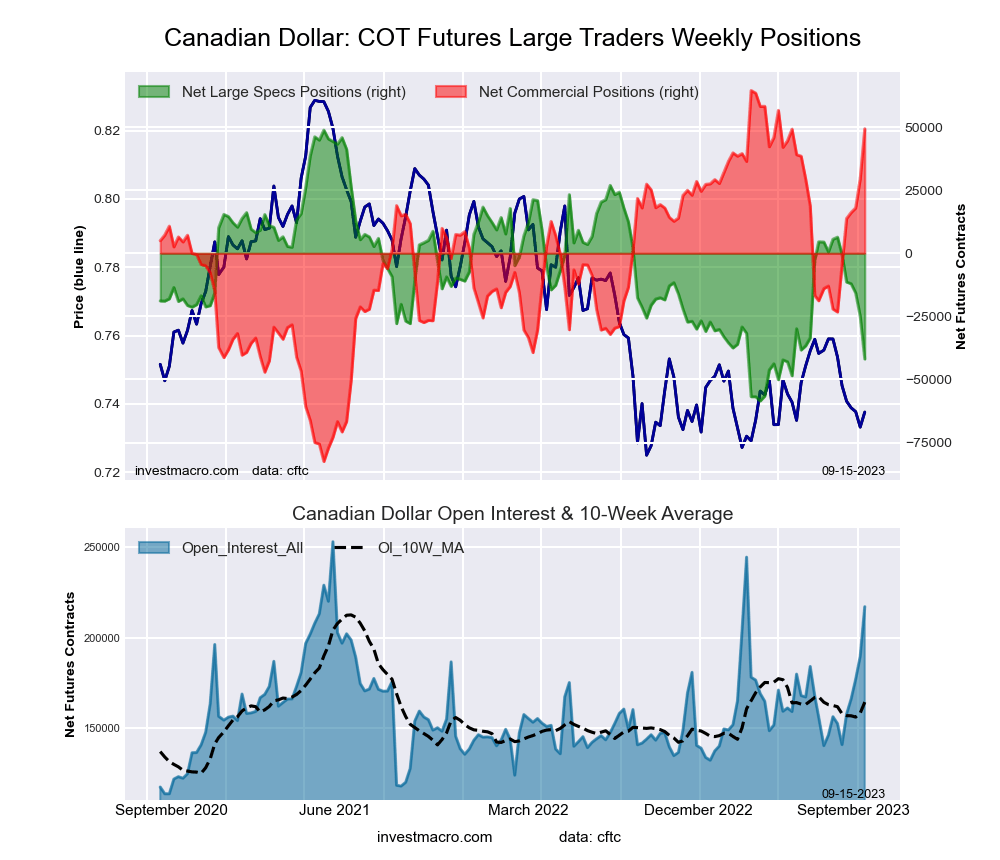 The Canadian Dollar large speculator standing this week totaled a net position of -41,883 contracts in the data reported through Tuesday. This was a weekly reduction of -16,920 contracts from the previous week which had a total of -24,963 net contracts.
This week’s current strength score (the trader positioning range over the past three years, measured from 0 to 100) shows the speculators are currently Bearish-Extreme with a score of 15.5 percent. The commercials are Bullish-Extreme with a score of 89.7 percent and the small traders (not shown in chart) are Bearish-Extreme with a score of 6.4 percent.
Price Trend-Following Model: Strong Downtrend
Our weekly trend-following model classifies the current market price position as: Strong Downtrend. The current action for the model is considered to be: Hold – Maintain Short Position.
| CANADIAN DOLLAR Statistics | SPECULATORS | COMMERCIALS | SMALL TRADERS |
| – Percent of Open Interest Longs: | 18.6 | 60.8 | 14.6 |
| – Percent of Open Interest Shorts: | 37.9 | 38.1 | 18.0 |
| – Net Position: | -41,883 | 49,275 | -7,392 |
| – Gross Longs: | 40,298 | 131,976 | 31,767 |
| – Gross Shorts: | 82,181 | 82,701 | 39,159 |
| – Long to Short Ratio: | 0.5 to 1 | 1.6 to 1 | 0.8 to 1 |
| NET POSITION TREND: | |||
| – Strength Index Score (3 Year Range Pct): | 15.5 | 89.7 | 6.4 |
| – Strength Index Reading (3 Year Range): | Bearish-Extreme | Bullish-Extreme | Bearish-Extreme |
| NET POSITION MOVEMENT INDEX: | |||
| – 6-Week Change in Strength Index: | -45.0 | 49.4 | -54.0 |
Australian Dollar Futures:
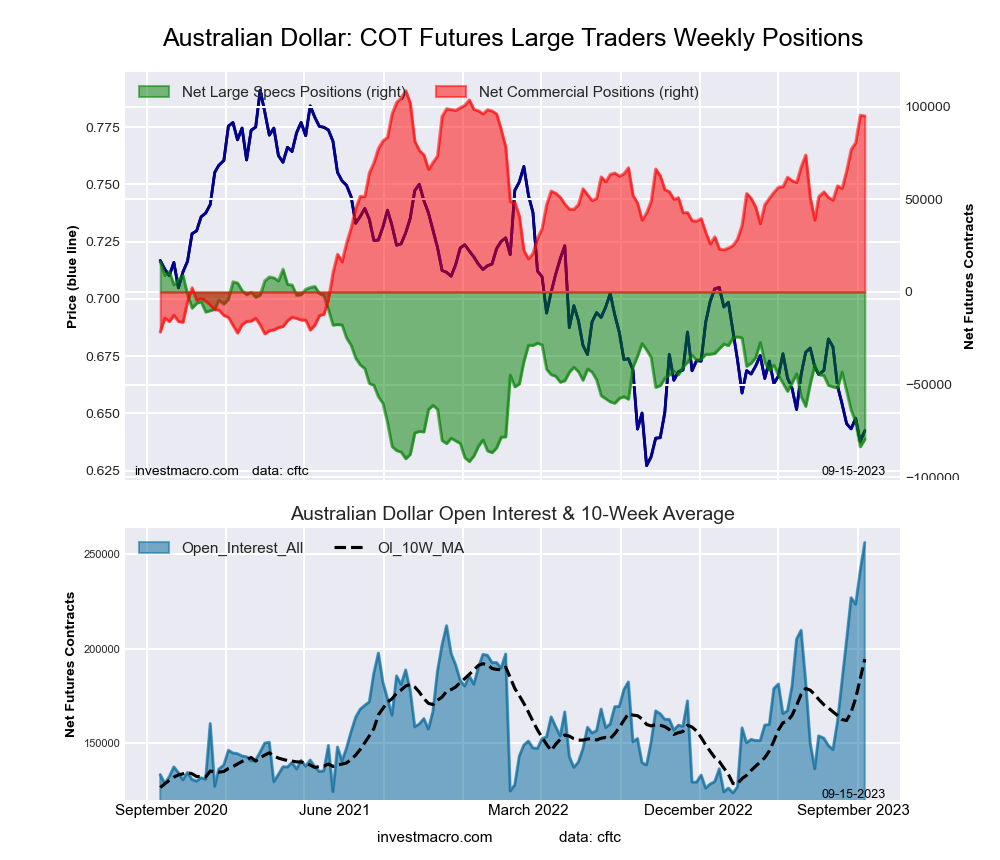 The Australian Dollar large speculator standing this week totaled a net position of -79,533 contracts in the data reported through Tuesday. This was a weekly advance of 4,004 contracts from the previous week which had a total of -83,537 net contracts.
This week’s current strength score (the trader positioning range over the past three years, measured from 0 to 100) shows the speculators are currently Bearish-Extreme with a score of 11.1 percent. The commercials are Bullish-Extreme with a score of 89.6 percent and the small traders (not shown in chart) are Bearish-Extreme with a score of 14.7 percent.
Price Trend-Following Model: Strong Downtrend
Our weekly trend-following model classifies the current market price position as: Strong Downtrend. The current action for the model is considered to be: Hold – Maintain Short Position.
| AUSTRALIAN DOLLAR Statistics | SPECULATORS | COMMERCIALS | SMALL TRADERS |
| – Percent of Open Interest Longs: | 18.5 | 64.4 | 8.7 |
| – Percent of Open Interest Shorts: | 49.5 | 27.3 | 14.7 |
| – Net Position: | -79,533 | 94,990 | -15,457 |
| – Gross Longs: | 47,309 | 164,961 | 22,273 |
| – Gross Shorts: | 126,842 | 69,971 | 37,730 |
| – Long to Short Ratio: | 0.4 to 1 | 2.4 to 1 | 0.6 to 1 |
| NET POSITION TREND: | |||
| – Strength Index Score (3 Year Range Pct): | 11.1 | 89.6 | 14.7 |
| – Strength Index Reading (3 Year Range): | Bearish-Extreme | Bullish-Extreme | Bearish-Extreme |
| NET POSITION MOVEMENT INDEX: | |||
| – 6-Week Change in Strength Index: | -25.7 | 28.7 | -24.3 |
New Zealand Dollar Futures:
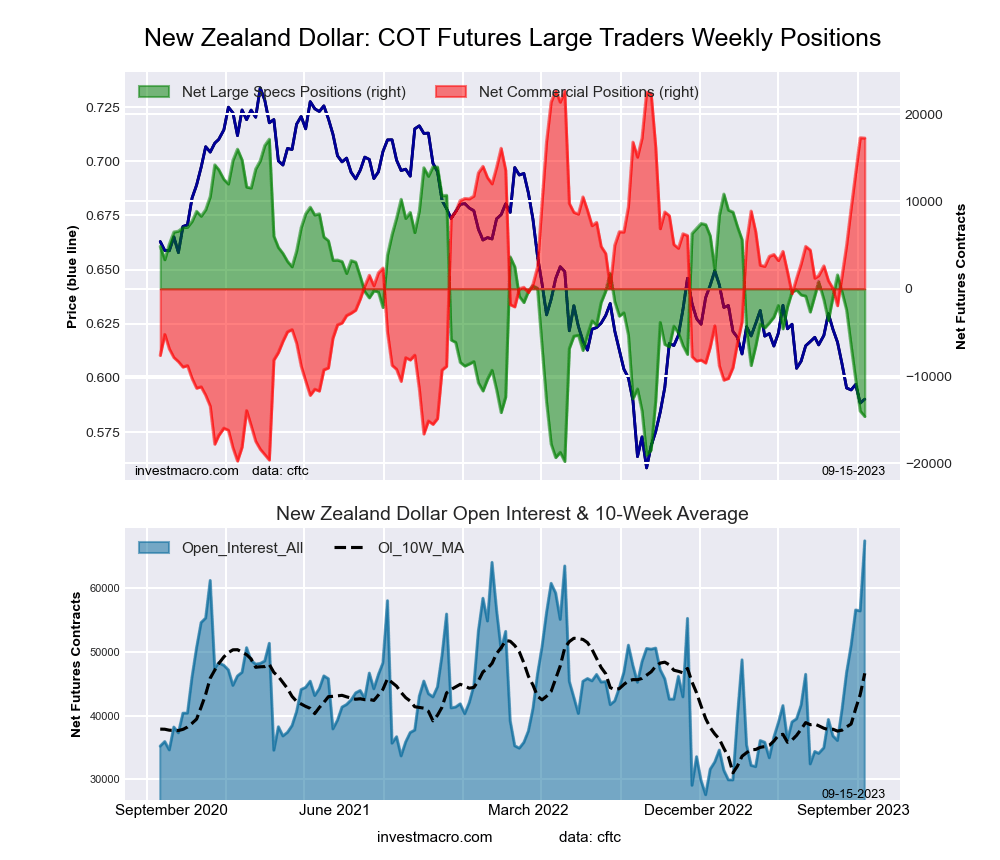 The New Zealand Dollar large speculator standing this week totaled a net position of -14,620 contracts in the data reported through Tuesday. This was a weekly lowering of -620 contracts from the previous week which had a total of -14,000 net contracts.
This week’s current strength score (the trader positioning range over the past three years, measured from 0 to 100) shows the speculators are currently Bearish-Extreme with a score of 14.0 percent. The commercials are Bullish-Extreme with a score of 87.2 percent and the small traders (not shown in chart) are Bearish-Extreme with a score of 18.6 percent.
Price Trend-Following Model: Strong Downtrend
Our weekly trend-following model classifies the current market price position as: Strong Downtrend. The current action for the model is considered to be: Hold – Maintain Short Position.
| NEW ZEALAND DOLLAR Statistics | SPECULATORS | COMMERCIALS | SMALL TRADERS |
| – Percent of Open Interest Longs: | 21.9 | 62.8 | 5.1 |
| – Percent of Open Interest Shorts: | 43.6 | 37.2 | 9.0 |
| – Net Position: | -14,620 | 17,257 | -2,637 |
| – Gross Longs: | 14,797 | 42,395 | 3,420 |
| – Gross Shorts: | 29,417 | 25,138 | 6,057 |
| – Long to Short Ratio: | 0.5 to 1 | 1.7 to 1 | 0.6 to 1 |
| NET POSITION TREND: | |||
| – Strength Index Score (3 Year Range Pct): | 14.0 | 87.2 | 18.6 |
| – Strength Index Reading (3 Year Range): | Bearish-Extreme | Bullish-Extreme | Bearish-Extreme |
| NET POSITION MOVEMENT INDEX: | |||
| – 6-Week Change in Strength Index: | -43.9 | 45.2 | -35.5 |
Mexican Peso Futures:
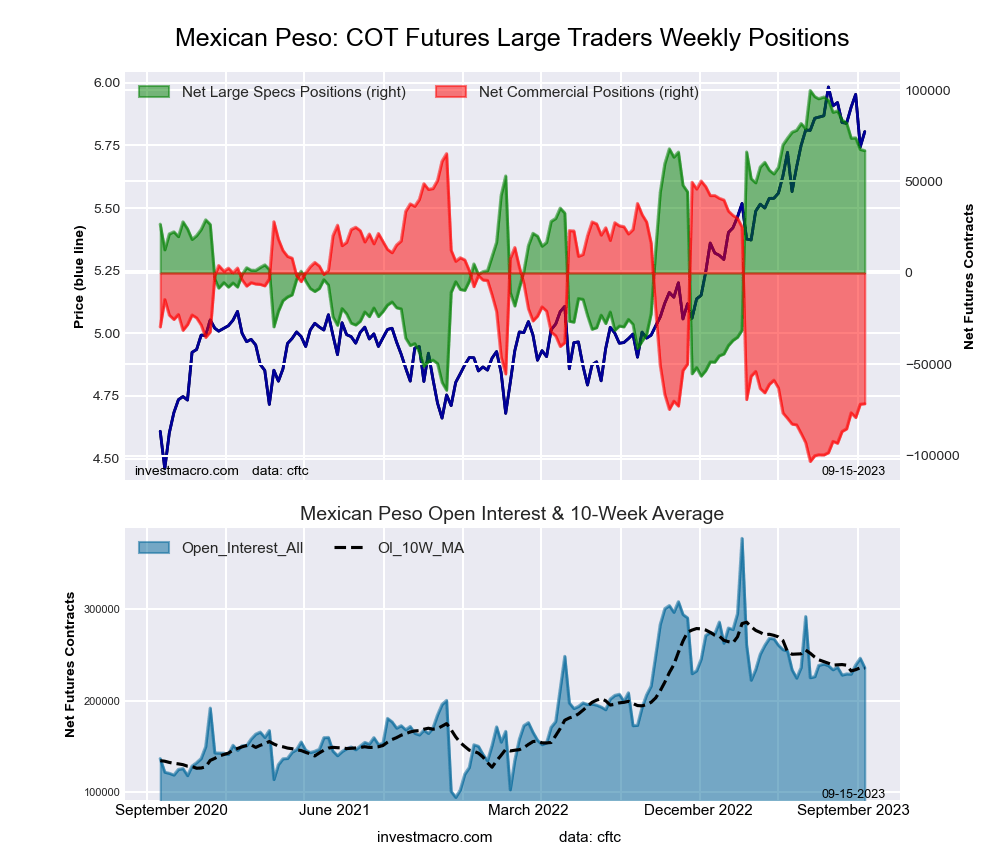 The Mexican Peso large speculator standing this week totaled a net position of 66,871 contracts in the data reported through Tuesday. This was a weekly fall of -650 contracts from the previous week which had a total of 67,521 net contracts.
This week’s current strength score (the trader positioning range over the past three years, measured from 0 to 100) shows the speculators are currently Bullish with a score of 80.0 percent. The commercials are Bearish-Extreme with a score of 18.7 percent and the small traders (not shown in chart) are Bearish with a score of 40.7 percent.
Price Trend-Following Model: Uptrend
Our weekly trend-following model classifies the current market price position as: Uptrend. The current action for the model is considered to be: Hold – Maintain Long Position.
| MEXICAN PESO Statistics | SPECULATORS | COMMERCIALS | SMALL TRADERS |
| – Percent of Open Interest Longs: | 39.5 | 52.4 | 3.1 |
| – Percent of Open Interest Shorts: | 11.1 | 82.8 | 1.1 |
| – Net Position: | 66,871 | -71,492 | 4,621 |
| – Gross Longs: | 93,022 | 123,575 | 7,268 |
| – Gross Shorts: | 26,151 | 195,067 | 2,647 |
| – Long to Short Ratio: | 3.6 to 1 | 0.6 to 1 | 2.7 to 1 |
| NET POSITION TREND: | |||
| – Strength Index Score (3 Year Range Pct): | 80.0 | 18.7 | 40.7 |
| – Strength Index Reading (3 Year Range): | Bullish | Bearish-Extreme | Bearish |
| NET POSITION MOVEMENT INDEX: | |||
| – 6-Week Change in Strength Index: | -13.2 | 12.8 | 0.5 |
Brazilian Real Futures:
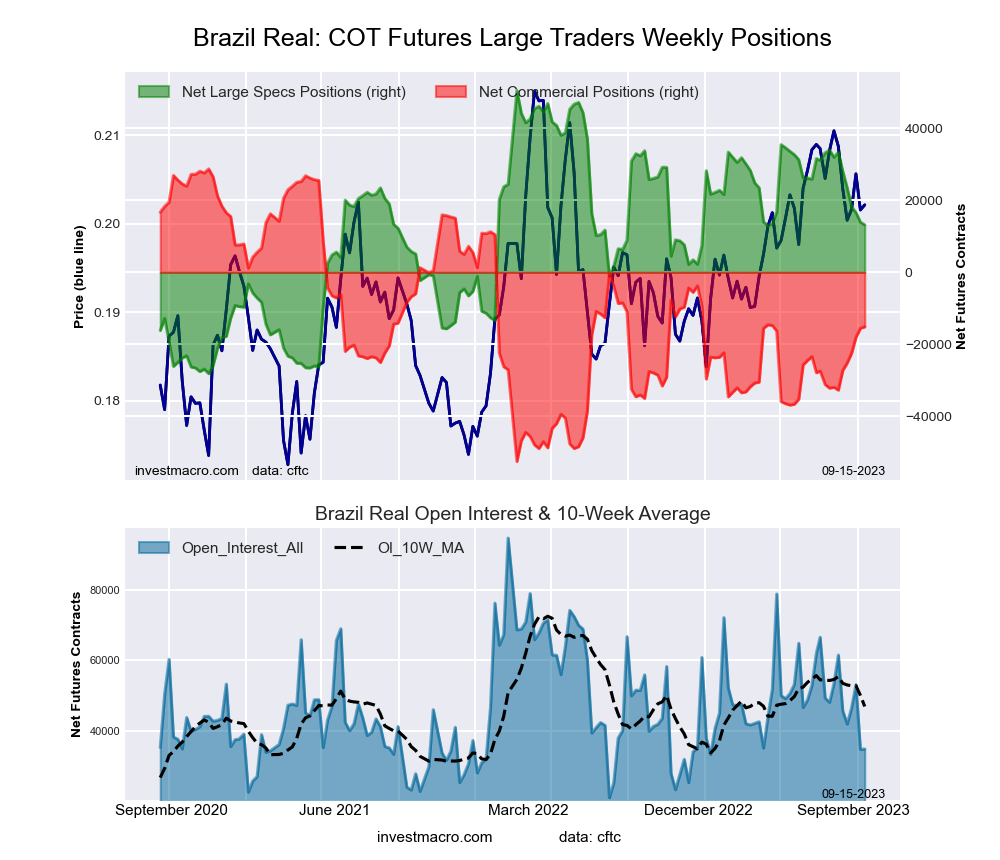 The Brazilian Real large speculator standing this week totaled a net position of 13,177 contracts in the data reported through Tuesday. This was a weekly decline of -756 contracts from the previous week which had a total of 13,933 net contracts.
This week’s current strength score (the trader positioning range over the past three years, measured from 0 to 100) shows the speculators are currently Bullish with a score of 52.6 percent. The commercials are Bearish with a score of 46.0 percent and the small traders (not shown in chart) are Bullish with a score of 52.9 percent.
Price Trend-Following Model: Uptrend
Our weekly trend-following model classifies the current market price position as: Uptrend. The current action for the model is considered to be: Hold – Maintain Long Position.
| BRAZIL REAL Statistics | SPECULATORS | COMMERCIALS | SMALL TRADERS |
| – Percent of Open Interest Longs: | 56.3 | 33.1 | 9.5 |
| – Percent of Open Interest Shorts: | 18.6 | 76.4 | 3.8 |
| – Net Position: | 13,177 | -15,160 | 1,983 |
| – Gross Longs: | 19,696 | 11,568 | 3,305 |
| – Gross Shorts: | 6,519 | 26,728 | 1,322 |
| – Long to Short Ratio: | 3.0 to 1 | 0.4 to 1 | 2.5 to 1 |
| NET POSITION TREND: | |||
| – Strength Index Score (3 Year Range Pct): | 52.6 | 46.0 | 52.9 |
| – Strength Index Reading (3 Year Range): | Bullish | Bearish | Bullish |
| NET POSITION MOVEMENT INDEX: | |||
| – 6-Week Change in Strength Index: | -25.6 | 21.6 | 24.1 |
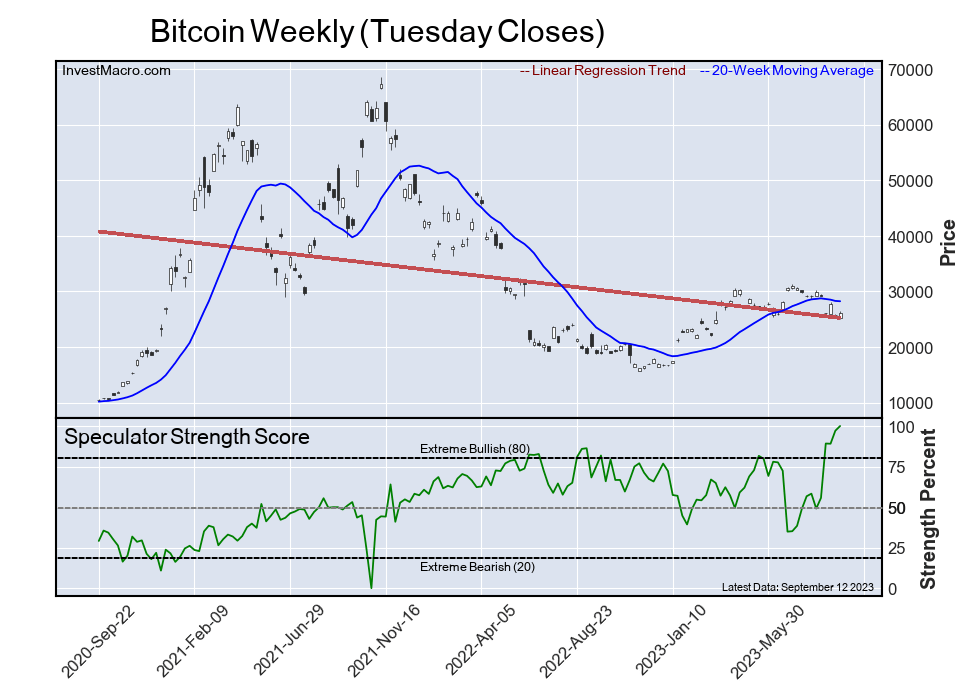
Bitcoin Futures:
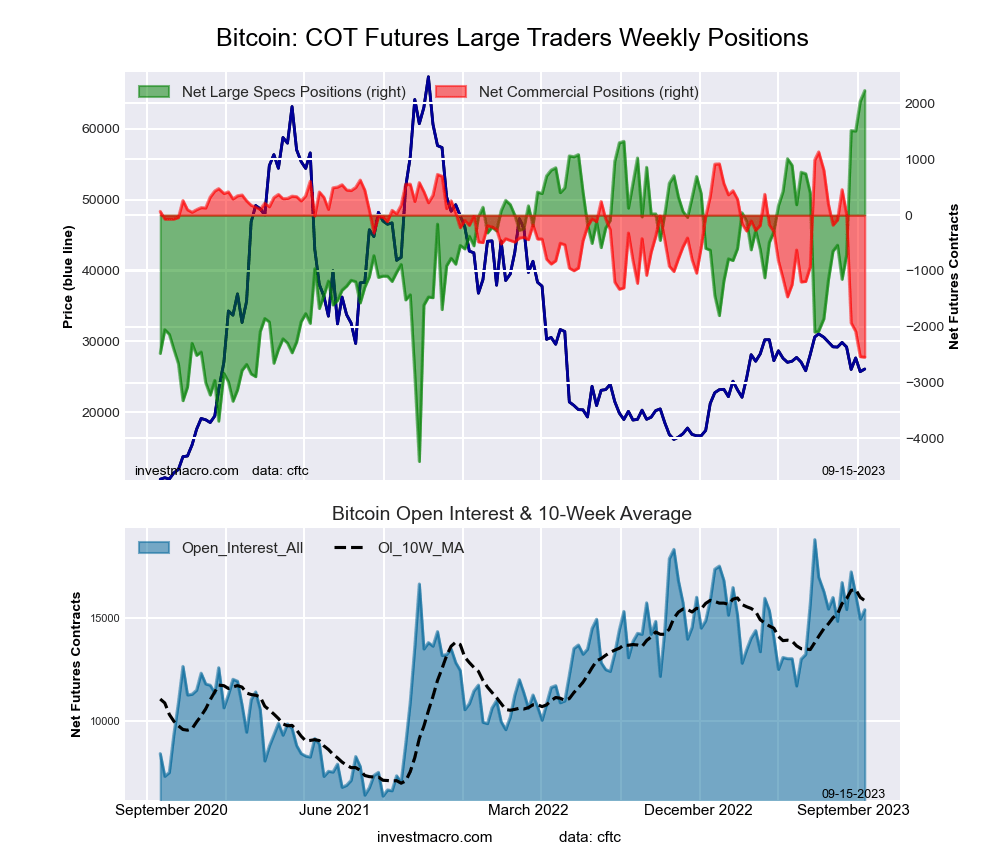 The Bitcoin large speculator standing this week totaled a net position of 2,232 contracts in the data reported through Tuesday. This was a weekly rise of 193 contracts from the previous week which had a total of 2,039 net contracts.
This week’s current strength score (the trader positioning range over the past three years, measured from 0 to 100) shows the speculators are currently Bullish-Extreme with a score of 100.0 percent. The commercials are Bearish-Extreme with a score of 0.0 percent and the small traders (not shown in chart) are Bearish with a score of 20.0 percent.
Price Trend-Following Model: Strong Downtrend
Our weekly trend-following model classifies the current market price position as: Strong Downtrend. The current action for the model is considered to be: Hold – Maintain Short Position.
| BITCOIN Statistics | SPECULATORS | COMMERCIALS | SMALL TRADERS |
| – Percent of Open Interest Longs: | 77.1 | 0.8 | 7.4 |
| – Percent of Open Interest Shorts: | 62.6 | 17.2 | 5.3 |
| – Net Position: | 2,232 | -2,543 | 311 |
| – Gross Longs: | 11,893 | 117 | 1,134 |
| – Gross Shorts: | 9,661 | 2,660 | 823 |
| – Long to Short Ratio: | 1.2 to 1 | 0.0 to 1 | 1.4 to 1 |
| NET POSITION TREND: | |||
| – Strength Index Score (3 Year Range Pct): | 100.0 | 0.0 | 20.0 |
| – Strength Index Reading (3 Year Range): | Bullish-Extreme | Bearish-Extreme | Bearish |
| NET POSITION MOVEMENT INDEX: | |||
| – 6-Week Change in Strength Index: | 41.7 | -66.9 | -7.1 |
Article By InvestMacro – Receive our weekly COT Newsletter
*COT Report: The COT data, released weekly to the public each Friday, is updated through the most recent Tuesday (data is 3 days old) and shows a quick view of how large speculators or non-commercials (for-profit traders) were positioned in the futures markets.
The CFTC categorizes trader positions according to commercial hedgers (traders who use futures contracts for hedging as part of the business), non-commercials (large traders who speculate to realize trading profits) and nonreportable traders (usually small traders/speculators) as well as their open interest (contracts open in the market at time of reporting). See CFTC criteria here.


